. 2018 Oct 30;115(44):11192-11197.
doi: 10.1073/pnas.1804194115. Epub 2018 Oct 15.

Single-molecule DNA-mapping and whole-genome sequencing of individual cells

Affiliations

Single-molecule DNA-mapping and whole-genome sequencing of individual cells

Rodolphe Marie et al. Proc Natl Acad Sci U S A. .

Abstract

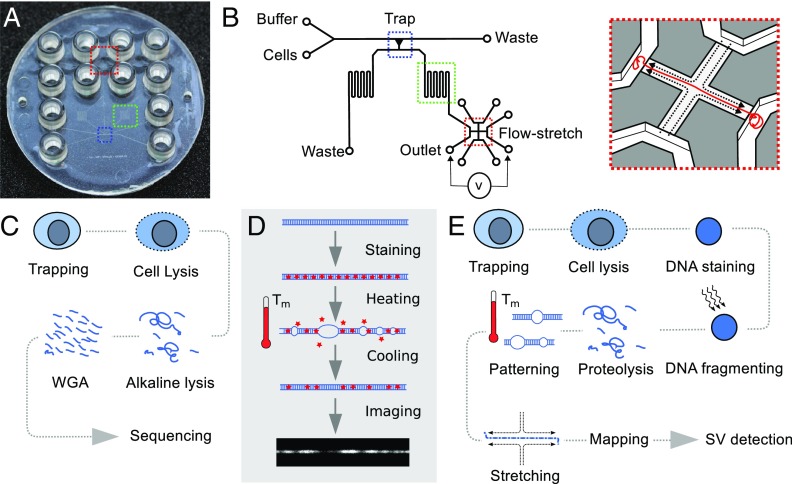
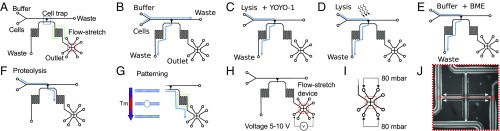
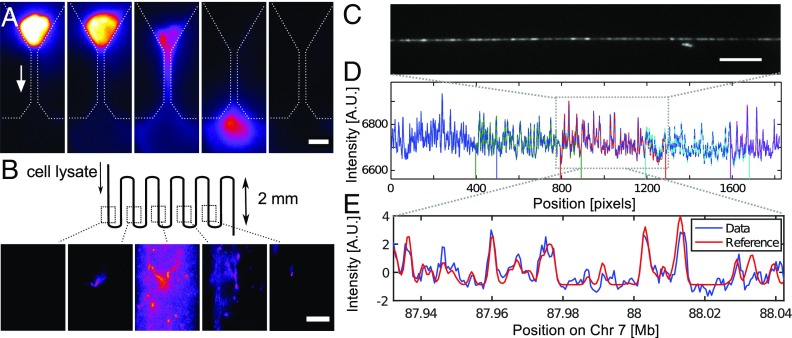
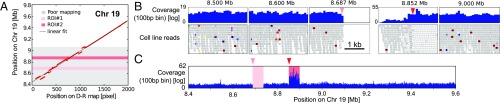
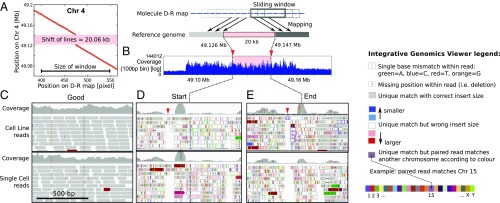
To elucidate cellular diversity and clonal evolution in tissues and tumors, one must resolve genomic heterogeneity in single cells. To this end, we have developed low-cost, mass-producible micro-/nanofluidic chips for DNA extraction from individual cells. These chips have modules that collect genomic DNA for sequencing or map genomic structure directly, on-chip, with denaturation-renaturation (D-R) optical mapping [Marie R, et al. (2013) Proc Natl Acad Sci USA 110:4893-4898]. Processing of single cells from the LS174T colorectal cancer cell line showed that D-R mapping of single molecules can reveal structural variation (SV) in the genome of single cells. In one experiment, we processed 17 fragments covering 19.8 Mb of the cell's genome. One megabase-large fragment aligned well to chromosome 19 with half its length, while the other half showed variable alignment. Paired-end single-cell sequencing supported this finding, revealing a region of complexity and a 50-kb deletion. Sequencing struggled, however, to detect a 20-kb gap that D-R mapping showed clearly in a megabase fragment that otherwise mapped well to the reference at the pericentromeric region of chromosome 4. Pericentromeric regions are complex and show substantial sequence homology between different chromosomes, making mapping of sequence reads ambiguous. Thus, D-R mapping directly, from a single molecule, revealed characteristics of the single-cell genome that were challenging for short-read sequencing.

Keywords: DNA; nanofluidics; optical mapping; sequencing; single cell.


Conflict of interest statement

Conflict of interest statement: R.M., J.N.P., A.K., and K.U.M. filed patents. K.U.M. declares that XGenomes is developing nucleic acid sequencing technologies.

Figures

Fig. 1.
Fig. 1.
Architecture of single-cell processing device and workflow for single-cell D-R mapping and whole-genome sequencing. (A) An all-polymer lab-on-a-chip device with 12 connectors comprises a cell trap (blue), a meandering channel (green), and a flow-stretch device (red). (B) A single cell is captured by hydrodynamic trapping, DNA is extracted and patterned according to AT/GC composition by a heating–cooling cycle, and genomic DNA is stretched and visualized. (C) Workflow using device shown in SI Appendix, Fig. S1 for single-cell trapping and extracting and amplifying DNA before sequencing. (D) Principle of D-R pattern generation: The genomic DNA is homogeneously stained with YOYO-1. During partial denaturation at a temperature Tm between the melting temperatures of AT and GC bonds, TmAT<Tm<TmGC, the double helix opens up in AT-rich regions and dye leaves these regions. After renaturation, dark and light segments along the DNA constitute the D-R pattern used for mapping. The D-R map is compared with an in silico map of the reference genome (see SI Appendix). (E) Workflow using device in A and B to prepare genomic DNA for D-R mapping for SV detection.
Fig. 2.
Fig. 2.
Device operation to realize the workflow shown in Fig. 1D. (A) The device comprises a main channel with inlets for cells and buffer, a cell trap connecting the main channel to the outlets. On the outlet side, a flow stretch device is placed. (B) Cells are introduced, and a single cell is captured in the trap. The flow is stopped when a cell occupies the trap. (C) Lysis buffer is introduced to remove the cytoplasm. The lysis solution contains YOYO-1 to stain the DNA of the nucleus. (D) The stained nucleus is illuminated with blue light (480 nm) to induce photonicking. (E) Buffer with BME is introduced to prevent further photonicking. (F) Same buffer to which protease K is added is introduced to release the genomic DNA by proteolysis. (G) When the DNA reaches the meandering channel, temperature is raised to partially denaturate the DNA before the device is cooled again. (H) DNA molecules are introduced to the flow-stretch device by electrophoresis and (I) stretched by a flow of buffer at a pressure of 80 mbar. (J) Brightfield image of the flow-stretch device indicating the buffer flow (dotted line) and the position of the DNA (red line). The nanoslit is 450 μm across.
Fig. 3.
Fig. 3.
Extraction and mapping of DNA from a trapped cell. (A) Proteolysis liberates the genomic DNA from the trapped nucleus under flow (arrow). (Scale bar, 10 μm.) (B) DNA is collected as a 10-nL plug of solution in a section of the device where D-R is performed. (Scale bar, 10 μm.) (C) Single field-of-view of a segment of a stretched DNA molecule. (Scale bar, 10 μm.) (D) Full D-R map of a molecule is stitched together from five fields-of-view. (E) Match between the D-R map (pixel 900 to 1100) and a position on Chr7 of computer-simulated whole-genome melting map.
Fig. 4.
Fig. 4.
Optical D-R map and paired-end sequencing on Chr 19. (A) Plot of sliding window analysis of experimental versus in silico D-R maps, revealing a region where the experimental D-R map aligns poorly to the reference. (B) The coverage and the visual analysis of the reads in the Integrative Genomics Viewer (IGV) show three normal regions and two ROIs in this region, one is a homozygous deletion and one is a complex region. (C) The coverage of reads over the whole fragment.
Fig. 5.
Fig. 5.
Optical D-R map and paired-end sequencing on Chr 4. (A) Plot of sliding window analysis, revealing a 20-kb discontinuity in the experimental D-R map compared with reference: This is the ROI. (B) Coverage plot of the cell line bulk-sequencing data displayed with a 100-bp bin around the molecule, including the ROI. (C–E) IGV plot of read-pair data for three genomic regions in the bulk sample and a single cell comprising (C) an arbitrary 1-kb region 1 Mb before the ROI, (D) 1 kb at the start of the ROI, and (E) 1 kb at the end of the ROI. For each case, the coverage is shown in gray in the top row. A stack of reads is shown in the rows below (arrows indicating orientation); gray indicates that both reads of the pair are consistent with the reference, including orientation and insert size; blue indicates a decrease and red color an increase in insert size between read pairs on the same chromosome; the color palette indicates that one read of the pair is on another chromosome according to the color key provided; vertical colored lines within reads indicate the identity of a single-nucleotide polymorphism (with color code: A, green; C, blue; T, red; G, orange); the block dots or short line within reads indicate insertions. The red downward arrowheads point to a gap in reads that is present in all single-cell and bulk data in the vicinity of the start and end of the ROI.

References

    1. Navin NE. Delineating cancer evolution with single-cell sequencing. Sci Transl Med. 2015;7:296fs29. - PMC - PubMed
    1. Gawad C, Koh W, Quake SR. Single-cell genome sequencing: Current state of the science. Nat Rev Genet. 2016;17:175–188. - PubMed
    1. McConnell MJ, et al. Mosaic copy number variation in human neurons. Science. 2013;342:632–637. - PMC - PubMed
    1. Cheow LF, et al. Single-cell multimodal profiling reveals cellular epigenetic heterogeneity. Nat Methods. 2016;13:833–836. - PubMed
    1. Bedard PL, Hansen AR, Ratain MJ, Siu LL. Tumour heterogeneity in the clinic. Nature. 2013;501:355–364. - PMC - PubMed

Publication types

MeSH terms

LinkOut - more resources