. 2018 Oct 15;9(11):1053.
doi: 10.1038/s41419-018-1095-7.

Sensitivity of CD3/CD28-stimulated versus non-stimulated lymphocytes to ionizing radiation and genotoxic anticancer drugs: key role of ATM in the differential radiation response

Affiliations

Sensitivity of CD3/CD28-stimulated versus non-stimulated lymphocytes to ionizing radiation and genotoxic anticancer drugs: key role of ATM in the differential radiation response

Daniel Heylmann et al. Cell Death Dis. .

Abstract

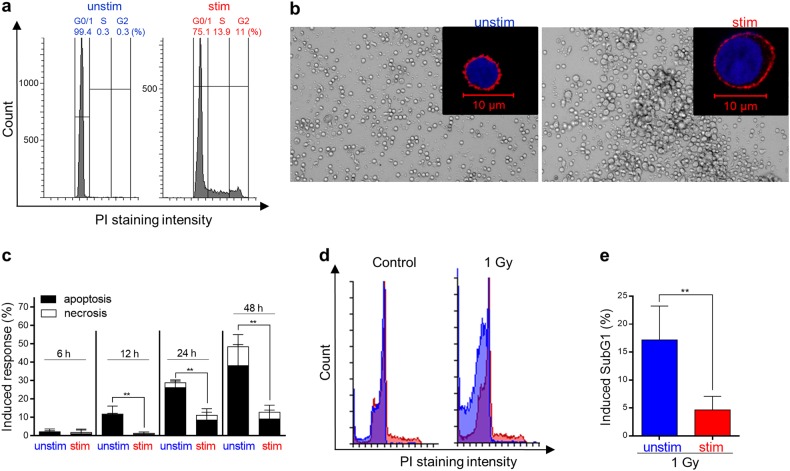
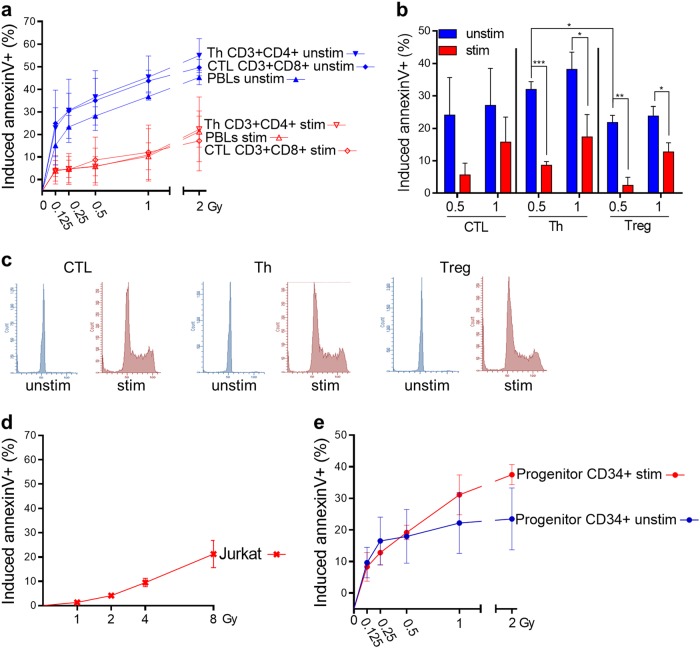
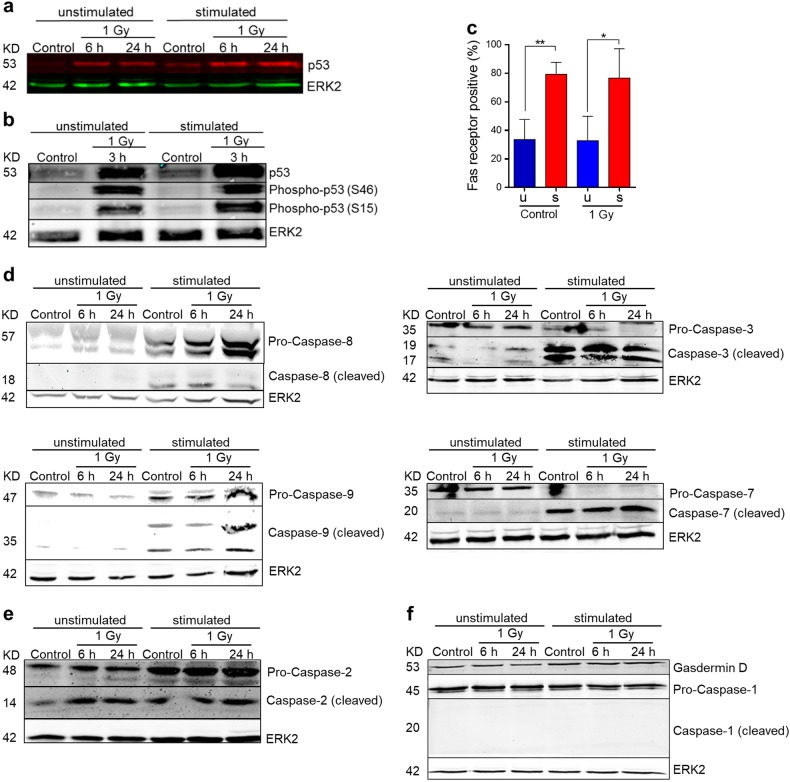
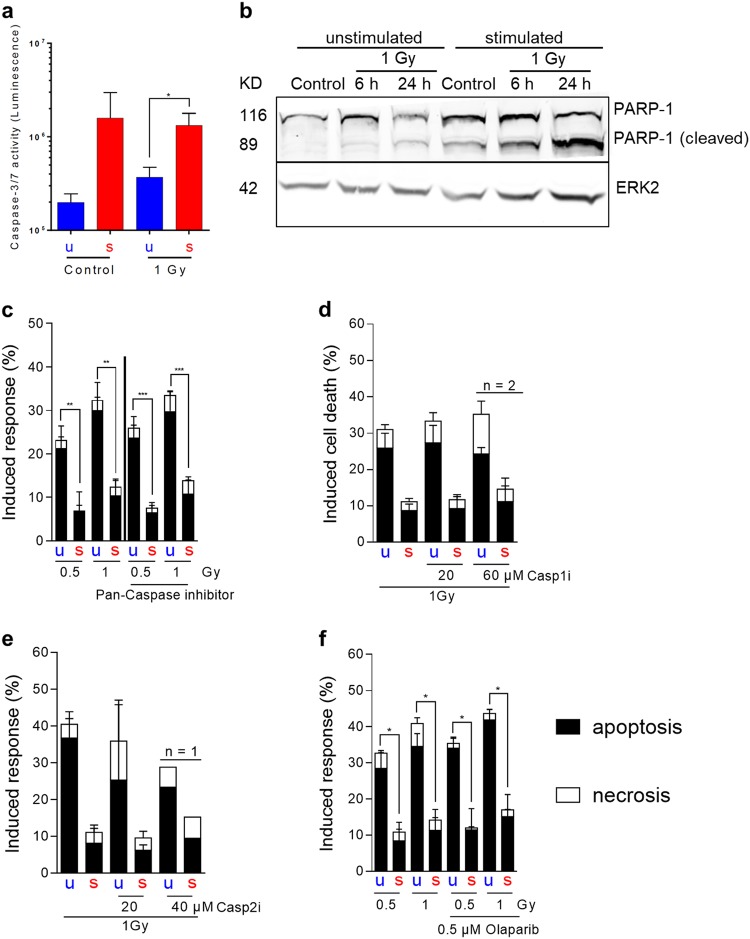
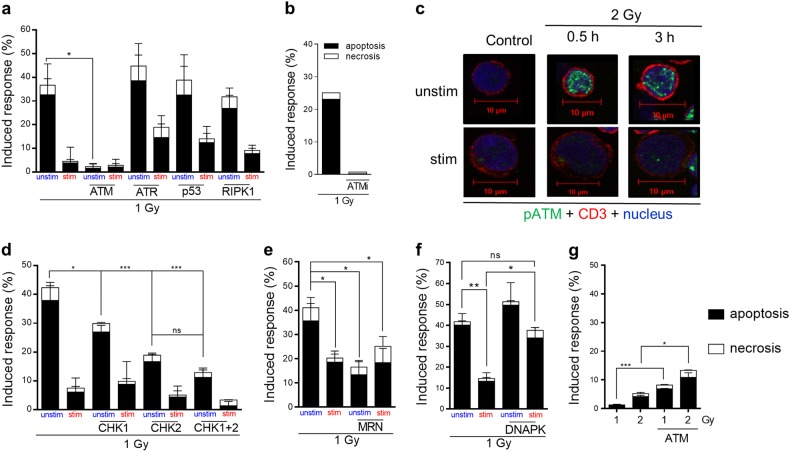
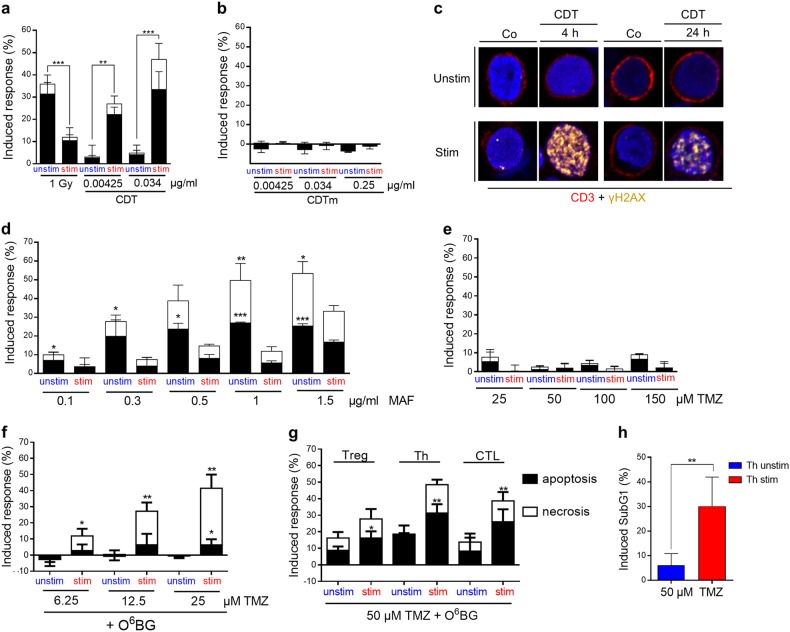
Activation of T cells, a major fraction of peripheral blood lymphocytes (PBLCS), is essential for the immune response. Genotoxic stress resulting from ionizing radiation (IR) and chemical agents, including anticancer drugs, has serious impact on T cells and, therefore, on the immune status. Here we compared the sensitivity of non-stimulated (non-proliferating) vs. CD3/CD28-stimulated (proliferating) PBLC to IR. PBLCs were highly sensitive to IR and, surprisingly, stimulation to proliferation resulted in resistance to IR. Radioprotection following CD3/CD28 activation was observed in different T-cell subsets, whereas stimulated CD34+ progenitor cells did not become resistant to IR. Following stimulation, PBLCs showed no significant differences in the repair of IR-induced DNA damage compared with unstimulated cells. Interestingly, ATM is expressed at high level in resting PBLCs and CD3/CD28 stimulation leads to transcriptional downregulation and reduced ATM phosphorylation following IR, indicating ATM to be key regulator of the high radiosensitivity of resting PBLCs. In line with this, pharmacological inhibition of ATM caused radioresistance of unstimulated, but not stimulated, PBLCs. Radioprotection was also achieved by inhibition of MRE11 and CHK1/CHK2, supporting the notion that downregulation of the MRN-ATM-CHK pathway following CD3/CD28 activation results in radioprotection of proliferating PBLCs. Interestingly, the crosslinking anticancer drug mafosfamide induced, like IR, more death in unstimulated than in stimulated PBLCs. In contrast, the bacterial toxin CDT, damaging DNA through inherent DNase activity, and the DNA methylating anticancer drug temozolomide induced more death in CD3/CD28-stimulated than in unstimulated PBLCs. Thus, the sensitivity of stimulated vs. non-stimulated lymphocytes to genotoxins strongly depends on the kind of DNA damage induced. This is the first study in which the killing response of non-proliferating vs. proliferating T cells was comparatively determined. The data provide insights on how immunotherapeutic strategies resting on T-cell activation can be impacted by differential cytotoxic effects resulting from radiation and chemotherapy.


Conflict of interest statement

The authors declare that they have no conflict of interest.

Figures

Fig. 1
Fig. 1. Radiation response of unstimulated vs. CD3-/CD28-stimulated PBLCs.
a Cell cycle distribution (PI staining, flow cytometry) showed unstimulated cells only in G0/1. Stimulation for 48 h induced proliferation of PBLC as shown by an increase of cells in S and G2 phase (and by increased CD25 expression as shown in Figure S3c). b Stimulated PBLCs showed an increase in cell size and changes in morphology as determined by light microscopy and staining of nuclei (blue), and CD3 T-cell receptor (red) by immunohistochemistry (LSM). An increase in cell size was also visible in forward and sideward scatter by flow cytometry as shown in Figure S3d. c Unstimulated PBLCs underwent significantly more cell death (mainly apoptosis) 12–48 h after 1 Gy compared with stimulated PBLs (annexinV/PI staining, n = 3–4, mean values, SD, t-test concerning apoptotic part **p < 0.01). Stimulation-induced radioprotection was also obvious 72 h after 0.5 and 1 Gy (Figure S3e). d, e Stimulation of PBLs also resulted 24 h after 1 Gy in less DNA fragmentation as revealed by SubG1 flow cytometry (n = 4, mean value, SD, t-test **p < 0.01)
Fig. 2
Fig. 2. Radiation response of unstimulated vs. stimulated T-cell subtypes and CD34-positive progenitor cells.
a CD3/CD28 stimulation protects PBLCs as well as CD3+CD4+ Th and CD3+CD8+ CTL within PBLCs after low (0.125 and 0.25 Gy) and high (0.5, 1, and 2 Gy) doses of IR. Cell death (annexinV+) was determined 24 h after irradiation (flow cytometry, n = 3, mean value, SD, t-test *p < 0.05 significant for PBLCs unstim vs. stim at 0.25, 0.5, 1, and 2 Gy; Th unstim vs. stim at 0,125, 0.25, 0.5, 1, and 2 Gy; CTL unstim vs. stim at 0.25, 1, and 2 Gy). Gatings are described in Figure S4a. b A radioprotective effect resulting from CD3/CD28 stimulation was also observed for magnetic bead-isolated CTL, Th, and Treg (annexinV staining 72 h after 0.5 and 1 Gy IR, n = 3, t-test, *p < 0.05, **p < 0.01). c Cell cycle distributions of CD3/CD28-stimulated and unstimulated magnetic bead-isolated CTL, Th and Treg Reihenfolge CTL, Th and Treg. d Induced death of Jurkat cells 48 h after different doses up to 8 Gy of IR. Jurkat cells display a very high radioresistance (n > 4). e Stimulation of CD34-positive progenitor cells with a specific cytokine expanding cocktail showed no protection towards IR (cell death measured by annexinV staining 24 h after IR with flow cytometry, n = 3, mean value, SD). Cell cycle distributions of 3 days cytokine-treated and -non-treated CD34-positive progenitor cells are shown in Figure S4b
Fig. 3
Fig. 3. Radiation-induced DNA damage and its repair in unstimulated compared with stimulated PBLCs.
a DNA double-strand break repair kinetics determined by neutral comet assay at different time points directly (0 min) and up to 240 min after 5 Gy (n = 3, 50 cells per sample, mean value, SD). b γH2AX-kinetic in non-irradiated (0 h) and 1 Gy-irradiated PBLCs 1–24 h post treatment. c DNA single-strand breaks 1 min after different doses of IR were analyzed by the alkaline comet assay (n = 3, 50 cells per sample, mean value, SD). d DNA single-strand break repair kinetics determined by alkaline comet assay at different time points directly (0 min) and up to 240 min after 5 Gy (n = 3, 50 cells per sample, mean value, SD). Representative pictures of neutral and alkaline comets are available in Figure S6a, b
Fig. 4
Fig. 4. Induction of p53 and cleavage of caspases in unstimulated and stimulated PBLCs after 1 Gy irradiation (western blottings).
a, b Expression and phosphorylation of p53 at Serin 46 and Serin 15. There were no differences in radiation-induced p53 between unstimulated and stimulated PBLC detectable. However, p53 expression was slightly induced upon CD3/CD28 stimulation (control, stim PBLC) (n = 3). c Quantification of Fas receptor in non-irradiated and irradiated PBLCs (n = 3, t-test *p < 0.05, **p < 0.01). Stimulated PBLC showed a significant higher level of Fas expression compared with unstimulated cells, independent from exposure to IR. d Expression and cleavage of initiator caspases-8 and -9, and executive caspases-3 and -7 in stimulated PBLCs, control, and following IR (controls) (n = 3). e Caspase-2 was cleaved in both unstimulated and stimulated PBLCs (n = 2). f In unstimulated and stimulated PBLCs, no cleavage of caspase-1 was visible. Gasdermin D, a substrat of caspase-1 processed in the cell death pathway named pyroptosis, was not cleaved after exposure to IR (n = 3). In all western blottings, ERK2 was used as loading control
Fig. 5
Fig. 5. Caspase activity and influence of caspase inhibition on radiation-induced cell death (24 h after IR) in unstimulated and stimulated PBLCs.
a Stimulated PBLCs showed massive caspase-3/7 activity compared with unstimulated cells, which was independent from treatment with IR. Caspase activity was measured 24 h (Figure S8a for 6 h values) after treatment with IR (n = 3, mean value, SD, t-test *p < 0.05). b PARP-1 cleavage is a specific process induced by activated caspases. Cleavage of PARP-1 could only be determined in stimulated PBLCs (another representative western blot is shown in Figure S8b). c Treating PBLCs prior IR with a general caspase inhibitor (20 μM pan-caspase inhibitor Z-VAD-FMK) showed no influence on radiation-induced cell death in unstimulated and stimulated PBLCs. The graphs showed the radiation response without and with inhibitor treatment (n = 4, mean value, SD, t-test **p < 0.01, ***p < 0.001). The efficiency of the pan-caspase inhibitor was confirmed by a caspase activity assay (Figure S8c). d, e Inhibition of caspase-2 or caspase-1 showed no effect on radiation-induced cell death (n = 2–4, mean value, SD). f PBLCs were treated before and after irradiation with olaparib, a specific PARP inhibitor. There was no effect on radiation-induced cell death (n = 3, mean value, SEM, t-test *p < 0.05)
Fig. 6
Fig. 6. Expression of DNA repair and DNA damage response genes in CD3/CD28-stimulated PBLCs in comparison with unstimulated PBLC.
a Following T-cell receptor activation, most genes involved in DNA repair and DNA damage response became upregulated. ATM belongs to the group of genes that were downregulated following CD3/CD28 stimulation. Relative expression levels were normalized to unstimulated PBLCs, whose expression level was set to 1. b Expression analysis of pooled data from freshly isolated lymphocytes of three independent donors. ATM displayed consistent downregulation, irrespective of donor
Fig. 7
Fig. 7. Inhibition of DNA damage response proteins as ATM, CHK1, CHK2, and MRE 11 (MRN complex) protects PBLCs from irradiation-induced cell death (measured 24 h after IR).
a Inhibition of ATM prior irradiation with 1 Gy significantly protects unstimulated PBLCs from radiation-induced cell death (see Fig. S10a with a lower ATM inhibitor concentration (3 µM) and DMSO control). An inhibition of ATR, p53, and RIPK1 (a marker of necroptosis) had no protective effect on radiation-induced cell death (Fig. S10c for a higher p53 inhibitor concentration) (n = 3, mean value, SD, t-test *p < 0.05). b The alternative ATM inhibitor KU-55933 (10 µM) markedly reduced cell death in unstimulated PBLCs. c Representative pictures of phospho-ATM (green) immunostaining revealed higher signals after irradiation in unstimulated compared with stimulated CD3 (red) T cells (blue nucleus) (Fig. S10d for quantification). d Inhibition of ATM downstream factors CHK1 and CHK2 protect unstimulated PBLCs from irradiation-induced cell death (n = 3–5, mean value, SD, two-way ANOVA (Tukey), *p < 0.05, ***p < 0.001). e Inhibition of the ATM upstream factor MRN resulted in radioprotection of unstimulated lymphocytes. f However, inhibition of the DNA damage sensor DNA-PK sensitized unstimulated and stimulated PBLCs (e, f, n = 3, mean value, SD, two-way ANOVA (Tukey), *p < 0.05, **p < 0.01). The descriptions of the inhibitors are listed in Materials and Methods. g Cell death induction 48 h after 1 and 2 Gy IR in ATM-inhibited Jurkat cells. Inhibition of ATM significantly sensitizes Jurkat cells to IR (n = 3–5, mean value, SD, t-test, *p < 0.05, ***p < 0.001)
Fig. 8
Fig. 8. Sensitivity of unstimulated vs. stimulated PBLCs to CDT, MAF, and TMZ.
a CDT treatment induced significantly more cell death in stimulated than unstimulated PBLCs after 24 h. b CDTm, which is mutated in the enzymatic active CDT B-unit, induced neither cell death induction in unstimulated nor stimulated PBLCs. (a, b, n = 3–5, mean value, SD, t-test **p < 0.01, ***p < 0.001). c Representative pictures of γH2AX (green) staining in unstimulated and stimulated CD3 (red) T cells within PBLC. CDT induced massive DNA damage in stimulated compared with unstimulated cells (quantification of γH2AX intensity is shown in Fig. S11a). d Mafosfamide treatment induced after 24 h significantly more cell death (apoptosis and clearly necrosis) in unstimulated than stimulated PBLCs (n = 3, mean value, SD, t-test, *p < 0.05, **p < 0.01, ***p < 0.001). e Without MGMT inhibition, TMZ did not induce significant cell death ( < 10 %) in PBLCs. Apoptosis and necrosis were measured after 72 h. f MGMT depletion by pre-treatment with O6BG increased significantly TMZ-induced cell death in stimulated cells, already at very low doses of 6.25 and 25 µM TMZ (n = 4, mean value, SD, t-test, *p < 0.05, **p < 0.01). g The sensitizing effect of CD3/CD28 stimulation towards TMZ was also obvious in magnetic bead-isolated and MGMT depleted Treg, Th, and CTL (cell death was measured 72 h after TMZ treatment, n = 5, mean value, SD, t-test, **p < 0.01, ***p < 0.001). h Apoptosis was measured in unstimulated and stimulated Th by SubG1 quantification

References

    1. Dempsey PW, Vaidya SA, Cheng G. The art of war: Innate and adaptive immune responses. Cell. Mol. Life Sci. 2003;60:2604–2621. doi: 10.1007/s00018-003-3180-y. - DOI - PMC - PubMed
    1. McLaughlin BE, et al. Nine-color flow cytometry for accurate measurement of T cell subsets and cytokine responses. Part I: Panel design by an empirical approach. Cytometry A. 2008;73:400–410. doi: 10.1002/cyto.a.20555. - DOI - PMC - PubMed
    1. Huse M. The T-cell-receptor signaling network. J. Cell Sci. 2009;122:1269–1273. doi: 10.1242/jcs.042762. - DOI - PubMed
    1. Gajewski TF, Schreiber H, Fu YX. Innate and adaptive immune cells in the tumor microenvironment. Nat. Immunol. 2013;14:1014–1022. doi: 10.1038/ni.2703. - DOI - PMC - PubMed
    1. Pages F, et al. Immune infiltration in human tumors: a prognostic factor that should not be ignored. Oncogene. 2010;29:1093–1102. doi: 10.1038/onc.2009.416. - DOI - PubMed

Publication types

MeSH terms

Substances