. 2018 Oct 15;9(1):4268.
doi: 10.1038/s41467-018-06739-4.

Tridimensional infiltration of DNA viruses into the host genome shows preferential contact with active chromatin

Affiliations

Tridimensional infiltration of DNA viruses into the host genome shows preferential contact with active chromatin

Pierrick Moreau et al. Nat Commun. .

Abstract

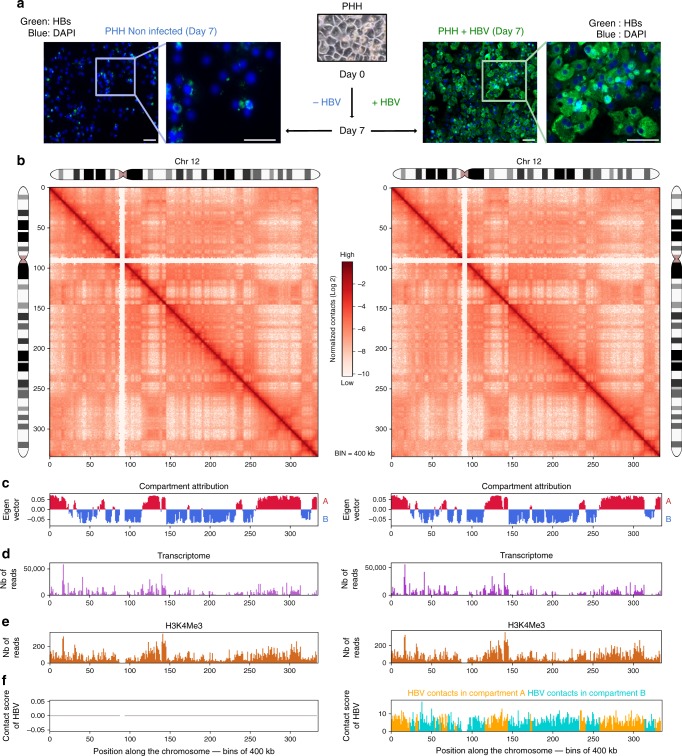
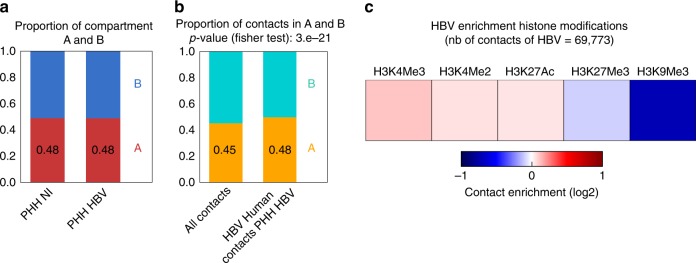
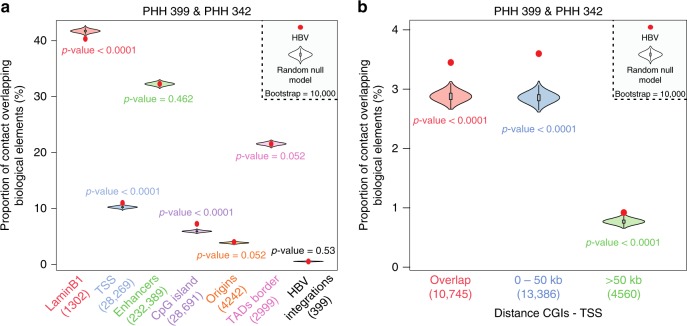
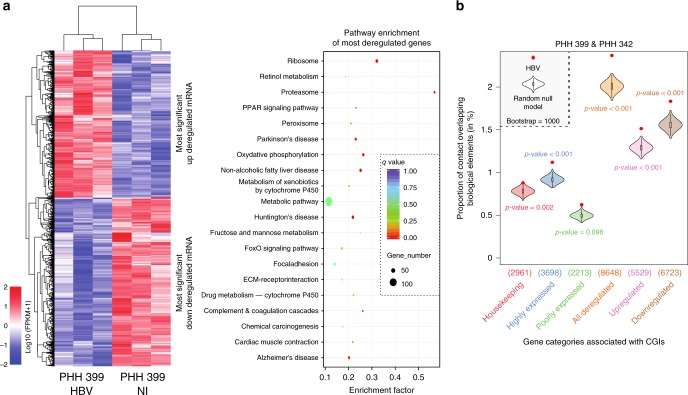
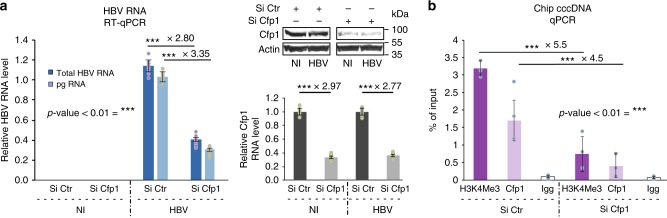
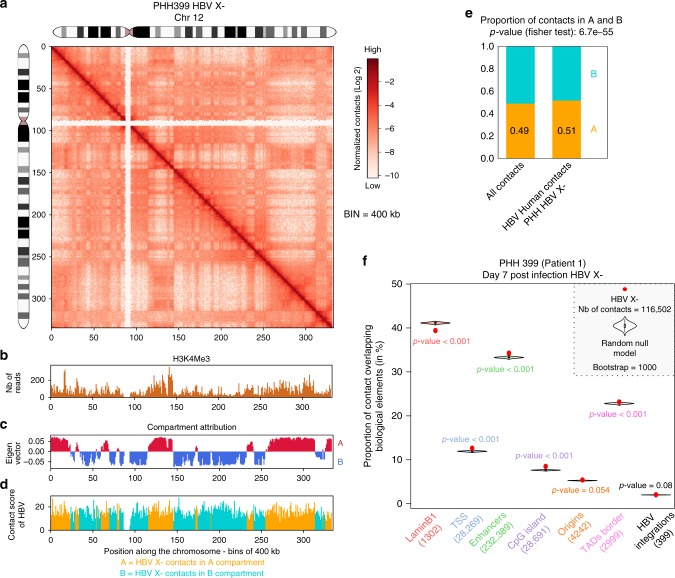
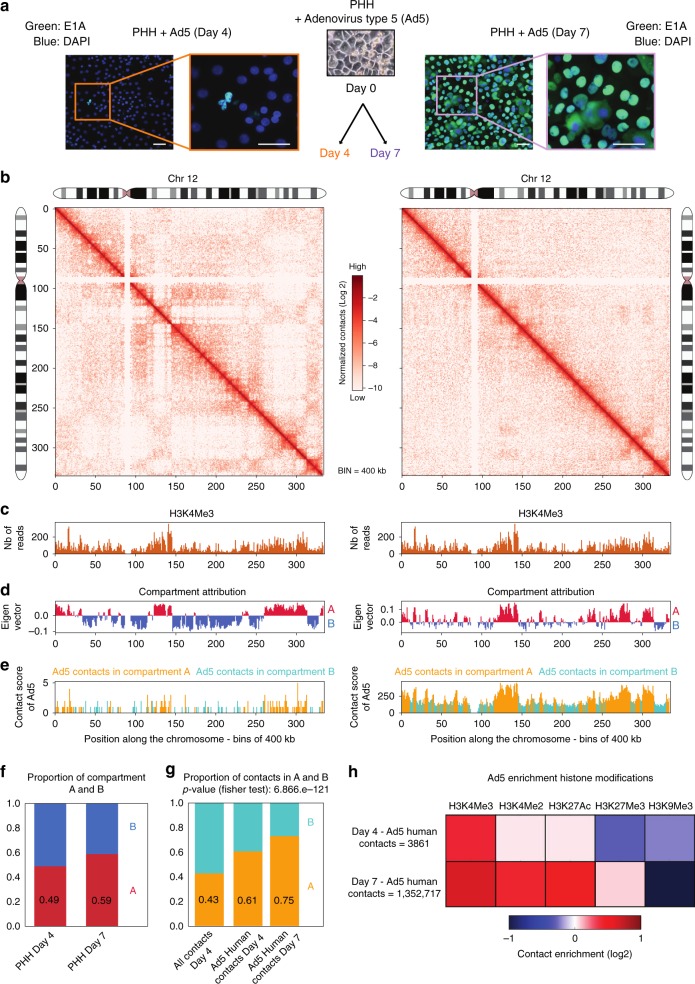
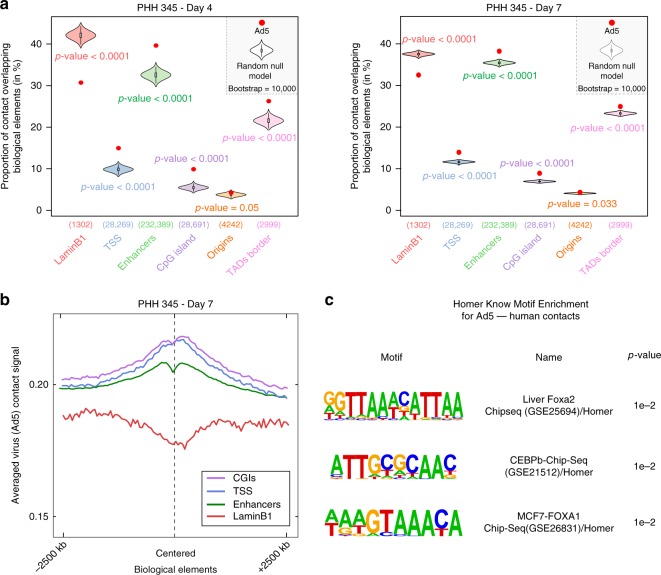
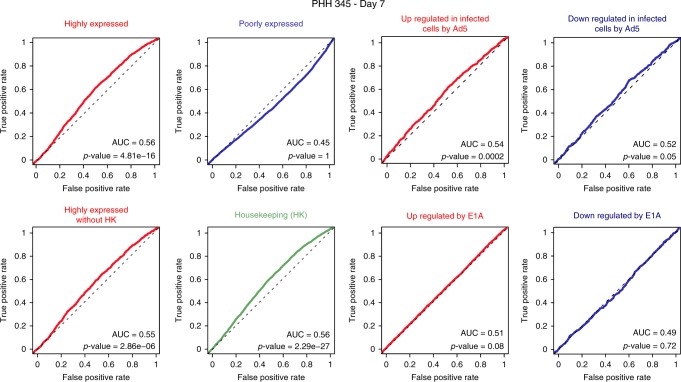
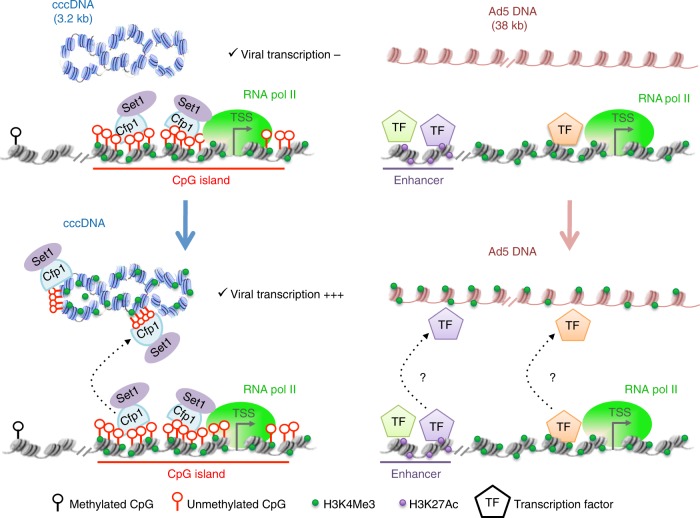
Whether non-integrated viral DNAs distribute randomly or target specific positions within the higher-order architecture of mammalian genomes remains largely unknown. Here we use Hi-C and viral DNA capture (CHi-C) in primary human hepatocytes infected by either hepatitis B virus (HBV) or adenovirus type 5 (Ad5) virus to show that they adopt different strategies in their respective positioning at active chromatin. HBV contacts preferentially CpG islands (CGIs) enriched in Cfp1 a factor required for its transcription. These CGIs are often associated with highly expressed genes (HEG) and genes deregulated during infection. Ad5 DNA interacts preferentially with transcription start sites (TSSs) and enhancers of HEG, as well as genes upregulated during infection. These results show that DNA viruses use different strategies to infiltrate genomic 3D networks and target specific regions. This targeting may facilitate the recruitment of transcription factors necessary for their own replication and contribute to the deregulation of cellular gene expression.


Conflict of interest statement

The authors declare no competing interests.

Figures

Fig. 1
Fig. 1
Distribution of HBV contacts along the host genome. a HBV envelope proteins (HBs, green) were visualized using immunofluorescence in PHH infected or not by HBV. Scale bar represents 50 μm. b Hi-C contact maps of chromosome 12 from non-infected PHH (left) or from PHH infected with HBV (right) at 400 kb resolution. The color scale represents the normalized contact frequencies between bins. c First principal component of chromosome 12 (400 kb resolution) representing the active A-type (red) and repressed B-type compartmentalization (blue). d Gene expression in non-infected and infected PHH 399 using RNAseq reads. e Active histone mark (H3K4me3) reads density along chromosome 12 (400 kb resolution) in HBV-infected PHH from Tropberger et al.. f Distribution of HBV contacts along chromosome 12 (400 kb resolution) in infected PHH (right). Contacts with active chromatin (A) are shown in orange and with repressed chromatin (B-type) in green
Fig. 2
Fig. 2
HBV genome contacts are enriched at active chromatin. a Distribution of active A and inactive B compartments in non-infected and infected PHH (400 kb resolution). b Distribution of Hi-C reads coverage in compartments A and B and distribution of HBV reads contacts on the genome in infected PHH (400 kb resolution) (statistical analysis was performed using Fisher's test). c Heatmap of HBV contacts enrichment for different histone modification marks (computed in windows ± 3.5 kb around the start of the read; N realizations = 100). Signals for the heatmap are represented by fold change (log2 ratio) compared to the average of random groups (see Methods). Histone modification marks dataset were from the Encode project generated using hepatic HepG2 cells (Encode Project:GSE29611)
Fig. 3
Fig. 3
HBV genome contacts preferentially CpG-rich regions. a Proportion of HBV contacts with a given biological element (as indicated along with the number of elements) compared with the corresponding null model that shows the distribution using the Hi-C coverage of the corresponding library and represented by violin plot. Density plot width = frequency, line = 95% confidence interval, box plot = interquartile range. Red dot represents the proportion of HBV contacts that overlap with the indicated biological element (computed in windows ± 3.5 kb around the start of the read). p-values were determined according to the percentages detected in the bootstrap strategy (see Methods). b Proportion of HBV contacts with CGIs grouped according to their relative distance to TSS (computed in windows ± 3.5 kb around the start of the read) compared with the corresponding null model that shows the distribution using the Hi-C coverage and represented using the violin plot. Density plot width = frequency, line = 95% confidence interval, box plot = interquartile range. Red dot represents the proportion of HBV contacts that overlap with the indicated biological element (computed in windows ± 3.5 kb around the start of the read). p-values were determined according to the percentages detected in the bootstrap strategy (see Methods)
Fig. 4
Fig. 4
HBV contacts are enriched at GCIs associated with highly expressed genes and deregulated genes. a Heatmap of downregulated and upregulated genes in HBV infected PHH 399 compared with mock-infected PHH 399 and KEGG enrichment analysis. b Proportion of HBV contacts that overlap with CGIs present in the promoter of genes pooled according to their functional annotation (as indicated along with the number of elements) compared with the corresponding null model that shows the distribution using the Hi-C coverage and represented by violin plot. Density plot width = frequency, line = 95% confidence interval, box plot = interquartile range. Red dots represent the proportion of HBV contacts with the indicated biological element (computed in windows ± 3.5 kb around the start of the read). p-values were determined according to the percentages detected in the bootstrap strategy (see Methods)
Fig. 5
Fig. 5
Cfp1 is required for HBV transcription. a HBV transcription was analyzed by RT-qPCR in HepG2 NTCP infected or not with HBV and transfected with the indicated siRNA (left graph). The expression of Cfp1 was analyzed by RT-qPCR and western blotting (lower right and upper right panel, respectively). Error bars of nine independent experiments (n = 9) represent standard error of the mean (SEM). ***p < 0.01 by Wilcoxon–Mann–Whitney test. b HepG2-NTCP cells were infected by HBV and Cfp1 expression was silenced or not as in a. Cfp1 and H3K4me3 recruitment was analyzed by ChIP-qPCR. Error bars (n = 3) represent SEM. ***p < 0.01 by Wilcoxon–Mann–Whitney test
Fig. 6
Fig. 6
HBV X- genome contacts preferentially active chromatin at CpG-rich regions. a Hi-C contact maps of chromosome 12 from PHH infected with HBV X- at 400 kb resolution. The color scale represents the normalized contact frequencies between bins. b Active histone mark (H3K4Me3) reads density along chromosome 12 in HBV-infected PHH from Tropberger et al. (400 kb resolution). c First principal component of chromosome 12 (400 kb resolution) representing the active A-type (red) and repressed B-type compartmentalization (blue). d Distribution of HBV contacts along chromosome 12 in infected PHH (right). Contacts with active chromatin (a) are shown in orange and with repressed chromatin (B-type) in green (400 kb resolution). e Distribution of Hi-C reads coverage in compartments A and B and distribution of HBV X- reads contacts on the genome in infected PHH (400 kb resolution). Statistical analysis was performed using Fisher test. f Proportion of HBV X contacts with a given biological element (as indicated along with the number of elements) compared with the corresponding null model that shows the distribution using the Hi-C coverage of the corresponding library and represented by violin plot. Density plot width = frequency, line = 95% confidence interval, box plot = interquartile range. Red dot represents the proportion of HBV X- contacts that overlap with the indicated biological element (computed in windows ± 3.5 kb around the start of the read). p-values were determined according to the percentages detected in the bootstrap strategy (see Methods)
Fig. 7
Fig. 7
Distribution of Ad5 contacts along the host genome. a E1A protein (green) was visualized using immunofluorescence in PHH 345 at day 4 and day 7 p.p. Scale bar represents 50 μm. b Hi-C contact maps of chromosome 12 from PHH infected by Ad5 at 4 and 7 days after plating at 400 kb resolution. The color scale represents the normalized interaction frequencies between bins. c H3K4me3 reads density along the chromosome 12 using dataset from the Encode project generated using hepatic HepG2 cells (400 kb resolution). d First principal component of chromosome 12 (400 kb resolution) representing the active A-type (red) and repressed B-type compartmentalization. e Distribution of Ad5 contacts along chromosome 12 (400 kb resolution) in PHH replication Ad5 4 days (left panel) and 7 days after plating (right panel). f Distribution of active A and inactive B compartments in PHH at 4 and 7 days after plating (400 kb resolution). g Ad5 contacts are enriched in active compartment. Distribution of Hi-C coverage (400 kb resolution) in compartments A and B in PHH at day 4 post plating and distribution of Ad5 contacts on all genomes in PHH 4 and 7 days after plating. p-value was determined using Fisher's test. h Heatmap of Ad5 contacts enrichment on different histone modification marks (computed in windows ± 3.5 kb around the start of the read; N realizations = 100). Signals for the heatmap are represented by fold change (log2 ratio) compared with the average of random groups of contacts. Histone modification marks data were from the Encode project generated using hepatic HepG2 cells (Encode Project:GSE29611)
Fig. 8
Fig. 8
Episomal Ad5 DNA is enriched at enhancers and TSS. a Proportion of Ad5 contacts with a given biological element (as indicated on the graph along with the number of elements) in PHH at day 4 (all contacts) or day 7 (the number of contacts has been sub-sampled to 30,000) after plating compared with the corresponding null model that shows the distribution using the Hi-C coverage and represented by violin plot. Density plot width = frequency, line = 95% confidence interval, box plot = interquartile range. Red dot represents the proportion of Ad5 contacts with the indicated biological element (computed in windows ± 3.5 kb around the start of the read). p-values were determined according to the percentages detected in the bootstrap strategy (see Methods). b Average density plot of Ad5 contacts in PHH harvested 7 days after platting centered on different biological elements (50 kb resolution) of the host genome as indicated in the figure. c Enrichment of transcription factor (TF) motive identified by HOMER for Ad5 human contacts at Day 7 in PHH345
Fig. 9
Fig. 9
Ad5 contacts are enriched at TSS associated with highly expressed genes and upregulated genes. To measure enrichment of TSS highly contacted by Ad5 with respect to a given class of genes (as indicated on the graphs), we used receiver operating curve (ROC). The p-values of ROC analysis were computed with the Wilcoxon–Mann–Whitney test
Fig. 10
Fig. 10
A proposed model showing that DNA viruses infiltrate the 3D network and contact active chromatin. Our model suggests that viruses target critical regions to favor their own replication/transcription

References

    1. Dekker J, Mirny L. The 3D genome as moderator of chromosomal communication. Cell. 2016;164:1110–1121. doi: 10.1016/j.cell.2016.02.007. - DOI - PMC - PubMed
    1. Dixon JR, Gorkin DU, Ren B. Chromatin domains: the unit of chromosome organization. Mol. Cell. 2016;62:668–680. doi: 10.1016/j.molcel.2016.05.018. - DOI - PMC - PubMed
    1. Dixon JR, et al. Topological domains in mammalian genomes identified by analysis of chromatin interactions. Nature. 2012;485:376–380. doi: 10.1038/nature11082. - DOI - PMC - PubMed
    1. Knipe DM, et al. Snapshots: chromatin control of viral infection. Virology. 2013;435:141–156. doi: 10.1016/j.virol.2012.09.023. - DOI - PMC - PubMed
    1. Beck J, Nassal M. Hepatitis B virus replication. World J. Gastroenterol. 2007;13:48–64. doi: 10.3748/wjg.v13.i1.48. - DOI - PMC - PubMed

Publication types