. 2018 Oct;562(7728):600-604.
doi: 10.1038/s41586-018-0622-0. Epub 2018 Oct 15.

A metabolite-derived protein modification integrates glycolysis with KEAP1-NRF2 signalling

Affiliations

A metabolite-derived protein modification integrates glycolysis with KEAP1-NRF2 signalling

Michael J Bollong et al. Nature. 2018 Oct.

Abstract

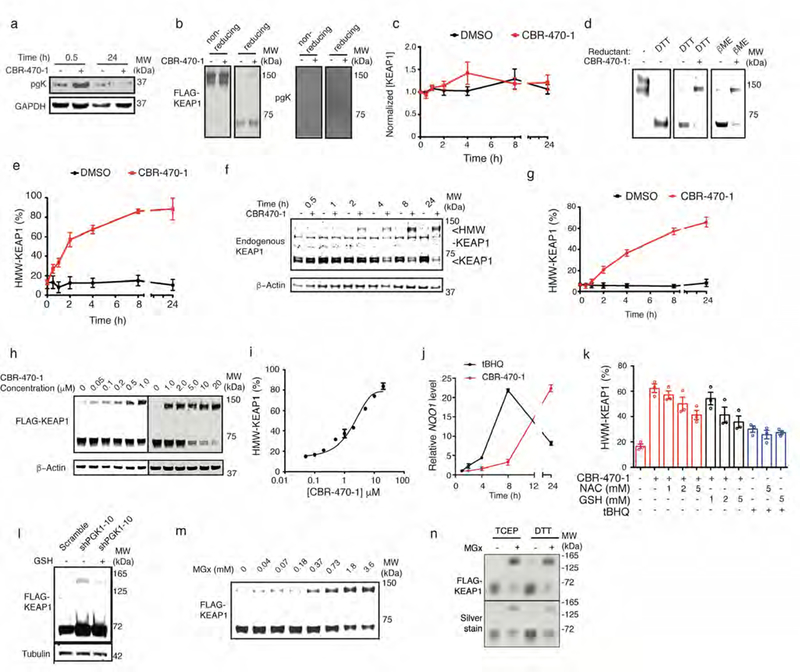
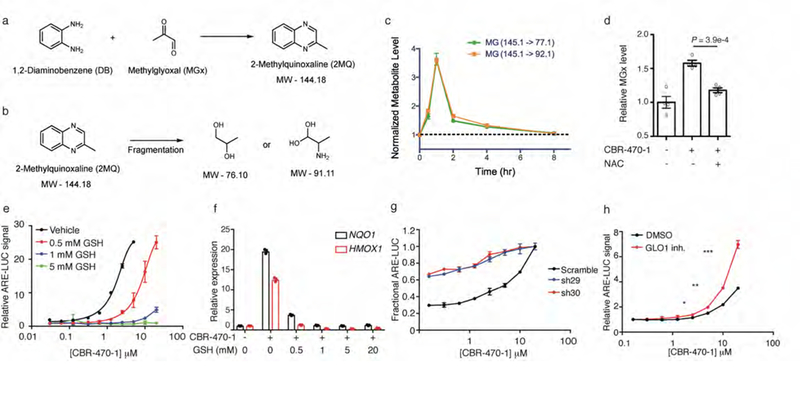
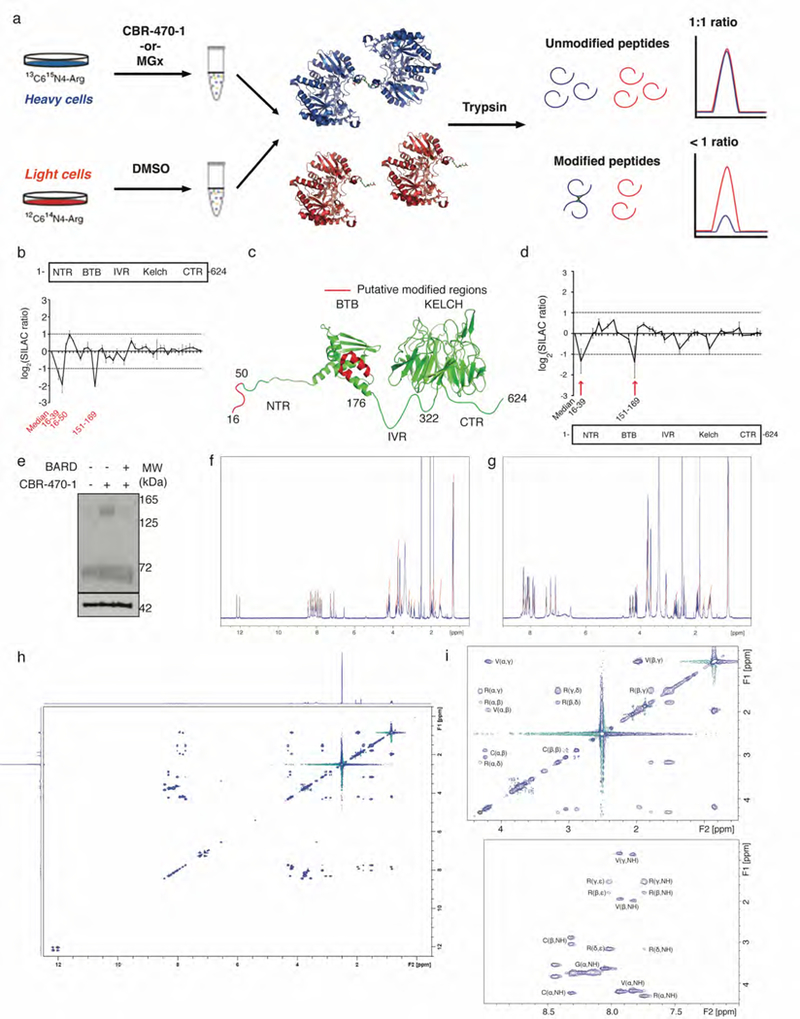
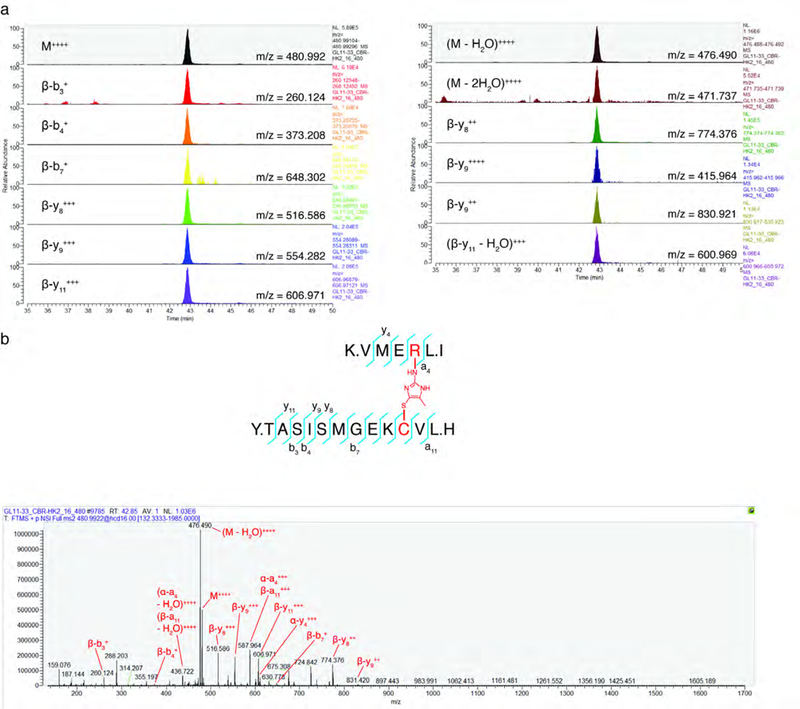
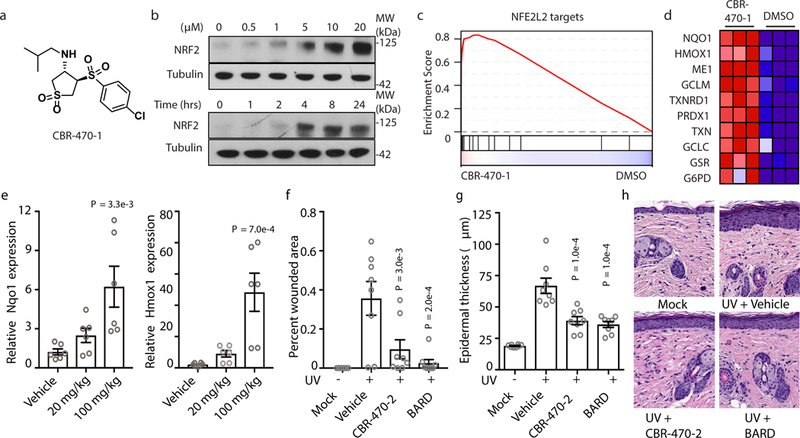
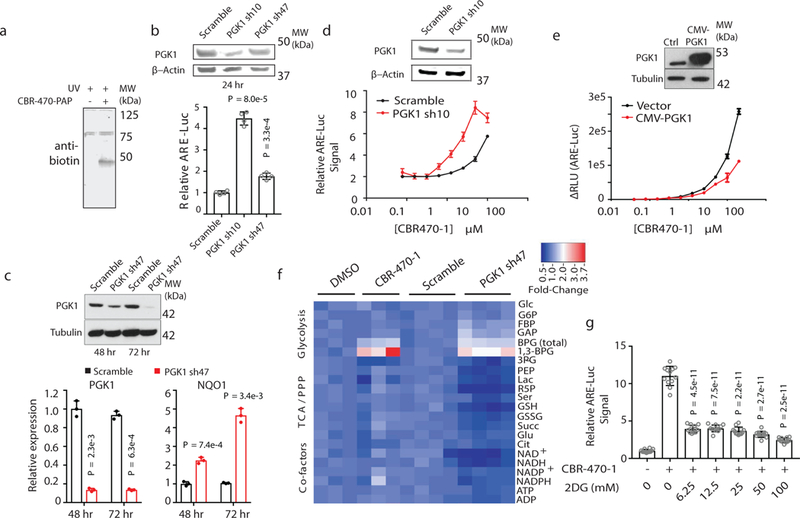
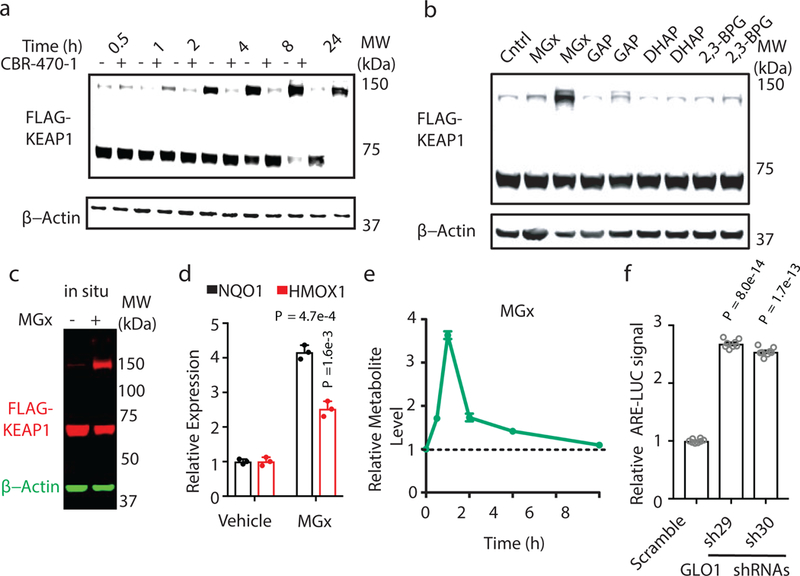
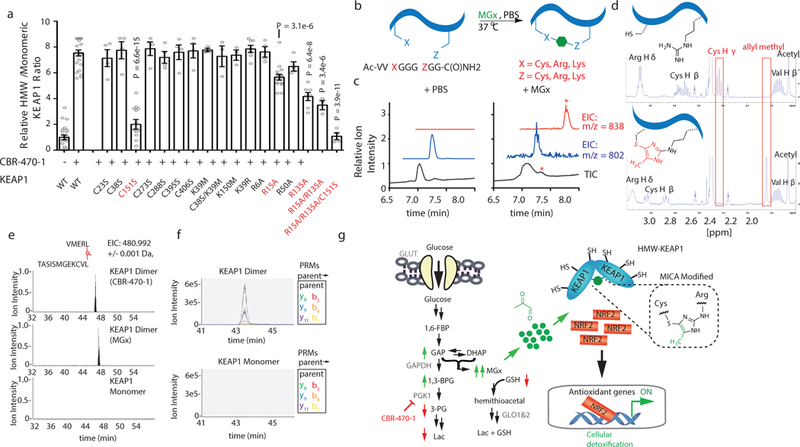
Mechanisms that integrate the metabolic state of a cell with regulatory pathways are necessary to maintain cellular homeostasis. Endogenous, intrinsically reactive metabolites can form functional, covalent modifications on proteins without the aid of enzymes1,2, and regulate cellular functions such as metabolism3-5 and transcription6. An important 'sensor' protein that captures specific metabolic information and transforms it into an appropriate response is KEAP1, which contains reactive cysteine residues that collectively act as an electrophile sensor tuned to respond to reactive species resulting from endogenous and xenobiotic molecules. Covalent modification of KEAP1 results in reduced ubiquitination and the accumulation of NRF27,8, which then initiates the transcription of cytoprotective genes at antioxidant-response element loci. Here we identify a small-molecule inhibitor of the glycolytic enzyme PGK1, and reveal a direct link between glycolysis and NRF2 signalling. Inhibition of PGK1 results in accumulation of the reactive metabolite methylglyoxal, which selectively modifies KEAP1 to form a methylimidazole crosslink between proximal cysteine and arginine residues (MICA). This posttranslational modification results in the dimerization of KEAP1, the accumulation of NRF2 and activation of the NRF2 transcriptional program. These results demonstrate the existence of direct inter-pathway communication between glycolysis and the KEAP1-NRF2 transcriptional axis, provide insight into the metabolic regulation of the cellular stress response, and suggest a therapeutic strategy for controlling the cytoprotective antioxidant response in several human diseases.


Figures

Extended Data Figure 1.
A high throughput screen identifies a non-covalent NRF2 activator chemical series which activate a robust NRF2 transcriptional program in multiple cell types. a, Plate-based Z-scores of ARE-LUC luminance measurements of all test compounds from a 30k compound screen in IMR32 cells. b, Structure of screening hit CBR-470-0. c, Relative ARE-LUC luminance measurements from IMR32 cells treated for 24 hours with a concentration response of CBR-470-0 and reported NRF2 activators TBHQ and AI-1 (n=3 biologically independent samples, mean and s.e.m.). d, LC-MS quantification of CBR-470-1 (50μM) incubated in the presence or absence of GSH (1mM) in PBS for 1 hour (left) and 48 hours (right). Relative ion intensities within each time point were compared with representative chromatograms shown (n=2). e, Relative ARE-LUC luminance values from IMR32 cells transfected with wild type (wt) or mutant (mt, two core nucleotides necessary for NRF2 binding were changed from GC to AT) ARE-LUC reporter constructs and treated with the indicated doses of CBR-470-1 for 24 hours (n=3, mean and s.e.m.). f, Relative abundance of NRF2-dependent transcripts as determined by qRT-PCR from IMR32 cells treated for 24 hours with 5 μM CBR-470-1 (n=3). g, Western blot analyses of total NRF2 protein content or NRF2-controlled genes (NQO1, HMOX1) from IMR32 cells treated for 24 hours with 5 μM CBR-470-1 (n=5). h, Western blot analyses of total NRF2 protein content from the indicated cell types treated for 4 hours with 5 μM CBR-470-1 (n=3). i, Relative expression levels of NQO1 and HMOX1 from the indicated cell types treated for 24 hours with 5 μM CBR-470-1 (n=3, mean and s.d.). j, Relative ARE-LUC luminescence values from HEK293T cells transfected with the indicated shRNA constructs and pTI-ARE-LUC and then treated with TBHQ (10 μM) or CBR-470-1 (5 μM) for 24 hours (n=3). k, Relative viability measurements of SH-SY5Y cells treated with either CBR-470-1 (5 μM) or TBHQ (10 μM) for 48 hours and then challenged with the indicated doses of tert-Butyl hydroperoxide (TBHP) for 8 hours (n=4). Data are mean and s.d. of biologically independent samples (P* < 0.05, P** < 0.005, P*** < 0.001, univariate two-sided t-test).
Extended Data Figure 2.
CBR-470-2 pharmacokinetics and in vivo activity. a, Structure of CBR-470-2. b, Relative ARE-LUC luminance values from IMR32 cells transfected with pTI-ARE-LUC and treated with the indicated doses of CBR-470-1 and CBR-470-2 for 24 hours (n=3 biologically independent samples). c, Plasma concentrations of CBR-470-2 from mice treated with a single 20 mg/kg dose of compound. (n=3 animals, mean and s.e.m.). d, e, Relative transcript levels of Nqo1 and Hmox1 from mouse epidermal keratinocytes (d) and mouse dermal fibroblasts (e) treated for 24 hours with the indicated doses of compound (n=3 biologically independent samples, mean and s.d.). f, Blinded erythema scores from mice treated with vehicle, CBR-470-2 or Bardoxolone after UV exposure (n=8 animals, P* < 0.05, P*** < 0.005, one-way ANOVA with Dunnett’s correction, mean and s.e.m.). g, Representative images of UV-exposed dorsal regions of animals at day 10 of the study.
Extended Data Figure 3.
A photoactivatable affinity probe-based approach identifies PGK1 as the relevant cellular target of CBR-470-1. a, Structure of CBR-470-PAP. b, Relative ARE-LUC luminance values from IMR32 cells transfected with pTI-ARE-LUC and then treated with the indicated doses of CBR-470-PAP for 24 hours (n=3). c, Silver staining and anti-biotin Western blots of ammonium sulfate fractionated lysates from UV-irradiated IMR32 cells treated with 5 μM for 1 hour with or without CBR-470-1 competition (250 μM)(n=3). Shown on the right are initial proteomic target results from gel-band digestion and LC-MS/MS analysis. d, Anti-biotin Western blots from in vitro crosslinking assays with recombinant PGK1 and EBP1 in the presence of the indicated doses of CBR-470-PAP (n=2). e, Anti-biotin Western blot analyses from an in vitro crosslinking assay with recombinant PGK1 in the presence of CBR-470-PAP (1 μM) and indicated concentration of soluble CBR-470-1 competitor (n=2). f, Anti-biotin Western blot analyses of cells treated with 5 μM CBR-470-PAP after transduction with anti-PGK1 and anti-EBP1 shRNA for 48 hours. Depletion of PGK1 protein selectively reduces CBR-470-PAP-dependent labeling (n=2). g, Dye-based thermal denaturation assay with recombinant PGK1 in the presence CBR-470-1 (20 μM) or vehicle alone (n=3). Calculated Tm values are listed. h, i, Dose-dependent thermal stability assay of recombinant PGK1 and GAPDH in the presence of increasing doses of CBR-470-1 near the Tm of both proteins (57°C) (h) (n=5) or room temperature (i) (n=3). Western blot of sample supernatants after centrifugation (13,000 rpm) detected total PGK1 and GAPDH protein, which were plotted in Prism (below). j, ARE-LUC reporter activity in HEK293T cells with transient shRNA knockdown of ENO1 (n=3). Data shown represent mean ± SEM of biologically independent samples.
Extended Data Figure 4.
CBR-470-1 inhibits PGK1 in vitro and in situ. a, Schematic of the GAPDH/PGK1 coupled assay. Pre-equilibration of the GAPDH reaction (top left) results in an NAD+/NADH equilibrium, which upon addition of PGK1 and ADP pulls the reaction to the right producing more NADH. Monitoring NADH absorbance after addition of PGK1 (bottom right) can be used to monitor PGK1 activity in the forward direction (right). Kinetic monitoring of NADH absorbance (340 nm) after established equilibrium with GAPDH shows little change (black curve), but is significantly increased upon addition of PGK1, pulling the equilibrium to the right (red curve). b, CBR-470-1 does not affect the GAPDH equilibrium alone, but significantly inhibits PGK1-dependent activity and accumulation of NADH (n=5). c, d, Relative level of central metabolites in IMR32 cells treated with viral knockdown of PGK1 for 72 hours (c) (n=4) and with CBR-470-1 relative DMSO alone for the indicative times (d) (n=3). Each metabolite is normalized to the control condition at each time point. Univariate two-sided t-test (Extended Data Fig 5b); data shown represent mean ± SEM of biologically independent samples.
Extended Data Figure 5.
Modulation of PGK1 induces HMW-KEAP1. a, Anti-pgK (phosphoglyceryl-lysine) and anti-GAPDH Western blots analysis of CBR-470-1 or DMSO-treated IMR32 cells at early (30 min) and late (24 hr) time points (n=6). b, Anti-FLAG (left) and anti-pgK (right) Western blot analysis of affinity purified FLAG-KEAP1 from HEK293T cells treated with DMSO or CBR-470-1 for 30 min. Duplicate samples were run under non-reducing (left) and reducing (DTT, right) conditions (n=6). c, Densitometry quantification of total endogenous KEAP1 levels (combined bands at ∼70 and 140 kDa) in IMR32 cells treated with DMSO or CBR-470-1 for the indicated times (n=6). d, Western blot detection of FLAG-KEAP1 in HEK293T cells comparing no-reducing reagent to DTT (left), and stability of CBR-470-1-dependent HMW-KEAP1 to the presence of DTT (12.5 mM final concentration, middle) and beta-mercaptoethanol (5% v/v final concentration, right) during sample preparation. treated with DMSO or CBR-470-1 for 8 hours (n=8). e, Time-dependent CBR-470-1 treatment of HEK293T cells expressing FLAG-KEAP1. Time-dependent assays were run with 20 μM CBR-470-1 with Western blot analysis at the indicated time-points (n=8). f, g, Western blot detection (f) and quantification (g) of endogenous KEAP1 and β-actin in IMR32 cells treated with DMSO or CBR-470-1 for the indicated times (n=6). Arrows indicate monomeric (∼70 kDa) and HMW-KEAP1 (∼140 kDa) bands. h, i, Western blot (h) detection and quantification (i) of FLAG-KEAP1 in HEK293T cells exposed to increasing doses of CBR-470-1 (n=3). j, Kinetic qRT-PCR measurement of NQO1 mRNA levels from IMR32 cells treated with tBHQ (10 μM) or CBR-470-1 (10 μM) for the indicated times (n=3). k, Quantification of HMW-KEAP1 formation upon treatment with CBR-470-1 or the direct KEAP1 alkylator TBHQ, in the presence or absence of reduced glutathione (GSH) or N-acetylcysteine (NAC) (n=3). All measurements taken after 8 hour of treatment in FLAG-KEAP1 expressing HEK293T cells. l, Transient shRNA knockdown of PGK1 induced HMW-KEAP1 formation, which was blocked by co-treatment of cells by GSH (n=3). m, Anti-FLAG Western blot analysis of FLAG-KEAP1 monomer and HMW-KEAP1 fraction with dose-dependent incubation of distilled MGx in lysate from HEK-293T cells expressing FLAG-KEAP1 (n=4). n, SDS-PAGE gel (silver stain) and anti-FLAG Western blot analysis of purified KEAP1 treated with the MGx under the indicated reducing conditions for 2 hr at 37°C (n=3). Purified protein reactions were quenched in 4x SDS loading buffer containing βME and processed for gel analysis as in (d). Data shown represent mean ± SEM of biologically independent samples.
Extended Data Figure 6.
MGx and glyoxylase activity regulates NRF2 activation. CBR-470-1 causes elevated MGx levels in cells. a, Schematic depicting chemical derivatization and trapping of cellular MGx for analysis by targeted metabolomics using two unique fragment ions. b, c, Daughter ion fragments (b) and resulting MS/MS quantification of MGx levels (c) in IMR32 cells treated with CBR-470-1, relative to DMSO (n=4). d, Quantitative LC-MS/MS measurement of cellular MGx levels in IMR32 cells treated for 2 hours with CBR-470-1 or co-treated for 2 hours with CBR-470-1 and NAC (2 mM) relative to DMSO (n=4). e, Relative ARE-LUC luminance values from IMR32 cells transfected with pTI-ARE-LUC and co-treated with the indicated doses of CBR-470-1 and GSH (n=3). f, Relative levels of transcripts NQO1 and HMOX1 from IMR32 cells co-treated with CBR-470-1 (10 μM) and the indicated concentrations of GSH for 24 hours (n=3). g, Fractional ARE-LUC values from HEK293T cells transiently co-transfected with pTI-ARE-LUC and the indicated shRNAs and then treated for 24 hours with the indicated doses of CBR-470-1 (n=3). h, ARE-LUC reporter activity in HEK293T cells treated with CBR-470-1 alone (black) and with a cell-permeable small molecule GLO1 inhibitor (red) (n=3). Univariate two-sided t-test (Extended Data Fig 7d, h); data are mean ± SEM of biologically independent samples.
Extended Data Figure 7.
Schematic of SILAC-based proteomic mapping of KEAP1 modifications in response to CBR-470-1 and NMR characterization of CR-MGx peptide. a, Stable isotope-labeled cells (stable isotope labeling with amino acids in cell culture, SILAC) expressing FLAG-tagged KEAP1 were treated with vehicle (‘light’) and CBR-470-1 or MGx (‘heavy’), respectively. Subsequent mixing of the cell lysates, anti-FLAG enrichment, tryptic digestion and LC-MS/MS analysis permitted detection of unmodified portions of KEAP1, which retained ∼1:1 SILAC ratios relative to the median ratios for all detected KEAP1 peptides. In contrast, peptides that are modified under one condition will no longer match tryptic MS/MS searches, resulting skewed SILAC ratios that “drop out” (bottom). b, SILAC ratios for individual tryptic peptides from FLAG-KEAP1 enriched DMSO treated ‘light’ cells and CBR-470-1 treated ‘heavy’ cells, relative to the median ratio of all KEAP1 peptides. Highlighted tryptic peptides were significantly reduced by 3- to 4-fold upon relative to the KEAP1 median, indicative of structural modification (n=8). c, Structural depiction of potentially modified stretches of human KEAP1 (red) using published x-ray crystal structure of the BTB (PDB: 4CXI) and KELCH (PDB: 1U6D) domains. Intervening protein stretches are depicted as unstructured loops in green. d, SILAC ratios for individual tryptic peptides from FLAG-KEAP1 enriched MGx treated ‘heavy’ cell lysates and no treated ‘light’ cell lysates, relative to the median ratio of all KEAP1 peptides. Highlighted tryptic peptides were significantly reduced by 2- to 2.5- fold upon relative to the KEAP1 median, indicative of structural modification (n=12). e, Representative Western blotting analysis of FLAG-KEAP1 dimerization from HEK293T cells pre-treated with Bardoxolone methyl followed by CBR-470-1 treatment for 4 hours (n=3). f, 1H-NMR of CR-MGx peptide (isolated product of MGx incubated with Ac-NH-VVCGGGRGG-C(O)NH2 peptide). 1H NMR (500MHz, d6-DMSO) δ 12.17 (s, 1H), 12.02 (s, 1H), 8.44 (t, J = 5.6 Hz, 1H), 8.32-8.29 (m, 2H), 8.23 (t, J = 5.6 Hz, 1H), 8.14 (t, J = 5.9 Hz, 1H), 8.05 (t, J = 5.9 Hz, 1H), 8.01 (t, J = 5.9 Hz, 1H), 7.93 (d, J = 8.5 Hz, 1H), 7.74 (d, J = 8.0 Hz, 1H), 7.26 (s, 1H), 7.09 (s, 1H), 4.33-4.28 (m, 1H), 4.25-4.16 (m, 3H), 3.83 (dd, J = 6.9 Hz, J = 16.2 Hz, 1H), 3.79-3.67 (m, 6H), 3.63 (d, J = 5.7 Hz, 2H), 3.54 (dd, J = 4.9 Hz, J = 16.2 Hz, 1H), 3.18-3.13 (m, 2H), 3.04 (dd, J = 4.9 Hz, J = 13.9 Hz, 1H), 2.88 (dd, J = 8.6 Hz, J = 13.6 Hz, 1H), 2.04 (s, 3H), 1.96 (sep, J = 6.8 Hz, 2H), 1.87 (s, 3H), 1.80-1.75 (m, 1H), 1.56-1.47 (m, 3H), .87-.82 (m, 12H). g, 1H-NMR of CR peptide (Ac-NH-VVCGGGRGG-C(O)NH2). 1H NMR (500MHz, d6-DMSO) δ 8.27-8.24 (m, 2H), 8.18 (t, J = 5.7 Hz, 1H), 8.13-8.08 (m, 3H), 8.04 (t, J = 5.7 Hz, 1H), 7.91 (d, J = 8.8 Hz), 7.86 (d, J = 8.8 Hz, 1H), 7.43 (t, J = 5.4 Hz, 1H), 7.28 (s, 1H), 7.10 (s, 1H), 4.39 (dt, J = 5.6 Hz, J = 7.4 Hz, 1H), 4.28 (dt, J = 5.7 Hz, J = 7.2 Hz, 1H), 4.21-4.13 (m, 2H), 3.82-3.70 (m, 8H), 3.64 (d, J = 5.8, 2H), 3.08 (dt, J = 6.5 Hz, J = 6.5 Hz, 2H), 2.80-2.67 (m, 2H), 2.43 (t, J = 8.6 Hz, 1H), 1.94 (sep, J = 6.8 Hz, 2H), 1.85 (s, 3H), 1.75-1.68 (m, 1H), 1.54-1.42 (m, 3H), .85-.81 (m, 12H) h, 1H-1H TOCSY of CR-MGx peptide. i, Peak assignment for CR-MGx peptide TOCSY spectrum. Data are mean ± SEM of biologically independent samples.
Extended Data Figure 8.
MS2 analysis of CR-MGx crosslinked KEAP1 peptide. a, Targeted Parallel reaction monitoring (PRM) transitions (n=6). b, Annotated MS2 spectrum from the crosslinked C151-R135 KEAP1 peptide.
Fig. 1|
Fig. 1|. CBR-470-series compounds activate NRF2 signaling in vitro and in vivo.
a, Structure of CBR-470-1. b, NRF2 protein levels from IMR32 cells treated with the indicated concentrations of CBR-470-1 for 4 hours (top) or 5 μM CBR-470-1 for the indicated time periods (bottom). Blots are representative of 3 independent experiments. c, GSEA enrichment plot depicting the enrichment of a NRF2 target gene set (“Singh_NFE2L2_Targets” in MSigDB) from IMR32 cells treated for 24 hours with 5 μM CBR-470-1 (n=3, P < 0.0001, nom. p-value in GSEA). d, Heat map representation of the leading-edge subset of the most upregulated NRF2-regulated transcripts upon CBR-470-1 treatment. Data are biologically independent samples. e, Relative Nqo1 and Hmox1 transcript levels 24 hr after indicated P.O. doses of CBR-470-2 (n=6, biologically independent samples). f, Quantification of wounded area by automated image analysis from animals of the indicated treatment groups at study end (day 10). g, Quantification of epidermal thickness from H&E stained sections from the indicated groups at study end. h, Representative images of H&E stained skin sections from animals sacrificed at day 10 of the study. CBR-470-2, 50 mg/kg BID PO; BARD, bardoxolone methyl, 3mg/kg BID PO; UV, 200 mJ/cm2; data are mean and s.e.m., n=8 animals. Statistical analyses are one-way ANOVA with Dunnett’s correction (e-g). Data are mean and s.e.m.
Fig. 2.|
Fig. 2.|. CBR-470-1-dependent inhibition of glycolysis activates NRF2 signaling.
a, Anti-biotin Western blot analysis of IMR32 cells treated with CBR-470-PAP (10 μM) for one hour and exposed to UV light to induce photocrosslinking (representative shown from n = 4 biological replicates). b, Transient transfection of shRNA constructs targeting PGK1 in HEK293T cells activates the ARE-LUC reporter. PGK1 and β-actin protein levels shown from representative experiments (n=4 biological replicates). c, Viral shRNA knockdown of PGK1 induces NQO1 mRNA levels in IMR32 cells. PGK1 and Tubulin protein levels are shown from representative experiments (n=3). d,e, CBR-470-1 activation of ARE-LUC reporter in HEK293T cells with transient knockdown (d) or overexpression (e) of PGK1 demonstrates opposing effects on compound potency. PGK1, Actin and Tubulin protein levels are shown from representative experiments (n=3). f, Heat map depiction of relative metabolite levels in IMR32 cells treated for 30 min with CBR-470-1 (left) or viral shRNA knockdown of PGK1 (right) relative to DMSO and scramble shRNA controls, respectively. BPG refers to both 2,3-BPG and 1,3-BPG, whereas 1,3-BPG specifically refers to the 1,3-isomer. g, ARE-LUC reporter activity in IMR32 cells co-treated with CBR-470-1 (5 μM) and 2DG for 24 hr. (n=12). Statistical analyses are univariate two-sided t-tests (b, c, g). Data are mean and s.d. of biologically independent samples.
Fig. 3.|
Fig. 3.|. Methylglyoxal modifies KEAP1 to form a covalent, high molecular weight dimer and activate NRF2 signaling.
a, Time-course, anti-FLAG Western blot analysis of whole cell lysates from HEK293T cells expressing FLAG-KEAP1 treated with DMSO or CBR-470-1. b, Western blot monitoring of FLAG-KEAP1 migration in HEK293T lysates after incubation with central glycolytic metabolites in vitro (1 and 5 mM, left and right for each metabolite). c, FLAG-KEAP1 (red) and β-actin (green) from HEK293T cells treated with MGx (5 mM) for 8 hr. d, Relative NQO1 and HMOX1 mRNA levels in IMR32 cells treated with MGx (1 mM) or water control (n=3). e, LC-MS/MS quantitation of cellular MGx levels in IMR32 cells treated with CBR-470-1 relative to DMSO (n=4). f, ARE-LUC reporter activity in HEK293T cells with transient shRNA knockdown of GLO1 (n=8). Univariate two-sided t-test (d, f); data are mean ± SEM of biologically independent samples.
Fig. 4.|
Fig. 4.|. Methylglyoxal forms a novel posttranslational modification between proximal cysteine and arginine residues in KEAP1.
a, Quantified HMW-KEAP1 formation of wild-type or mutant FLAG-KEAP1 from HEK293T cells treated with DMSO or CBR-470-1 for 8 hr (n=23 for WT; n=16 for R15A; n=13 for C151S; n=7 for K39R, R135A; n=4 for R6A, R50A, all other C-to-S mutations, and R15/135A & C151S triple-mutant; n=3 for R15/135A, and all K-to-M mutations). b, Schematic of the model peptide screen for intramolecular modifications formed by MGx and nucleophilic residues. c, Total ion- (TIC) and extracted ion chromatograms (EIC) from MGx- and mock-treated peptide, with a new peak in the former condition marked with an asterisk. EICs are specific to the indicated m/z. (n=3 independent biological replicates). d, 1H-NMR spectra of the unmodified (top) and MICA-modified (bottom) model peptide, with pertinent protons highlighted in each. Notable changes in the MICA-modified spectrum include the appearance of a singlet at 2.04 p.p.m. (allyl methyl in MICA), loss of the thiol proton at 2.43 p.p.m., and changes in chemical shift and splitting pattern of the cysteine beta protons and the arginine delta and epsilon protons. Full spectra and additional multidimensional NMR spectra can be found in Extended Data Fig. 7. e, EIC from LC-MS/MS analyses of gel-isolated and digested HMW-KEAP1 (CBR-470-1 and MGx-induced) and monomeric KEAP1 for the C151-R135 crosslinked peptide. Slight retention time variation was observed on commercial columns (n=3 independent biological replicates). f, PRM chromatograms for the parent and six parent-to-daughter transitions in representative targeted proteomic runs from HMW-KEAP1 and monomeric digests (n=6). g, Schematic depicting the direct communication between glucose metabolism and KEAP1-NRF2 signaling mediated by MGx modification of KEAP1 and subsequent activation of the NRF2 transcriptional program. Univariate two-sided t-test (a); data are mean ± SEM of biologically independent samples.

Comment in

  • Playing KEAP1-away.
    Miura G. Miura G. Nat Chem Biol. 2019 Jan;15(1):2. doi: 10.1038/s41589-018-0197-y. Nat Chem Biol. 2019. PMID: 30531902 No abstract available.

References

    1. Lin H, Su X & He B Protein lysine acylation and cysteine succination by intermediates of energy metabolism. ACS Chem Biol 7, 947–960 (2012). - PMC - PubMed
    1. Wagner GR, et al. A Class of Reactive Acyl-CoA Species Reveals the Non-enzymatic Origins of Protein Acylation. Cell Metab 25, 823–837 e828 (2017). - PMC - PubMed
    1. Zhang Z, et al. Identification of lysine succinylation as a new post-translational modification. Nature chemical biology 7, 58–63 (2011). - PMC - PubMed
    1. Moellering RE & Cravatt BF Functional lysine modification by an intrinsically reactive primary glycolytic metabolite. Science 341, 549–553 (2013). - PMC - PubMed
    1. Weinert BT, et al. Acetyl-phosphate is a critical determinant of lysine acetylation in E. coli. Molecular cell 51, 265–272 (2013). - PubMed

Publication types

MeSH terms