. 2018 Oct;562(7728):538-544.
doi: 10.1038/s41586-018-0621-1. Epub 2018 Oct 15.

Transcription factor dimerization activates the p300 acetyltransferase

Affiliations

Transcription factor dimerization activates the p300 acetyltransferase

Esther Ortega et al. Nature. 2018 Oct.

Abstract

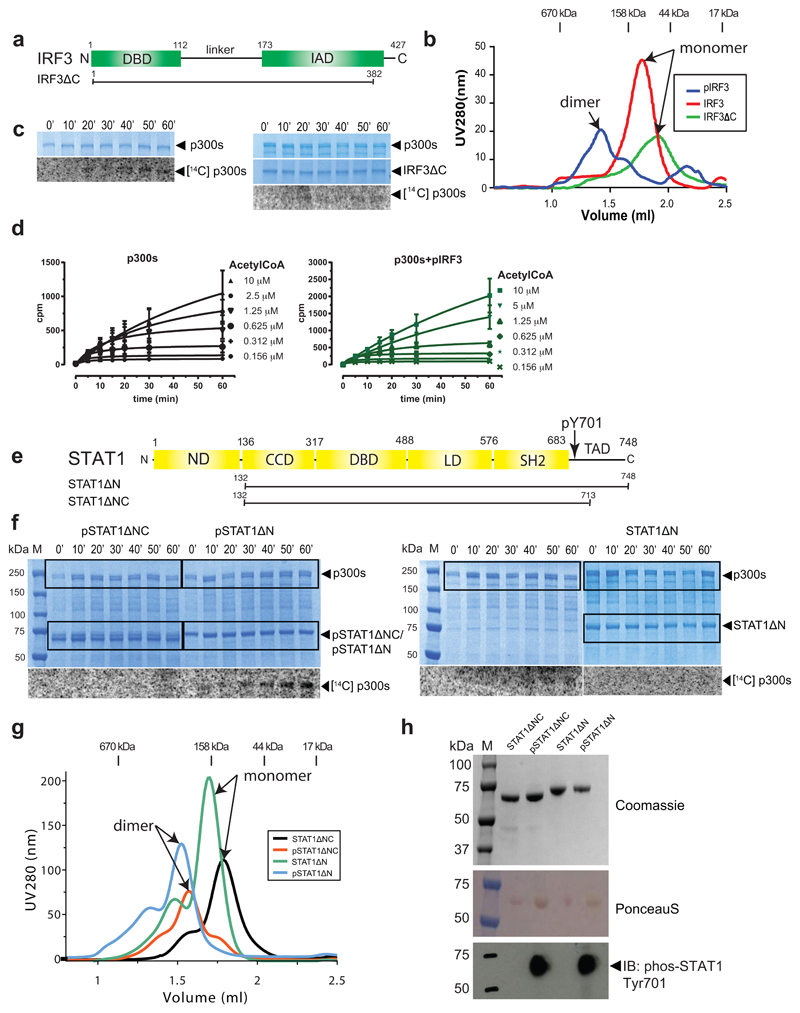
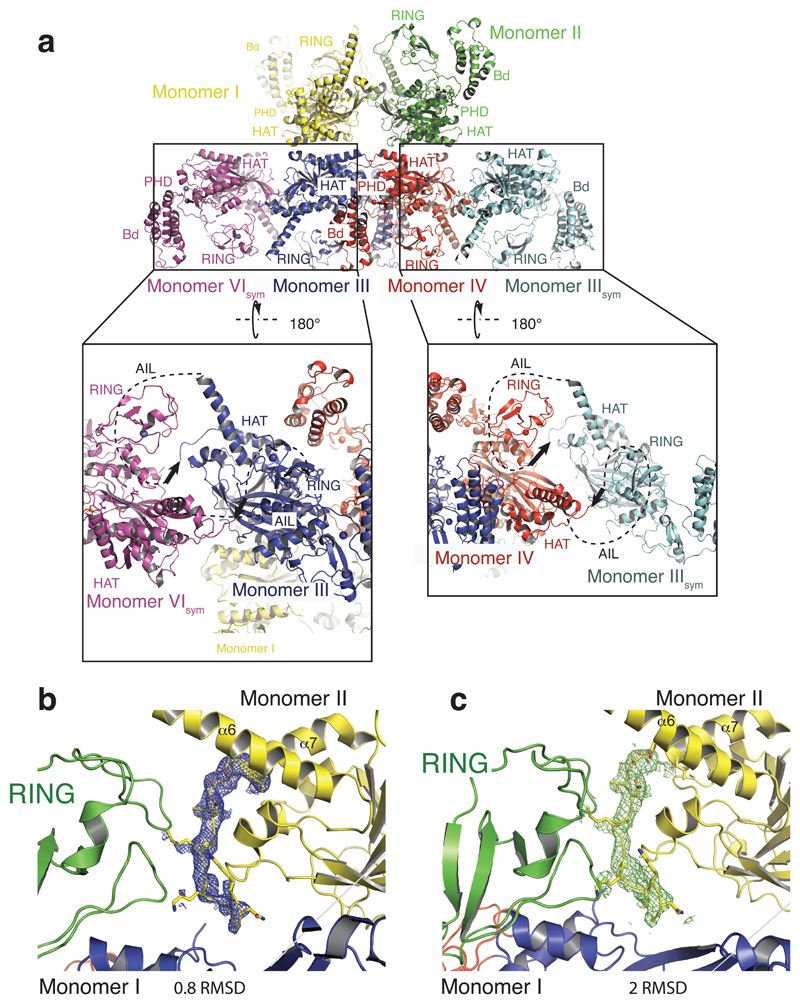
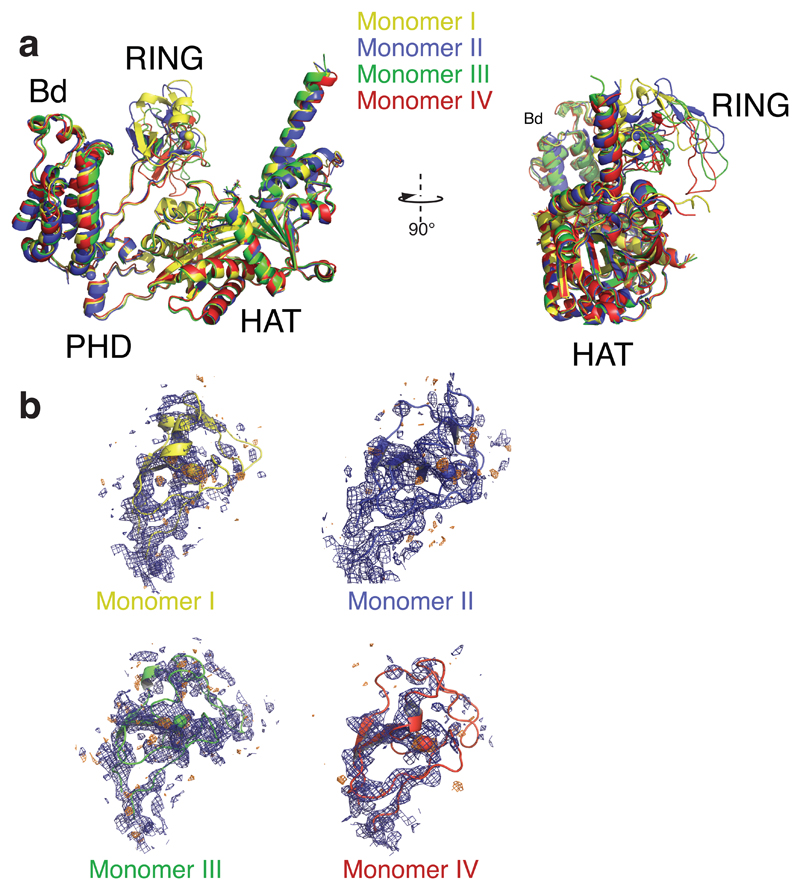
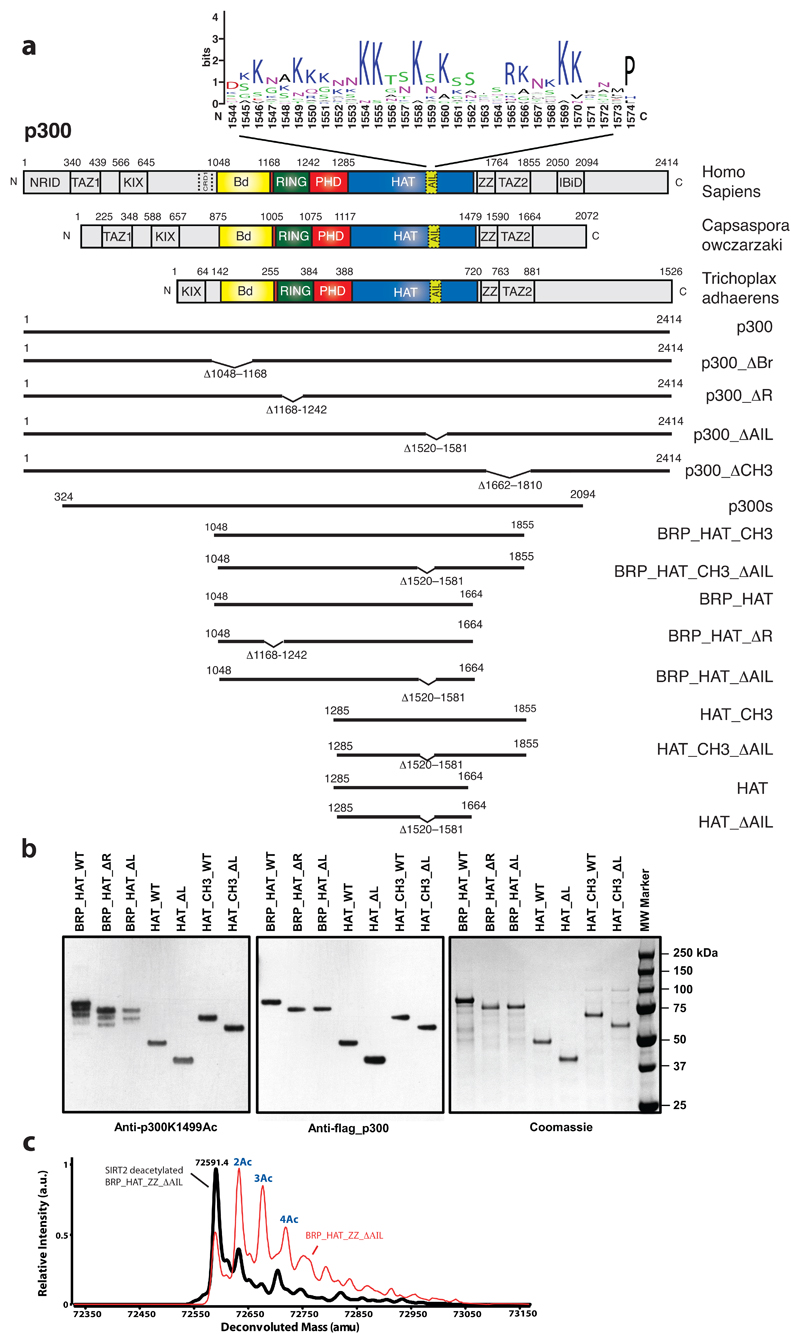
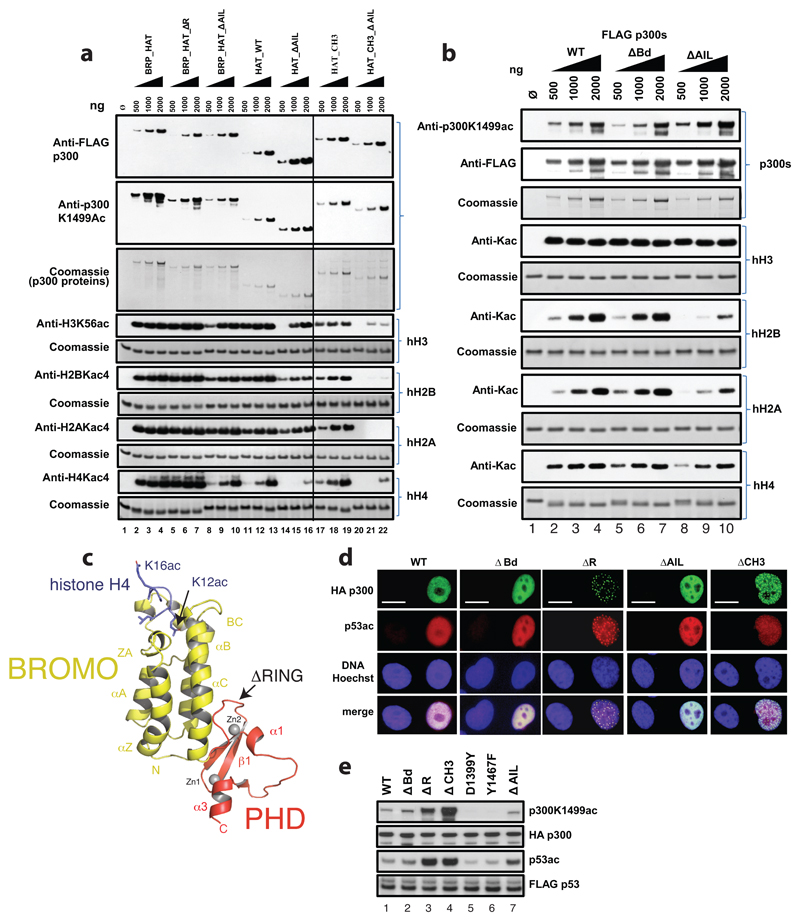
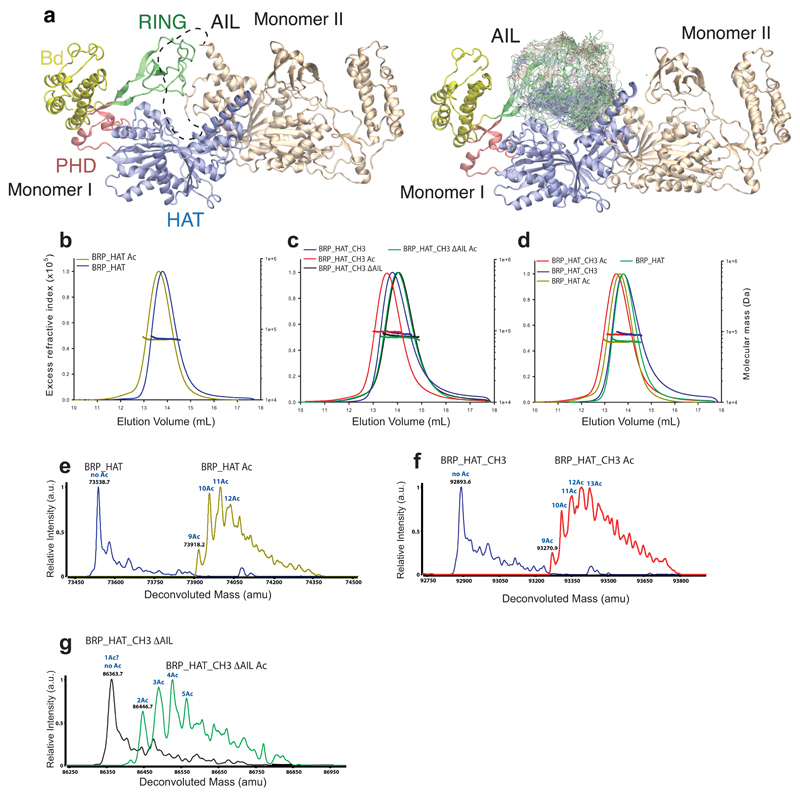
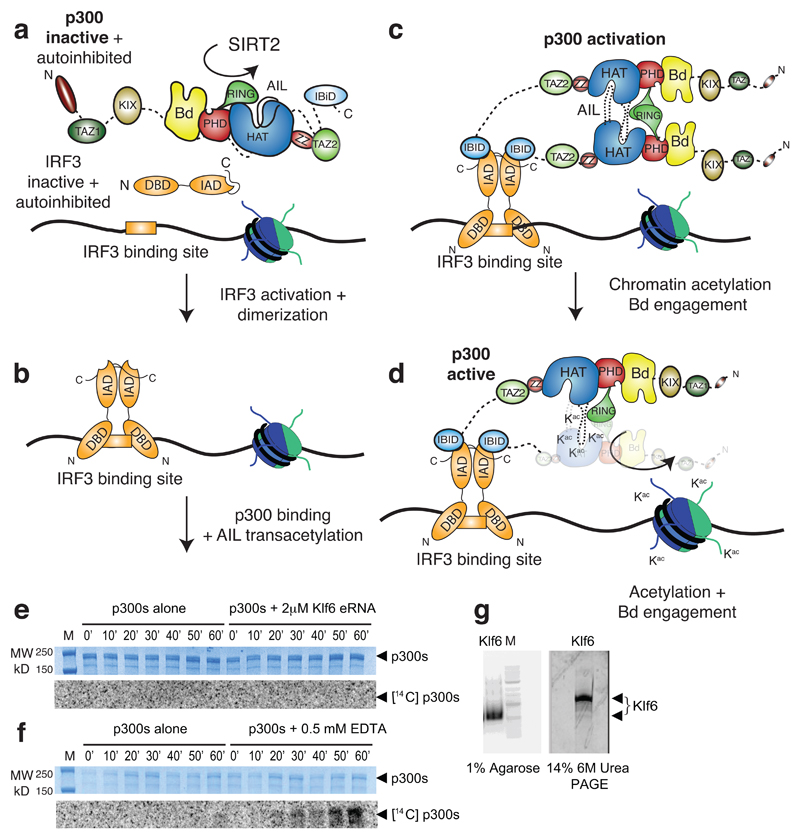
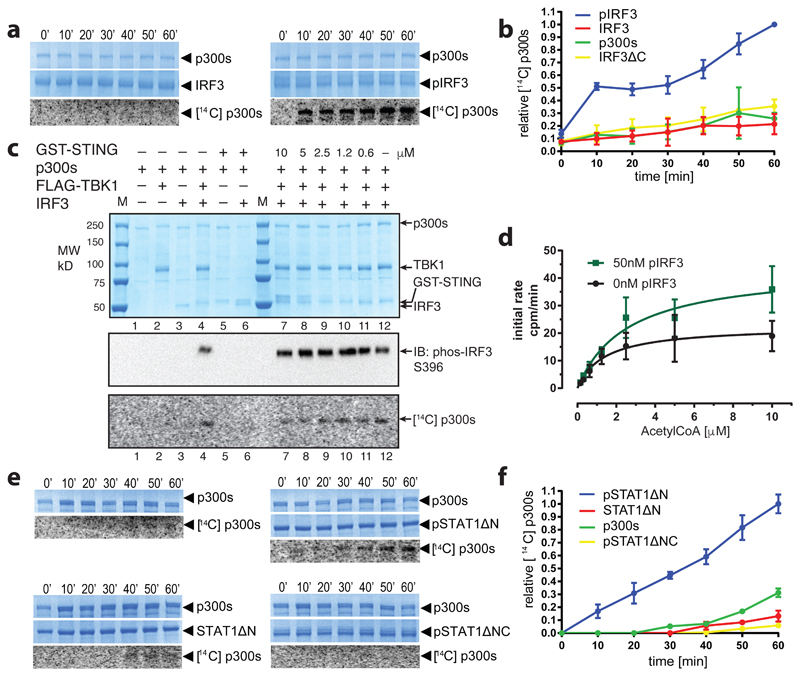
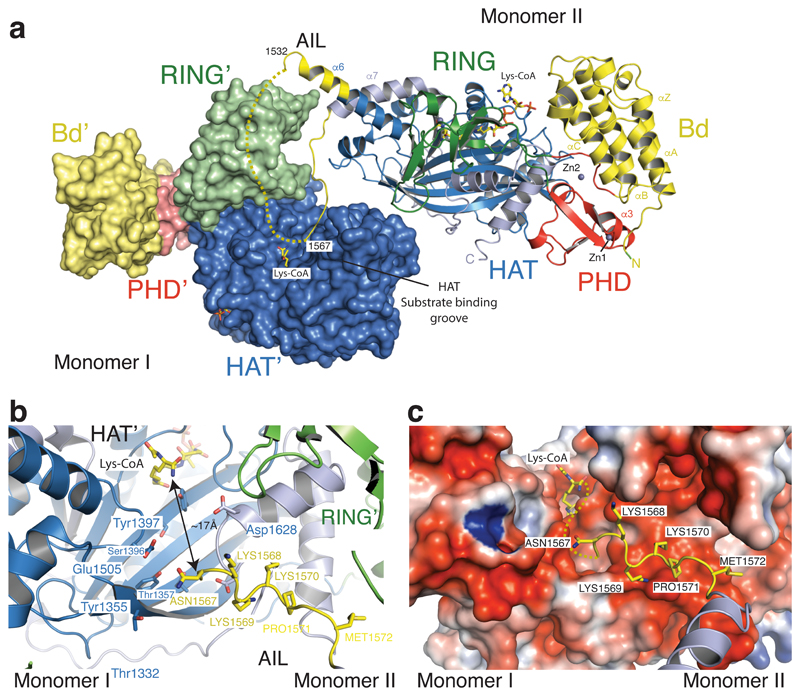
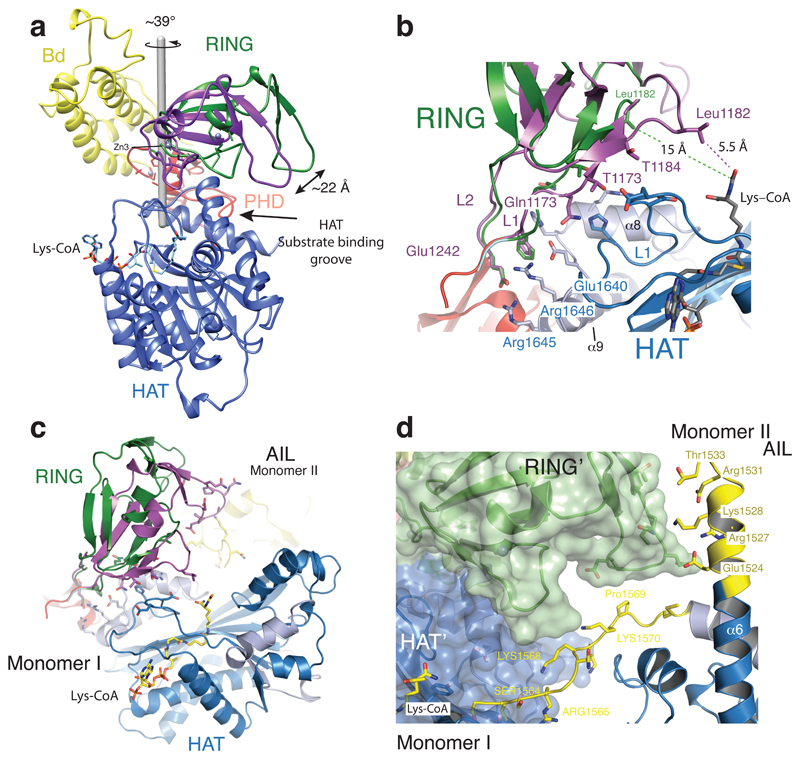
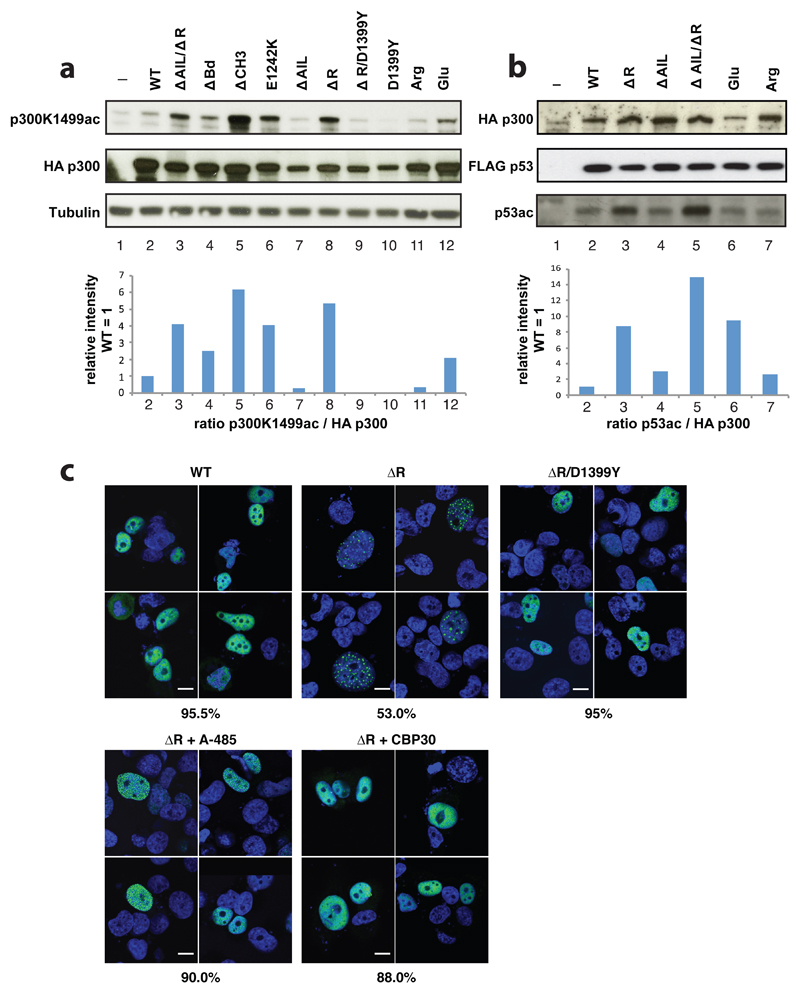
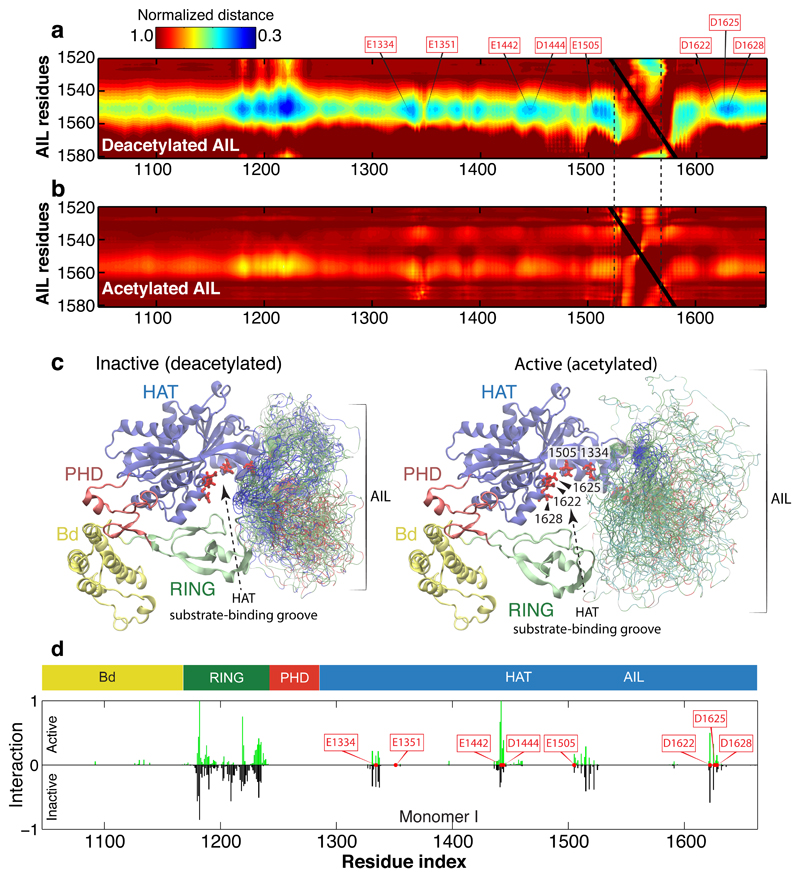
The transcriptional co-activator p300 is a histone acetyltransferase (HAT) that is typically recruited to transcriptional enhancers and regulates gene expression by acetylating chromatin. Here we show that the activation of p300 directly depends on the activation and oligomerization status of transcription factor ligands. Using two model transcription factors, IRF3 and STAT1, we demonstrate that transcription factor dimerization enables the trans-autoacetylation of p300 in a highly conserved and intrinsically disordered autoinhibitory lysine-rich loop, resulting in p300 activation. We describe a crystal structure of p300 in which the autoinhibitory loop invades the active site of a neighbouring HAT domain, revealing a snapshot of a trans-autoacetylation reaction intermediate. Substrate access to the active site involves the rearrangement of an autoinhibitory RING domain. Our data explain how cellular signalling and the activation and dimerization of transcription factors control the activation of p300, and therefore explain why gene transcription is associated with chromatin acetylation.


Conflict of interest statement

The authors declare no competing financial interests.

Figures

Extended Data Figure 1
Extended Data Figure 1. The impact of IRF3 or STAT1 activation and oligomerisation on p300 autoacetylation.
(a) Domain structure of IRF3. Truncation construct used is shown below. (b) Size-exclusion chromatography of IRF3 variants. The red curve is for unphosphorylated IRF3. The blue chromatogram is for phosphorylated pIRF3. The green curve is C-terminally truncated IRF3ΔC. Representative data of three independent experiments are shown. (c) A constant amount of p300s (2 μM) was incubated alone or in the presence of C-terminally truncated IRF3ΔC (2 μM) for the indicated time points. Samples were analyzed by SDS-PAGE followed by Coomassie staining and autoradiography. (d) Progress curves of HAT scintillation proximity assay. Histone H4 substrate acetylation in the presence (green) or absence (black) of pIRF3 and varying concentrations of [3H] acetyl-CoA. The degree of Histone H4 substrate acetylation at different time points and the initial velocity (cpm/min) at the indicated acetyl-CoA concentrations were determined and plotted in Figure 1E. Three independent experiments were performed and the mean value and error bars representing the standard deviation are shown. (e) Domain structure of STAT1. Truncation constructs used are shown below. The Tyr701 phosphorylation site is indicated. (f) Uncropped images of SDS-PAGE gels shown in Figure 1D. 14C autoacetylation signal of p300s is shown below. (g) Size-exclusion chromatography of STAT1 variants. The black curve is for STAT1ΔNC. The green chromatogram is for STAT1ΔNC. The red curve is for Y701 phosphorylated pSTAT1ΔNC. The blue chromatogram is for Y701 phosphorylated pSTAT1ΔN. (h) SDS-PAGE analysis of STAT1 variants and analysis by western blotting. Coomassie staining of SDS-PAGE gel (top); PonceauS staining (middle) and western blot using anti Phospho-Stat1 (Tyr701). Representative data of three independent experiments are shown. For gel source data, see Supplementary Figure 1.
Extended Data Figure 2
Extended Data Figure 2. Structural analysis of the RING domains.
(a) Superposition of the four p300 molecules (monomer I-IV) in the asymmetric crystallographic unit. While the Bromodomains (Bd), PHD and HAT domains superpose with a root mean square deviation of ~ 0.9 Å, the RING domains take multiple conformations, (b) 2Fo-Fc (blue mesh) as well as anomalous difference Fourier maps (orange mesh) for the four RING domains contoured around 1σ and 2.5σ, respectively.
Extended Data Figure 3
Extended Data Figure 3. Crystal packing of the p300 core molecule.
(a) There are four p300 molecules (monomer I-IV) in the asymmetric crystallographic unit. The four molecules show an antiparallel arrangement of the BRP-HAT domains. As a result HAT domains from monomer I and II are closely apposed. Monomer III and IV engage monomer IVsym and monomer IIIsym, respectively, of a neighboring crystallographic unit, showing that all promoters are in a AIL-loop swap conformation. Black arrows indicate the direction of the AIL. The disordered segment of the AIL is shown as a black dotted line. (b) Electron density of the AIL. A 2Fo-Fc and (c) a Fo-Fc difference density omit map contoured at 0.8 or 2.0 RMSD (root means square deviation), respectively. Coloring as in Figure 3.
Extended Data Figure 4
Extended Data Figure 4. Regulation of HAT activity by flanking domains.
(a) Domain structure of p300. Sequence conservation of the AIL is shown using WebLogo. Constructs used are shown. (b) Analysis of in vitro expression of the indicated p300 variants. Purified proteins were analyzed for autoacetylation by immunoblotting with anti-p300 K1499 acetyl antibody (left panel), anti-FLAG antibody (middle) and Coomassie staining (right). Representative data of three independent experiments are shown. (c) Representative mass spec analysis of BRP_HAT_ZZ_ΔAIL following after in vitro expression (red curve) and after SIRT2 mediated deacetylation (black curve).
Extended Data Figure 5
Extended Data Figure 5. Regulation of HAT activity by flanking domains.
(a) The AIL contributes to histone substrate acetylation of activated p300. The details of the constructs used are indicated in Extended Data Figure 4. Defined amounts of p300 variants were incubated with acetyl-CoA and the indicated histones prior to SDS-PAGE analysis followed by Coomassie staining and western blotting with the indicated antibodies. (b) The indicated amounts of purified p300s variants were incubated with histone octamers as in panel (a), followed by SDS-PAGE and immunoblot analysis with the indicated antibodies. Anti-Kac: pan-acetyl-lysine antibody. Representative data of three independent experiments are shown. (c) Crystal structure of the H4 K12acK16ac peptide bound to the BΔRP module containing an in frame RING deletion. Amino acid residues 1169-1241 were replace by a single Glycine residue. The deletion removes the RING domain (black arrow) and does not adversely affect structural integrity of the BΔRP module. (d) Indicated variants of p300 were co-expressed with p53 in H1299 cells and analyzed by immunofluorescence with the indicated antibodies or (e) by western blotting. Representative data of three independent experiments are shown. Scale bar, 10 μm.
Extended Data Figure 6
Extended Data Figure 6. Autoacetylation changes the hydrodynamic properties of p300.
(a) Simulations of the AIL in context of the loop-swapped dimer. Left panel: Cartoon of the trajectory of the AIL (dashed line). Right panel: Representative conformations with the AIL Cα backbone atoms are coloured according to charge. (b) SEC-MALLS analysis of deacetylated (blue) and acetylated (yellow) p300 core. Note the decrease in elution volume upon acetylation. (c) SEC-MALLS analysis of deacetylated (blue), acetylated (red) BRP_HAT_CH3 and deacetylated (black) and acetylated BRP_HAT_CH3 ΔAIL (green). There is no increase in elution volume upon acetylation of theΔAIL construct. (d) Comparison of acetylated and deacetylated BRP_HAT and BRP_HAT_CH3. The deacetylated BRP_HAT (green) and deacetylated BRP_HAT_CH3 (blue) elute at the same position indicating a similar hydrodynamic radius. The acetylated BRP_HAT (yellow) and BRP_HAT_CH3 (red) elute at a larger elution volume. The normalized refractive index is plotted as a function of elution volume from an S200 column coupled to a MALLS detector. Calculated molecular masses are plotted as a function of volume for each eluted peak. The experiment was carried out at least three times with similar results. One representative example of each sample is shown. (e) Mass spectrometry analysis using electrospray ionization (ESI) of the BRP_HAT before (blue), and after (yellow) autoacetylation. The molecular mass and the number of acetylation events are indicated. (f) BRP_HAT_CH3 before (blue) and after (red) autoacetylation. (g) BRP_HAT_CH3_ΔAIL before (black) and after (green) autoacetylation.
Extended Data Figure 7
Extended Data Figure 7. Molecular model and controls showing that p300 acetyltransferase activity is not stimulated by eRNA.
(a) p300 is maintained in the inactive state by deacetylases such as SIRT2. IRF3 is autoinhibited by a C-terminal segment in the IAD domain. (b) TBK1 phosphorylation activates and dimerises IRF3. The activated IRF3 dimer engages the IBID domain of p300. (c) Recruitment of two molecules of p300 results in trans-autoacetylation in the AIL loop and HAT activation. (d) Activated p300 can acetylate chromatin and engage acetylated substrates via the Bd. (e) A constant amount of p300s (2 μM) was incubated in [14C] acetyl-CoA alone or in the presence of 2 μM Klf6 eRNA for the indicated time points. Samples were analyzed by SDS-PAGE followed by Coomassie staining (top) and autoradiography (bottom). (f) As in (e) but in the presence of 0.5 mM EDTA. The experiment was carried out at least two times with consistency. One representative example is shown. (g) Quality control of Klf6 RNA. 3 μg Klf6 was deposited on a 1% Agarose gel or a 14% 6M Urea PAGE gel and detected by SYBR Safe stain. M: 100bp DNA ladder (NEB).
Figure 1
Figure 1. Transcription factor dimerization activates p300.
(a) p300s was incubated for the indicated times in the presence or absence of inactive, monomeric IRF3 or TBK1-phosphorylated, dimeric pIRF3. Samples were analysed by SDS-PAGE followed by Coomassie staining and autoradiography. Representative data of three independent experiments are shown. (b) Quantification of autoacetylation of p300s. (c) p300 is activated by TBK1-mediated IRF3 phosphorylation. p300s was incubated with recombinant GST-STING, TBK1 and IRF3 in the presence of ATP and [14C] acetyl-CoA. Top panel: Coomassie-stained SDS-PAGE gel. Middle panel: Analysis of IRF3 phosphorylation on S396 using immunoblotting. Bottom panel: autoradiography. Representative data of three independent experiments are shown. (d) HAT scintillation proximity assay. The degree of Histone H4 substrate acetylation was quantified using scintillation counting. (e) As in panel a but using inactive, monomeric STAT1ΔN or activated, dimeric pSTAT1ΔN. Activated, dimeric pSTAT1ΔNC lacking the C-terminal TAD did not stimulate p300s autoacetylation. Samples were analysed as in panel (a). Representative data of three independent experiments are shown. (f) Quantification of autoacetylation of p300s. Intensity values were normalized by dividing by the maximum autoacetylation signal obtained after 60 minutes. Error bars shown in panels (b), (d) and (f): Three independent experiments were performed and the mean value and error bars representing the standard deviation are shown. Data analysis and plotting was done with GraphPad Prism 7.0. For gel source data, see Supplementary Figure 1.
Figure 2
Figure 2. The structure of p300 adopts a AIL swap conformation.
(a) Monomer I is surface rendered and monomer II is shown as a cartoon. The AIL loop from monomer II is shown in yellow. The AIL lies near the HAT substrate binding groove of monomer I. A disordered segment of the AIL is shown as a dotted line. (b) Close up view of the residues of the AIL loop from monomer II and residues of monomer I in the substrate binding pocket. (c) Binding of the positively charged AIL is mediated by interactions with negatively charged residues in the HAT binding pocket.
Figure 3
Figure 3. Structural rearrangement of the RING domain.
(a) The RING domain (green) rotates ~39° resulting in a ~22 Å displacement away from the active site. The rotation axis is indicated as a grey rod. (b) In the loop-swap conformation, residues in the RING-HAT interface are disrupted thus resulting in a more open HAT active site. Leu1182 is positioned ~15Å away from the Lys-CoA inhibitor in the loop-swap conformation (green) but within 5.5Å in the absence of the loop swap (magenta). (c) Repositioning of the RING domain allows the AIL from monomer II to approach the HAT active site of monomer I. (d) Details of the interaction surface of the AIL from monomer II with the RING domain of monomer I.
Figure 4
Figure 4. Regulation of HAT activity by flanking domains.
(a) Indicated variants of p300 were transiently co-transfected with p53 in COS cells and samples analysed by western blotting using the indicated antibodies. Bottom panel: quantification p300 K1499Ac signal. (b) Analysis of p53 acetylation. Bottom panel: quantification p53 acetylation signal. Representative data of three independent experiments are shown. For details on the mutants see Extendend Data Fig. 4a. Arg and Glu: lysine amino acids in the AIL segment spanning amino acids 1546-1570 were mutated to arginine or glutamate, respectively (c) H1299 cells were transfected with the indicated construct and analyzed by immunoflorescence using Anti-HA for p300 (green) and cell nuclei were stained with Hoechst (blue). Bottom panels: Cells were treated with the A-485 HAT or the CBP30 Bromodomain inhibitor. Percentage of cells showing the indicated phenotype (n=200 cells) is indicated below each panel. Scale bar, 10 μm. For gel source data, see Supplementary Figure 1.
Figure 5
Figure 5. Acetylation of the AIL regulates dynamic interaction with the substrate binding pocket of p300.
(a) Normalized distance between the AIL and residues in the inactive monomer. Inter-residue distances were normalized by the distances expected if the AIL behaved as a self-avoiding random coil. Electrostatic interaction mediated by conserved lysine residues between K1542 and K1560 of the AIL and aspartic/glutamic acid residues around the active site of the HAT domain, as shown by the residues highlighted (E1334, E1351, E1442, D1444, E1505, D1622, D1625, and D1628). The extensive contacts between the AIL and the RING domain originates in part from the RING domain’s proximity to the AIL in its inhibitory conformation. (b) Normalized distance between the AIL and all residues in the active (acetylated) monomer. After acetylation, lysine-mediated electrostatic interactions are lost. (c) Representative conformations with the AIL shown as an ensemble for the inactive deacetylated monomer (left) and the active acetylated monomer (right). The Cα atoms of residues in the AIL are coloured according to charge: blue (positive), red (negative) and green (non-charged). The HAT substrate-binding groove is more exposed in the active acetylated state, due to both the relative position of the RING domain and the lack of preferential interactions by the AIL. (d) Inter-molecular interactions in the loop-swapped dimer between the AIL of one HAT and the adjacent subunit of the other. The adjacent subunit is either in the active (top) and inactive (bottom) conformation. In the active state, the AIL is able to directly engage with residues E1442 and E1444 from the adjacent HAT substrate binding groove, suggesting the position of the RING domain has a steric impact on the accessibility of the AIL.

References

    1. Chen Q, Sun L, Chen ZJ. Regulation and function of the cGAS-STING pathway of cytosolic DNA sensing. Nature immunology. 2016;17:1142–1149. doi: 10.1038/ni.3558. - DOI - PubMed
    1. Panne D, McWhirter SM, Maniatis T, Harrison SC. Interferon regulatory factor 3 is regulated by a dual phosphorylation-dependent switch. J Biol Chem. 2007;282:22816–22822. doi: 10.1074/jbc.M703019200. M703019200 [pii] - DOI - PubMed
    1. Zhao B, et al. Structural basis for concerted recruitment and activation of IRF-3 by innate immune adaptor proteins. Proc Natl Acad Sci U S A. 2016;113:E3403–3412. doi: 10.1073/pnas.1603269113. - DOI - PMC - PubMed
    1. Parekh BS, Maniatis T. Virus infection leads to localized hyperacetylation of histones H3 and H4 at the IFN-beta promoter. Mol Cell. 1999;3:125–129. - PubMed
    1. Panne D, Maniatis T, Harrison SC. An atomic model of the interferon-beta enhanceosome. Cell. 2007;129:1111–1123. doi: 10.1016/j.cell.2007.05.019. S0092-8674(07)00656-3 [pii] - DOI - PMC - PubMed

Publication types

MeSH terms