. 2018 Nov;19(11):1212-1223.
doi: 10.1038/s41590-018-0232-x. Epub 2018 Oct 15.

Fibrin-targeting immunotherapy protects against neuroinflammation and neurodegeneration

Affiliations

Fibrin-targeting immunotherapy protects against neuroinflammation and neurodegeneration

Jae Kyu Ryu et al. Nat Immunol. 2018 Nov.

Abstract

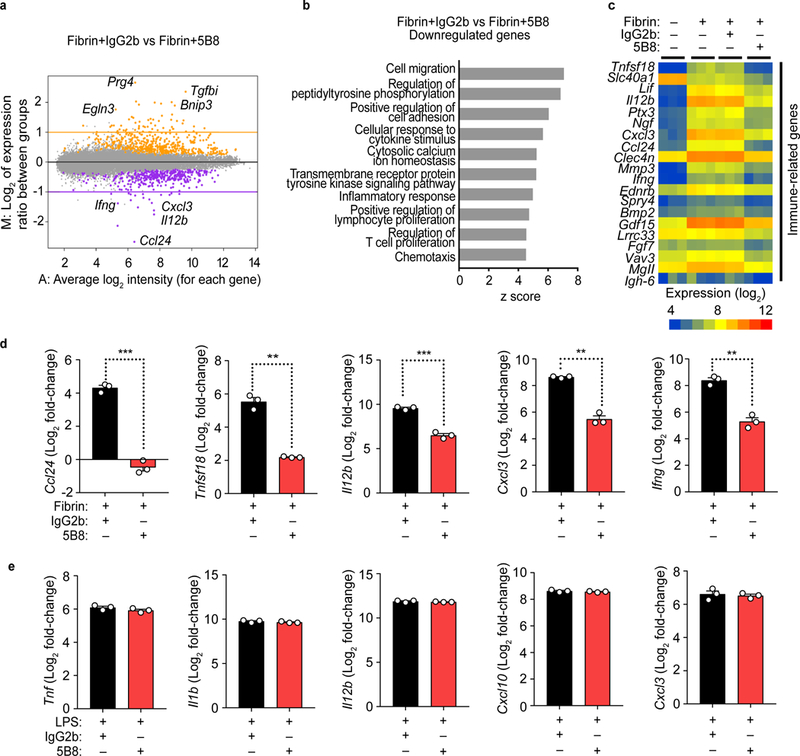
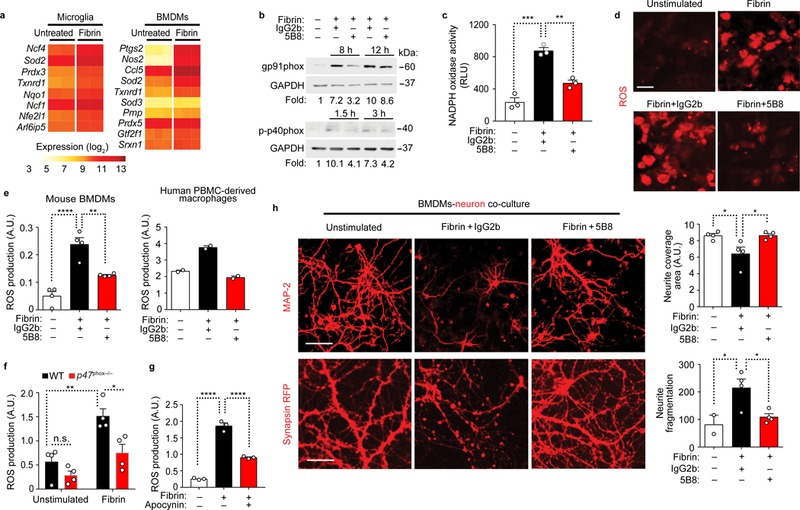
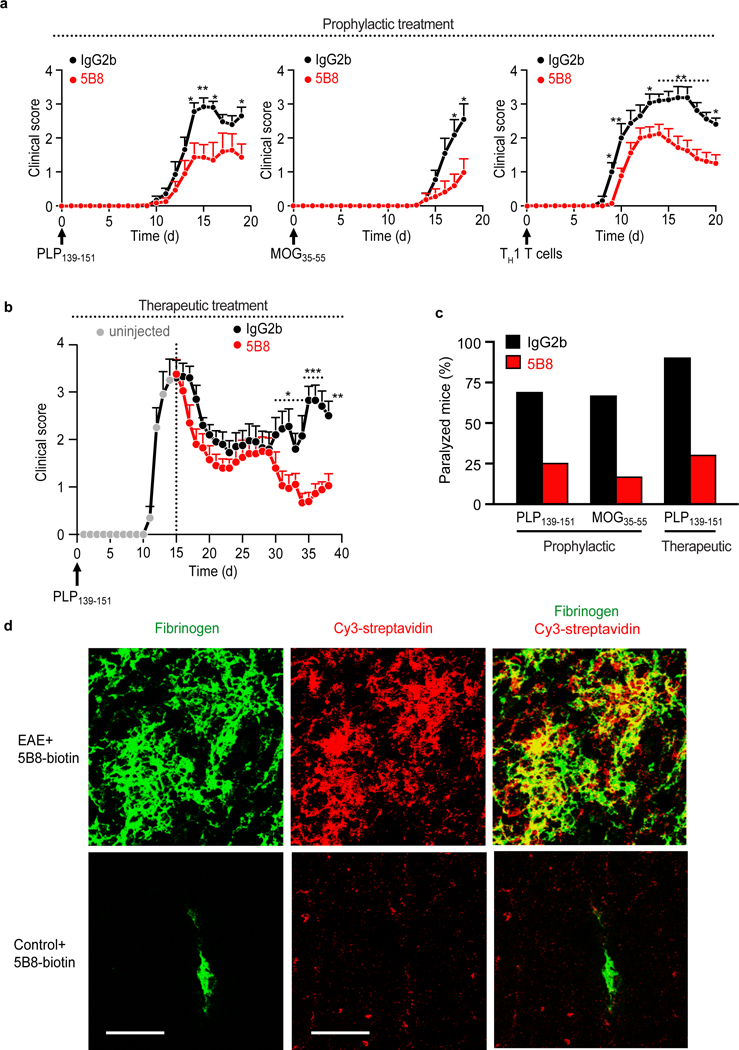
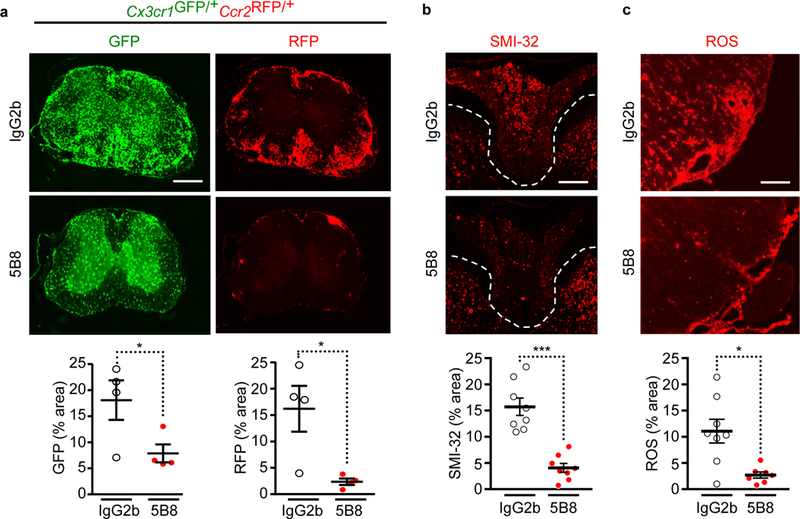
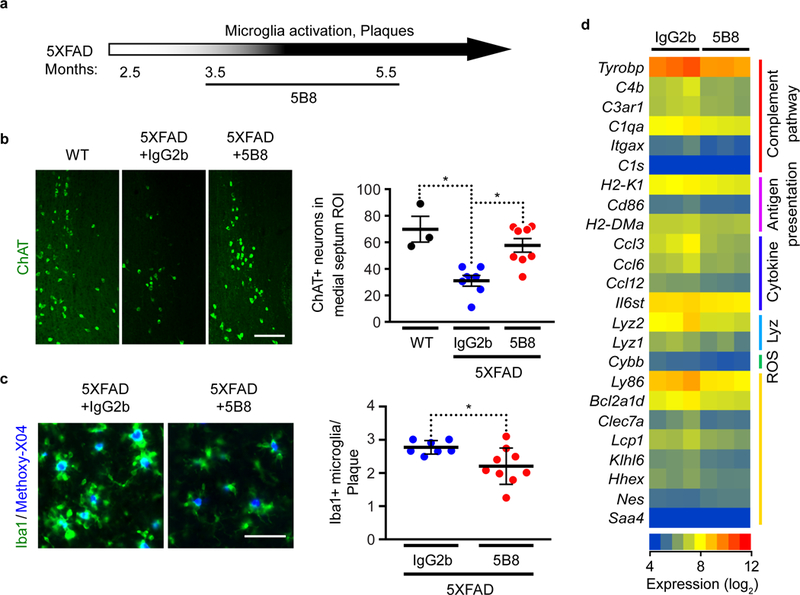
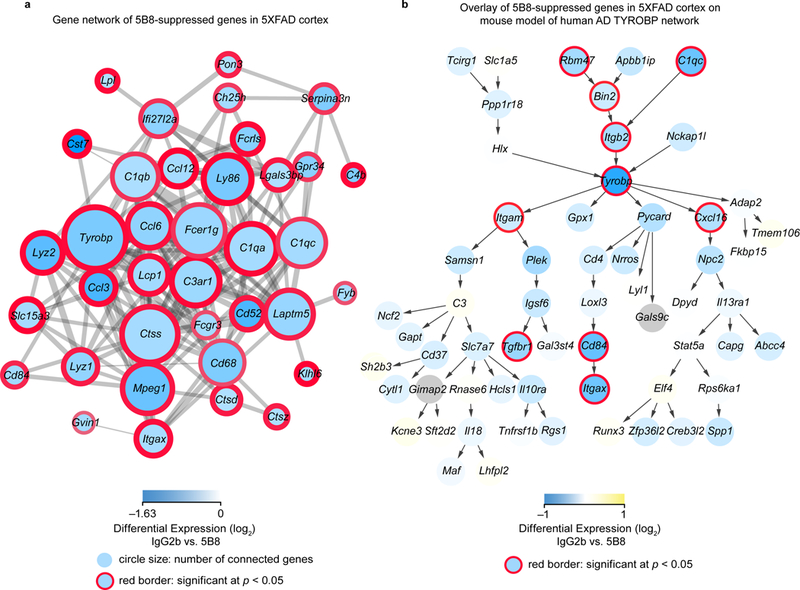
Activation of innate immunity and deposition of blood-derived fibrin in the central nervous system (CNS) occur in autoimmune and neurodegenerative diseases, including multiple sclerosis (MS) and Alzheimer's disease (AD). However, the mechanisms that link disruption of the blood-brain barrier (BBB) to neurodegeneration are poorly understood, and exploration of fibrin as a therapeutic target has been limited by its beneficial clotting functions. Here we report the generation of monoclonal antibody 5B8, targeted against the cryptic fibrin epitope γ377-395, to selectively inhibit fibrin-induced inflammation and oxidative stress without interfering with clotting. 5B8 suppressed fibrin-induced nicotinamide adenine dinucleotide phosphate (NADPH) oxidase activation and the expression of proinflammatory genes. In animal models of MS and AD, 5B8 entered the CNS and bound to parenchymal fibrin, and its therapeutic administration reduced the activation of innate immunity and neurodegeneration. Thus, fibrin-targeting immunotherapy inhibited autoimmunity- and amyloid-driven neurotoxicity and might have clinical benefit without globally suppressing innate immunity or interfering with coagulation in diverse neurological diseases.


Conflict of interest statement

Competing Interests

The authors declare competing financial interests.

Figures

Fig. 1 │
Fig. 1 │. Generation and characterization of monoclonal antibody 5B8 targeting the γ377–395 fibrin epitope.
a, Structural map of cryptic epitope γ377–395 in the γC-domain of fibrinogen. The γ377–395 epitope (red) includes a core β-strand and portion of the fibrin γC-domain’s C-terminal loop and binds to the CD11b I-domain. b, Binding affinity of 5B8 to γ377–395 measured by ELISA. Data are mean ± s.e.m. of 4 independent experiments. c, Comparison of 5B8 binding to fibrin and fibrinogen by ELISA. Data are mean ± s.e.m. of 3 independent experiments. d, 5B8 competition with the CD11b I-domain for binding to fibrin by competitive ELISA. Data shown from one experiment. e, Microglia stimulated with fibrin in the presence of 5B8 (10, 20, and 40 μg/ml). Representative images are shown from unstimulated, and fibrin-treated microglia in the absence or presence of 40 μg/ml 5B8. Scale bar, 10 μm. Quantification of microglia activation (increased cell size) at 48 h after treatment is shown. Data are mean ± s.e.m. from 4 independent experiments (untreated, fibrin, fibrin + 40 μg/ml 5B8) analyzed with manual and automated quantification with similar results. ****P < 0.0001 by one-way analysis of variance (ANOVA) with Sidak’s multiple comparisons test. f, In vitro fibrin polymerization was examined in the presence of fibrinogen (FN) alone or with 5B8, IgG2b, or GPRP. Data are representative of two independent experiments with similar results. g, aPTT assay was performed in human plasma in the presence of 5B8, IgG2b, or GPRP. Data are representative of two independent experiments with similar results. h, In vivo clotting times of blood from 5B8-injected mice and uninjected controls. Data are mean ± s.e.m.; n = 8 mice per treatment. P = 0.7768 (two-tailed Mann-Whitney test); n.s., not significant.
Fig. 2 │
Fig. 2 │. Gene expression changes by 5B8 treatment of fibrin-stimulated BMDMs.
a, MA plot of whole-genome microarray analysis of 5B8- vs. IgG2b-treated BMDMs 6 h after fibrin stimulation. Colors indicate genes whose expression was significantly increased (orange) or decreased (purple) by 5B8; the remaining genes are in gray. Data are from 3 independent experiments. Linear models were fitted for each gene using the Bioconductor ‘limma’ package in R. Moderated t-statistics, fold change and the associated P values were calculated for each gene (two-tailed, raw P < 0.001). b, The top 10 biological processes relevant to 5B8-reduced innate/adaptive immune transcripts in BMDMs were identified by GO-Elite analysis (Z score >2.0, P < 0.05) c, Heat map of the top 20 transcripts that were significantly downregulated after 5B8 treatment of fibrin-stimulated BMDMs. Whole-genome microarray data from 3 independent experiments. d, Relative expression of transcripts of proinflammatory genes Ccl24, Tnfsf18, Il12b, Cxcl3, and Ifng in fibrin-stimulated BMDMs treated with 5B8 or IgG2b, measured by qRT-PCR. Y-axis indicates log2 value of relative fold changes in qRT-PCR results. Data are mean ± s.e.m. from 3 independent experiments. *** P = 0.0001 (Ccl24), ** P = 0.0052 (Tnfsf18), *** P = 0.0010 (Il12b), ** P = 0.0050 (Cxcl3), and ** P = 0.0015 (Ifng) by unpaired two-tailed t-test with Welch’s correction. e, 5B8 had no effect on LPS-induced gene expression in BMDMs analyzed by qRT-PCR. Y-axis indicates log2 value of relative fold changes in qRT-PCR results. Data are mean ± s.e.m. from 3 independent experiments. No significant difference by unpaired two-tailed t-test with Welch’s correction.
Fig. 3 │
Fig. 3 │. 5B8 blocks fibrin-induced ROS production and axonal damage.
a, Heat map of significantly differentially expressed ROS-related genes in fibrin-induced microglia and BMDMs (|log2 fold change| > 0.585 and FDR < 0.05; two-tailed moderated t-test). b, Immunoblot for gp91phox and p-p40phox in BMDMs stimulated with fibrin as indicated in the presence of 5B8 or IgG2b. Representative cropped blot images from 3 independent experiments are shown. Full blots are included in Supplementary Fig. 9. c, NADPH oxidase activity in 12 h fibrin-stimulated BMDMs in the presence of 5B8 or IgG2b. Data are mean ± s.e.m. of 3 independent experiments. RLU, relative chemiluminescent light units. ** P = 0.0015 and *** P = 0.0001 by one-way ANOVA with Tukey’s multiple comparisons test. d, ROS production by fibrin-stimulated BMDMs detected with dihydroethidium (DHE, red). Scale bar, 10 μm. Data are representative of three independent experiments with similar results. e, Quantification of ROS production by DHE in BMDMs (left) and human PBMC-derived macrophages (right) 48 h after fibrin stimulation in the presence of 5B8 or IgG2b. Data are mean ± s.e.m. of 4 (left graph) and 2 (right graph) independent experiments. A.U., arbitrary units. ** P = 0.0033, **** P <0.0001 (mouse BMDMs) by one-way ANOVA with Bonferroni multiple comparisons test. f, ROS production 24 h after fibrin stimulation in BMDMs isolated from WT and p47phox–/– mice. Data are mean ± s.e.m. of n = 4 mice per group. A.U. * P = 0.0204, ** P = 0.0040 by two-way ANOVA with Sidak’s multiple comparisons test. n.s., not significant. g, ROS production measured by DHE in murine BMDMs 24 h after fibrin stimulation in the presence of apocynin. Data are mean ± s.e.m. of 3 independent experiments. A.U.-- **** P < 0.0001 by one-way ANOVA with Tukey’s multiple comparisons test. h, MAP-2+ (upper panel) and synapsin-RFP (lower panel) cortical neurons co-cultured with unstimulated or fibrin-stimulated BMDMs in the presence of 5B8 or IgG2b. Scale bars, 50 μm (top panels) and 30 μm (bottom panels). Quantification of MAP-2+ neurites (top) and synapsin-RFP+ neurites (bottom). Data are mean ± s.e.m. from 4 independent experiments * P = 0.0385 (unstimulated vs Fibrin+IgG2b, top), * P = 0.0370 (Fibrin+IgG2b vs Fibrin+5B8, top); * P = 0.0168 (Fibrin+IgG2b vs Fibrin+5B8, bottom) by one-way ANOVA with Bonferroni multiple comparisons test.
Fig. 4 │
Fig. 4 │. 5B8 suppresses EAE and engages fibrin target.
a, Reduction of clinical signs after 5B8 administration in four EAE models. Prophylactic administration of 5B8 or IgG2b isotype control in PLP139–151, MOG35–55, and adoptive transfer TH1 EAE (* P < 0.05, ** P < 0.01, linear mixed effects model with two-tailed permutation test). Mice were each given 800 μg of either 5B8 or isotype-control IgG2b every two days from day 0. Data are mean ± s.e.m. from PLP139–151 (n = 16 IgG2b and n = 16 5B8), MOG35–55 (n = 11 IgG2b and n = 12 5B8), and TH1 EAE (n = 15 IgG2b and n = 24 5B8) b, Therapeutic administration of 5B8 or IgG2b isotype control in PLP139–151 EAE after peak of disease (* P < 0.05, ** P < 0.01, *** P < 0.001, linear mixed effects model with two-tailed permutation test). For therapeutic treatment, antibodies were injected every two days starting at the peak of the initial paralytic episode. Data are mean ± s.e.m. from PLP139–151 EAE (n = 10 IgG2b and n = 10 5B8). c, Effect of 5B8 treatment on the percentage of paralyzed mice (defined as partial or complete hindlimb paralysis, score >2.5) in three EAE groups. d, Target engagement of i.p. injected biotinylated 5B8 in MOG35–55 EAE mice and healthy non-immunized control mice. Confocal microscopy of spinal cord sections from MOG35–55 EAE mice shows the spatial correlation (yellow) between biotinylated 5B8, detected with Cy3-streptavidin (red), and fibrin deposition, detected with a fibrin(ogen) antibody (green), in MOG35–55 EAE mice. Representative images are shown from n = 3 mice per group. Scale bar, 200 μm.
Fig. 5 │
Fig. 5 │. 5B8 inhibits microglial activation, monocyte recruitment, and axonal damage in EAE.
a, Spinal cord images of 5B8- or IgG2b-treated MOG35–55 EAE Cx3cr1GFP/+Ccr2RFP/+ mice. Scale bar, 500 μm. Quantification of Cx3cr1+ microglia (GFP, green) and Ccr2+ macrophages (RFP, red). Data are mean ± s.e.m.; n = 4 mice per treatment. * P = 0.0495 (GFP), * P = 0.0286 (RFP), by two-tailed Mann-Whitney test. b, SMI-32 immunoreactivity indicative of axonal damage in spinal cords of 5B8- or IgG2b-treated PLP139–151 EAE mice. Scale bar, 200 μm. Dotted lines indicate spinal cord dorsal column white matter. Quantification of SMI-32 immunoreactivity. Data are mean ± s.e.m.; n = 8 mice per group. *** P = 0.0002 , two-tailed Mann-Whitney test. c, ROS detection in the spinal cord with DHE of 5B8- or IgG2b-treated PLP139–151 EAE mice. Scale bar, 100 μm. Quantification of DHE. Data are mean ± s.e.m.; n = 8 IgG2b and n = 7 5B8. * P = 0.0140 by two-tailed Mann-Whitney test.
Fig. 6 │
Fig. 6 │. In vivo imaging of fibrinogen leakage in 5XFAD mice.
a, Fluorescent Aβ probe methoxy-X04-positive amyloid plaque in a cortical section from a 3-month-old 5XFAD mouse co-labeled for fibrinogen (red) and CD11b (green). Scale bar: 20 μm. n = 4 mice. Representative images are shown. b, In vivo two-photon imaging of cortex from Thy1-YFP:5XFAD mice at 11 months of age shows Alexa594-conjugated fibrinogen (administered intravenously) (red), a methoxy-X04-positive Aβ plaque (blue), and dystrophic neurites (green, swollen green structures). Arrowheads indicate fibrinogen (red) surrounding a Aβ plaque (blue) at areas of neuritic loss. Arrows indicate fibrinogen extravasation at areas of dystrophic neurites (yellow) in proximity to a plaque (blue). Scale bars: 10 μm. (n = 4 Thy1-YFP:5XFAD mice and n = 2 Thy1-YFP mice. Representative images are shown. c, 5B8 in vivo target engagement in the brain of 5XFAD mice. Brain sections of 5XFAD i.p.-injected with biotinylated 5B8 were stained with Cy3-streptavidin (red), anti-fibrinogen (green), and methoxy-X04-positive Aβ plaque (blue). Orthogonal views of the y/z and x/z planes show localization of fibrinogen and 5B8 antibody around amyloid plaques. Scale bar, 10 μm. n =3 mice Representative images are shown.
Fig. 7 │
Fig. 7 │. 5B8 protects against neurodegeneration and inflammatory responses in 5XFAD mice.
a, Schematic representation of 5B8 administration after appearance of plaques and microglia activation in 5XFAD mice (800 μg i.p. every other day for 2 months starting at 3.5 months of age). b, ChAT-positive cholinergic neurons in the medial septum of non-transgenic littermate control (WT), 5XFAD mice treated with IgG2b or 5B8. Scale bars 80 μm. Quantification of ChAT+ neurons. Data are mean ± s.e.m.; n = 3 WT, n = 7 IgG2b-treated and n = 8 5B8-treated 5XFAD mice. * P = 0.0211 (WT vs IgG2b), * P = 0.0157 (IgG2b vs 5B8) by Kruskal–Wallis with Dunn’s multiple comparisons test. c, Iba-1+ cells (green) around Methoxy-X04+ plaques (blue) in the cortex of 5XFAD mice treated with IgG2b or 5B8. Quantification of plaque-associated Iba-1+ microglia. Scale bar: 50 μm. Data are mean ± s.e.m.; n = 7 IgG2b-treated and n = 9 5B8-treated 5XFAD mice. * P = 0.0337 by two-tailed Mann-Whitney test. d, Affymetrix microarray gene expression analysis in the cortex of 5B8- or IgG2b-treated 5XFAD mice. Linear models were fitted for each gene using the Bioconductor ‘limma’ package in R. Moderated t-statistics, fold change and the associated P values were calculated for each gene (two-tailed, raw P < 0.05). Heatmap of select genes with differential expression patterns from GO terms were identified by GO-Elite analysis.
Fig. 8 │
Fig. 8 │. 5B8 suppresses the complement/TYROBP microglial module in 5XFAD mice.
a, Co-expression analysis revealed 5B8-downregulated genes to be densely interconnected, with Tyrobp forming a major hub. Blue shading indicates the level of reduction of gene expression by 5B8 compared to IgG2b treatment. The thickness of the red border around the circles indicates the statistical significance of the differential expression, and the size of the circles indicates the number of connected genes in this co-expression network. Downregulated genes of interest were selected from those with log2 fold change of −0.5 or less and raw p-value < 0.05 (two-tailed moderated t-test). b, Mouse model of the human AD TYROBP network with data overlay of the 5B8-downregulated genes in the 5XFAD mice. Yellow-Blue gradient fill color indicates differential expression and red border thickness indicates significance of P < 0.05 (two-tailed moderated t-test).

Comment in

  • Targeting fibrin in neurodegeneration.
    Martin R. Martin R. Nat Immunol. 2018 Nov;19(11):1149-1150. doi: 10.1038/s41590-018-0241-9. Epub 2018 Oct 15. Nat Immunol. 2018. PMID: 30323342 No abstract available.

References

    1. Rivest S Regulation of innate immune responses in the brain. Nat Rev Immunol 9, 429–439 (2009). - PubMed
    1. Ransohoff RM & Brown MA Innate immunity in the central nervous system. J Clin Invest 122, 1164–1171 (2012). - PMC - PubMed
    1. Lassmann H, van Horssen J & Mahad D Progressive multiple sclerosis: pathology and pathogenesis. Nat Rev Neurol 8, 647–656 (2012). - PubMed
    1. Schuh C et al. Oxidative tissue injury in multiple sclerosis is only partly reflected in experimental disease models. Acta Neuropathol 128, 247–266 (2014). - PMC - PubMed
    1. Heppner FL, Ransohoff RM & Becher B Immune attack: the role of inflammation in Alzheimer disease. Nat Rev Neurosci 16, 358–372 (2015). - PubMed

Publication types