. 2018 Sep 28:9:2247.
doi: 10.3389/fimmu.2018.02247. eCollection 2018.

Phenotypic Changes on Mycobacterium Tuberculosis-Specific CD4 T Cells as Surrogate Markers for Tuberculosis Treatment Efficacy

Affiliations

Phenotypic Changes on Mycobacterium Tuberculosis-Specific CD4 T Cells as Surrogate Markers for Tuberculosis Treatment Efficacy

Mohamed I M Ahmed et al. Front Immunol. .

Abstract

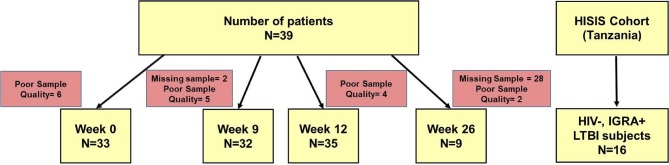
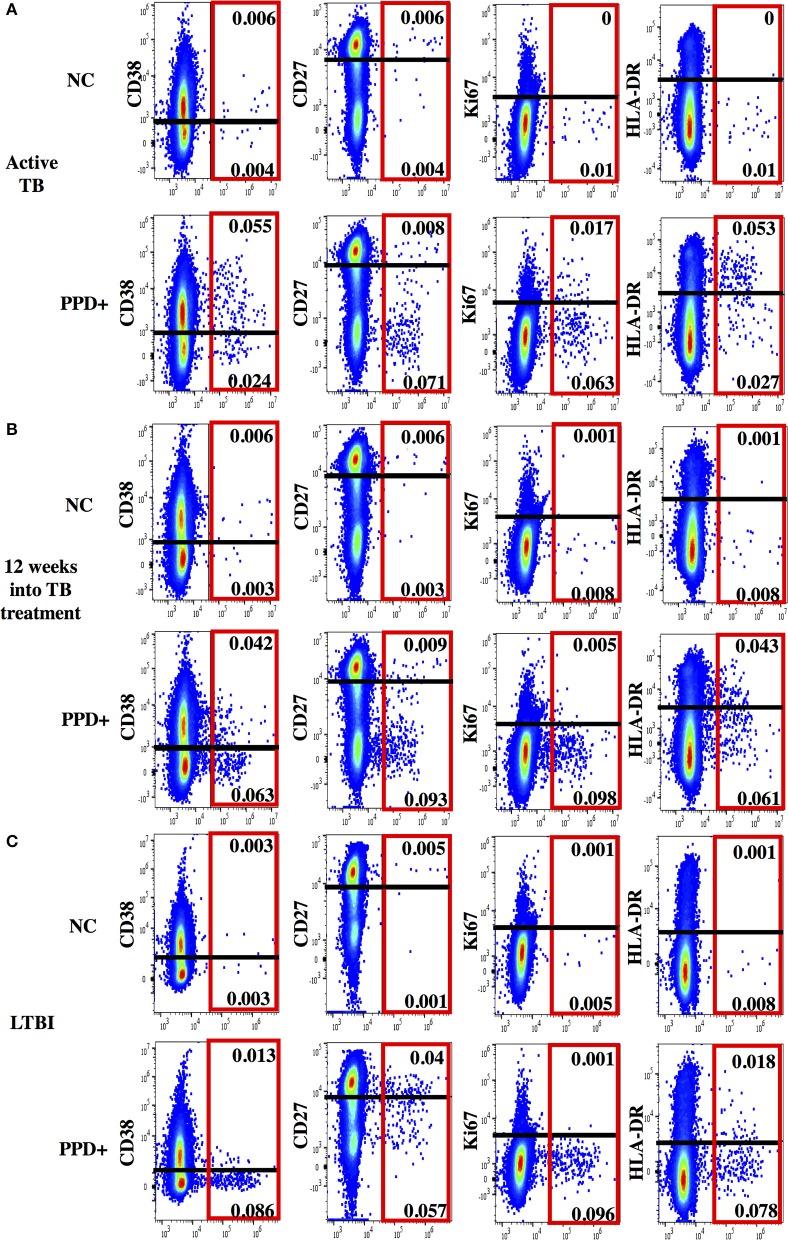
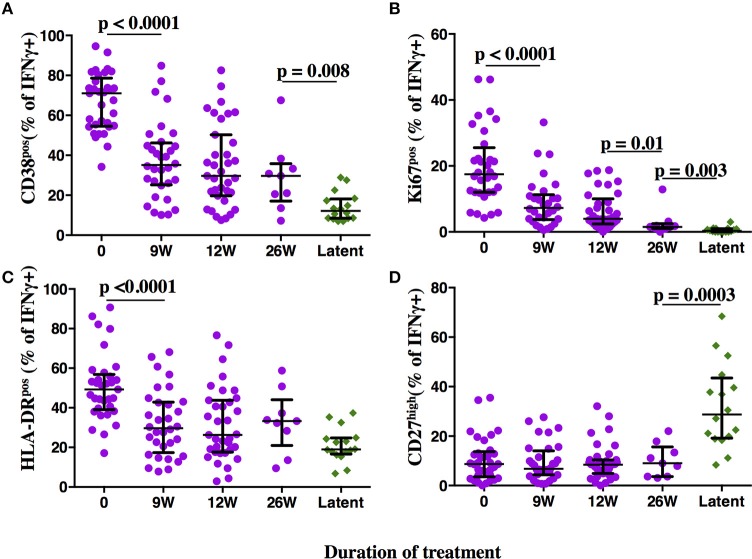
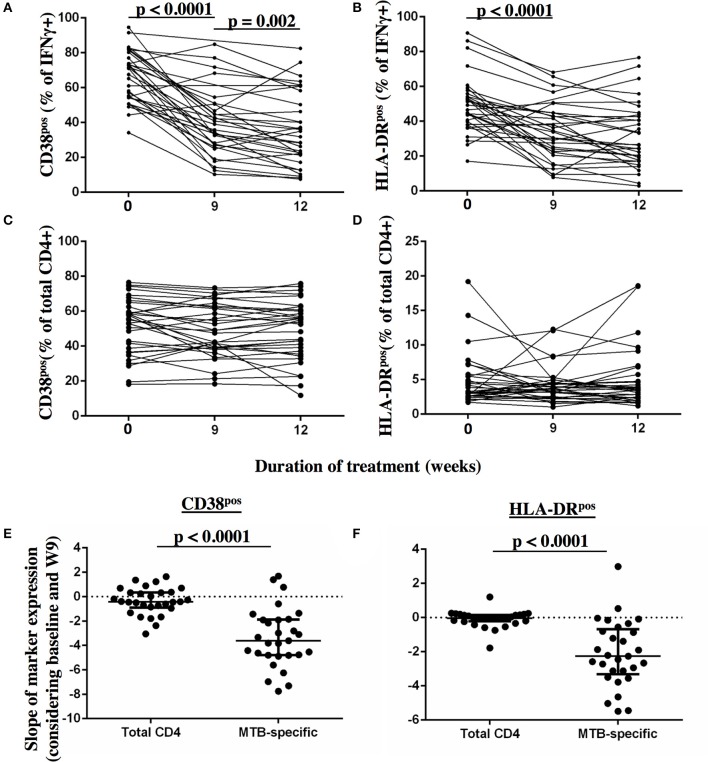
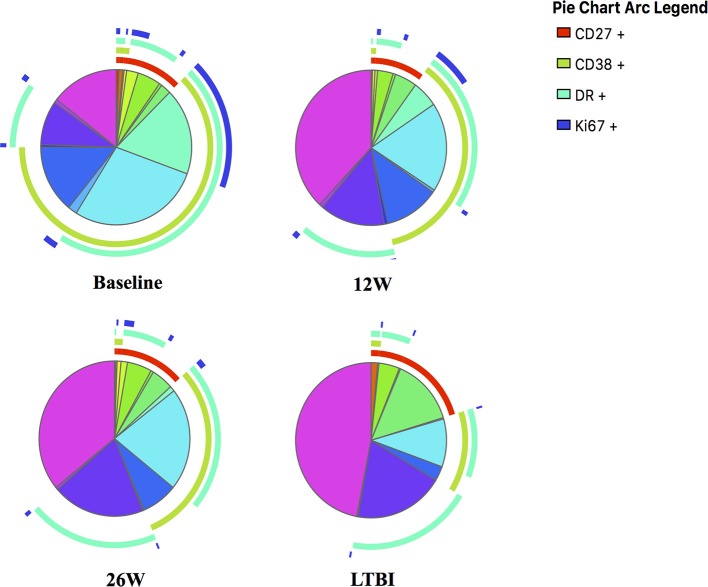
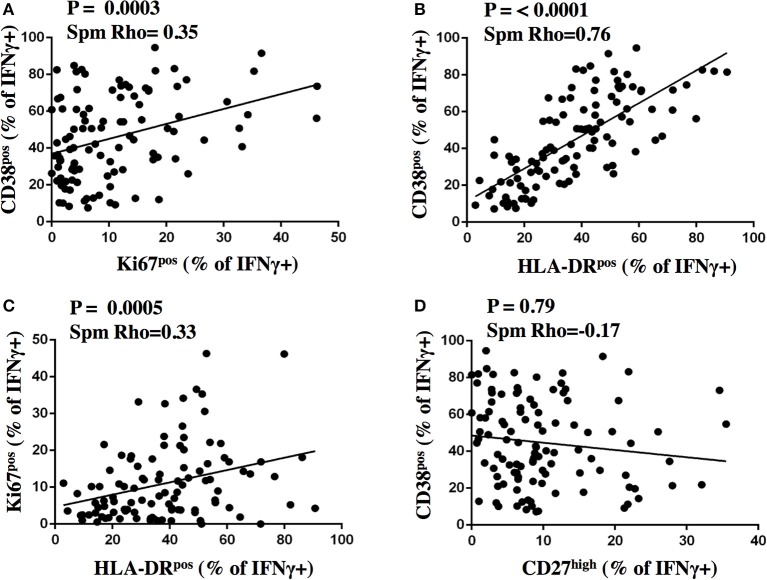
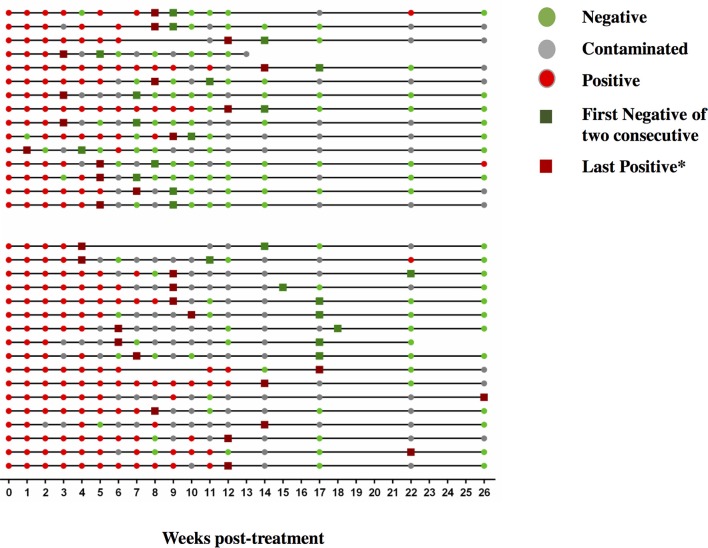
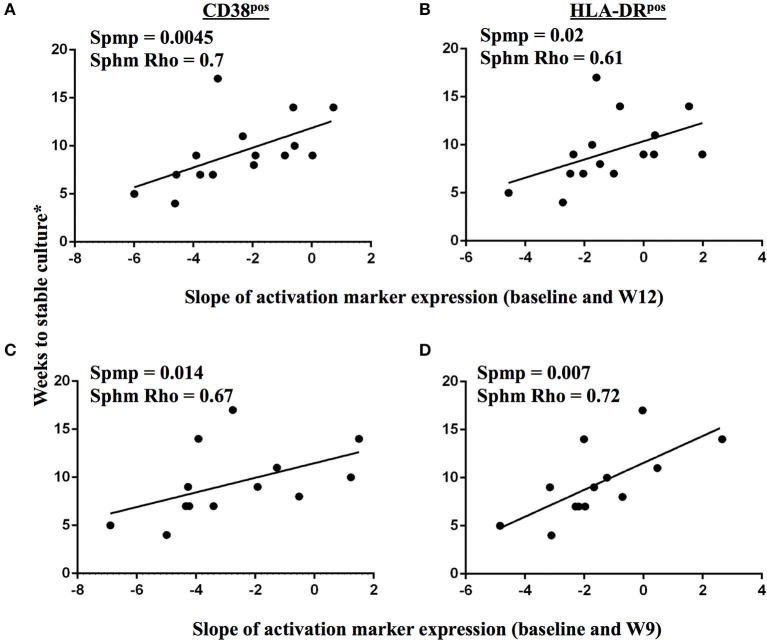
Background: The analysis of phenotypic characteristics on Mycobacterium tuberculosis (MTB)-specific T cells is a promising approach for the diagnosis of active tuberculosis (aTB) and for monitoring treatment success. We therefore studied phenotypic changes on MTB-specific CD4 T cells upon anti-tuberculosis treatment initiation in relation to the treatment response as determined by sputum culture. Methods: Peripheral blood mononuclear cells from subjects with latent MTB infection (n = 16) and aTB (n = 39) at baseline, weeks 9, 12, and 26 (end of treatment) were analyzed after intracellular interferon gamma staining and overnight stimulation with tuberculin. Liquid sputum cultures were performed weekly until week 12 and during 4 visits until week 26. Results: T cell activation marker expression on MTB-specific CD4 T cells differed significantly between subjects with aTB and latent MTB infection with no overlap for the frequencies of CD38pos and Ki67pos cells (both p < 0.0001). At 9 weeks after anti-TB treatment initiation the frequencies of activation marker (CD38, HLA-DR, Ki67) positive MTB-specific, but not total CD4 T cells, were significantly reduced (p < 0.0001). Treatment induced phenotypic changes from baseline until week 9 and until week 12 differed substantially between individual aTB patients and correlated with an individual's time to stable sputum culture conversion for expression of CD38 and HLA-DR (both p < 0.05). In contrast, the frequencies of maturation marker CD27 positive MTB-specific CD4 T cells remained largely unchanged until week 26 and significantly differed between subjects with treated TB disease and latent MTB infection (p = 0.0003). Discussion: Phenotypic changes of MTB-specific T cells are potential surrogate markers for tuberculosis treatment efficacy and can help to discriminate between aTB (profile: CD38pos, CD27low), treated TB (CD38neg, CD27low), and latent MTB infection (CD38neg, CD27high).

Keywords: Mycobacterium tuberculosis-specific T cells; TAM-TB assay; biomarker; serial sputum culture; treatment monitoring; tuberculosis.


Figures

Figure 1
Figure 1
Diagram of study subjects, time points and TAM-TB analyses. Peripheral blood mononuclear cell samples from aTB patients (n = 39) were collected at baseline, at week 9, 12, and 26 after TB treatment initiation and subjected to TAM-TB assay analyses. The numbers of missing samples and those excluded due to none responsiveness to the positive control antigen SEB (“poor quality”) are indicated for each time point. PBMC samples (n = 16) from HIV- IGRA+ subjects were collected during the HISIS cohort study.
Figure 2
Figure 2
Representative dot plots for phenotypic characterization of MTB-specific CD4 T cells. Shown are dot plots for active TB (A), 12 weeks into TB treatment (B) and Latent TB Infection (C). Dot plots are gated on CD4 T cells showing IFNγ (x-axis) and activation (CD38, HLA-DR, and Ki67) and maturation (CD27) marker staining (y-axis) without stimulation (upper panel) and after PPD stimulation (lower panel). IFNγ+ MTB-specific CD4 T cells are indicated (red box). The cut-off for the expression of each phenotypic marker is indicated as a black line.
Figure 3
Figure 3
Phenotypic profiles of MTB-specific CD4 T cells in subjects with aTB, after TB treatment initiation and during LTBI. The frequency of MTB-specific CD4 T cells expressing the activation markers CD38 (A), Ki67 (B), HLA-DR (C), and the maturation marker CD27 (D) is shown on the y-axis for pulmonary TB patients (purple circles) at baseline, 9, 12, and 26 weeks (x-axis) after TB treatment initiation. Subjects with latent MTB infection were included as controls (green diamonds). MTB-specific CD4 T cells were characterized after PPD stimulation. Statistical analyses were performed using the Mann-Whitney test. Median values, interquartile range and p-values below 0.05 are indicated.
Figure 4
Figure 4
Detection of dynamic changes in CD38 and HLA-DR expression upon TB treatment initiation on MTB-specific, but not total CD4 T cells. The frequency of T cells expressing the activation markers CD38 and HLA-DR (y-axis) are shown for MTB-specific CD4 T cells (A,B) and for total CD4 T cells (C,D) before and at 9 and 12 weeks after treatment for each subject. MTB-specific CD4 T cells were characterized after PPD stimulation. The slopes of the activation marker expression on MTB-specific and on total CD4 T cells were compared for CD38 (E) and HLA-DR (F) between baseline and week 9 (n = 29). Statistical analyses for paired data were performed using the Wilcoxon-signed rank paired test. None-paired data analyzed using the Mann-Whitney test. P-values below 0.05 are indicated.
Figure 5
Figure 5
SPICE analyses for in-depth phenotypic profiling of MTB-specific CD4 T cells. Shown are SPICE pie charts visualizing the mean frequency for each of the 16 possible phenotypic profiles of MTB-specific CD4 T cells. The arcs indicate the proportion of cells that express CD27 (red), CD38 (green), HLA-DR (light blue) and/or Ki67 (dark blue). The time point or LTBI infection status is indicated below each pie chart.
Figure 6
Figure 6
Correlation analysis of activation and maturation marker expression on MTB-specific CD4 T cells. The proportion of IFNγ+ MTB-specific CD4 T cells expressing activation and maturation markers after stimulation were plotted for CD38 and Ki67 (A), CD38 and HLA-DR (B), Ki67 and HLA-DR (C), CD38 and CD27 (D) on the y- and x-axis, respectively for samples from subjects with aTB from before and after treatment initiation (n = 109). The Spearman's rank test was used for statistical analysis.
Figure 7
Figure 7
Sequential MGIT culture results. Sequential MGIT culture results from 17 study visits from week 0 to week 26 (x-axis) are shown for each subject with a TAM-TB assay result from baseline and/or at week 9 and/or week12 (n = 32). The upper and lower line graphs indicate culture results from subjects with ≤ 4 (n = 15) and ≥4 weeks (n = 17) between the last positive and stable culture conversion, respectively. Red dots indicate a MTB positive culture result, green dots a negative culture result, and gray dots indicate a contaminated sample. Dark green squares indicate stable culture conversion defined as the first of two consecutive culture negative results. Dark red square*: last culture positive sample before 2 consecutive culture negative samples.
Figure 8
Figure 8
Changes in TAM expression profiles on MTB-specific CD4 T cells upon treatment initiation reflect declining bacterial burden in sputum. A correlation analysis between time to stable culture conversion and the slope of CD38 and HLA-DR marker expression dynamics on IFNγ+ MTB-specific CD4 T cells is shown for the time interval from baseline to week 12 (A,B, n = 15), and from baseline to week 9 (C,D, n = 13), respectively, for subjects with accurately defined time point of less than 5 weeks between the last positive MGIT culture result and stable culture conversion. The Spearman's rank test was used for statistical analysis.

References

    1. WHO. End TB Strategy: Global Strategy and Targets for Tuberculosis Prevention, Care and Control After 2015. Available online at: http://www.who.int/tb/post2015_strategy/en/ (Accessed on August 7, 2017).
    1. Schuetz A, Haule A, Reither K, Ngwenyama N, Rachow A, Meyerhans A, et al. . Monitoring CD27 expression to evaluate Mycobacterium tuberculosis activity in HIV-1 infected individuals in vivo. PLoS ONE (2011) 6:e27284. 10.1371/journal.pone.0027284 - DOI - PMC - PubMed
    1. Portevin D, Moukambi F, Clowes P, Bauer A, Chachage M, Ntinginya N, et al. . Assessment of the novel T-cell activation marker-tuberculosis assay for diagnosis of active tuberculosis in children: a prospective proof-of-concept study. Lancet Infect Dis. (2014) 14:931–8. 10.1016/S1473-3099(14)70884-9 - DOI - PubMed
    1. Nikitina IY, Kondratuk NA, Kosmiadi GA, Amansahedov RB, Vasilyeva IA, Ganusov VV, et al. . Mtb-specific CD27low CD4 T cells as markers of lung tissue destruction during pulmonary tuberculosis in humans. PLoS ONE (2012) 7:e43733. 10.1371/journal.pone.0043733 - DOI - PMC - PubMed
    1. Adekambi T, Ibegbu CC, Cagle S, Kalokhe AS, Wang YF, Hu Y, et al. Biomarkers on patient T cells diagnose active tuberculosis and monitor treatment response. J Clin Invest. (2015) 125:1827–38. 10.1172/JCI77990 - DOI - PMC - PubMed

Publication types

MeSH terms