. 2019 Feb;49(2):466-477.
doi: 10.1002/jmri.26213. Epub 2018 Oct 15.

Differential cerebral hemometabolic responses to blood transfusions in adults and children with sickle cell anemia

Affiliations

Differential cerebral hemometabolic responses to blood transfusions in adults and children with sickle cell anemia

Meher R Juttukonda et al. J Magn Reson Imaging. 2019 Feb.

Abstract

Background: Blood transfusions are administered to children and adults with sickle cell anemia (SCA) for secondary stroke prevention, or as treatment for recurrent pain crises or acute anemia, but transfusion effects on cerebral hemodynamics and metabolism are not well-characterized.

Purpose: To compare blood transfusion-induced changes in hemometabolic parameters, including oxygen extraction fraction (OEF) and cerebral blood flow (CBF), within and between adults and children with SCA.

Study type: Prospective, longitudinal study.

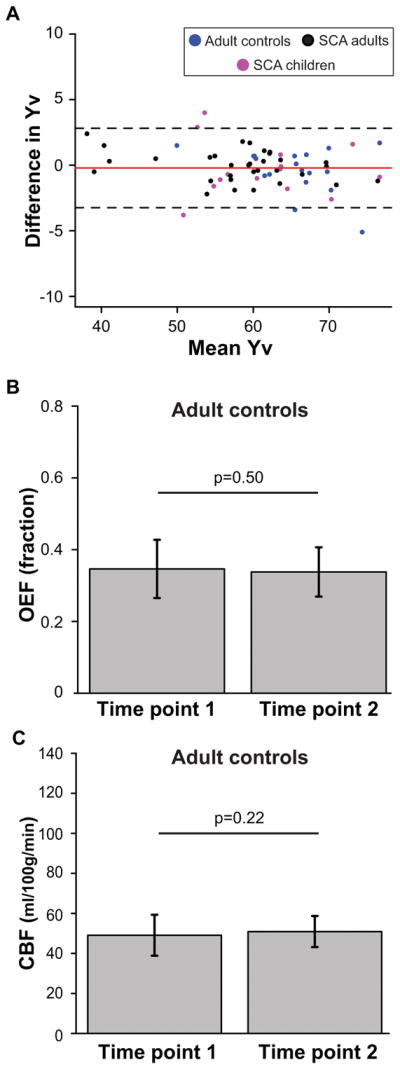
Subjects: Adults with SCA (n = 16) receiving simple (n = 7) or exchange (n = 9) transfusions and children with SCA (n = 11) receiving exchange transfusions were scanned once when hematocrit was near nadir and again within 7 days of transfusion. Adult controls without SCA or sickle trait (n = 7) were scanned twice on separate days.

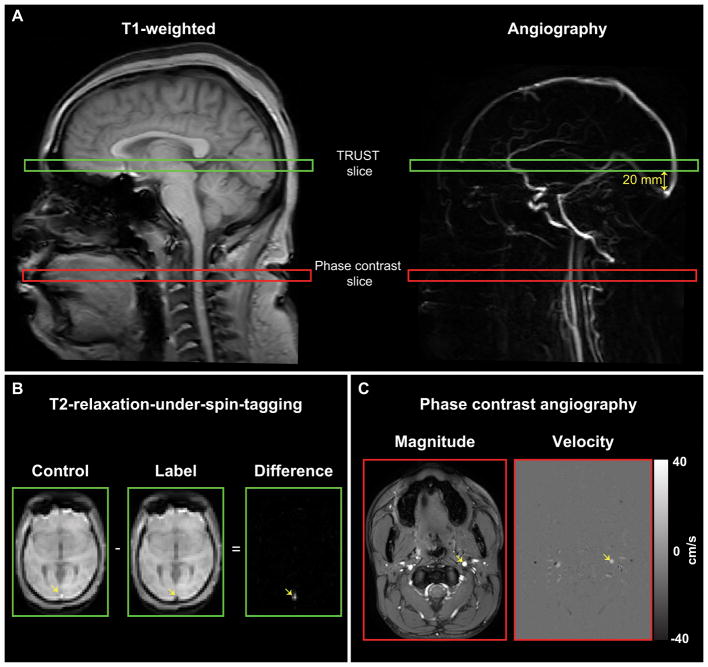
Field strength/sequence: 3.0T T1 -weighted, T2 -weighted, and T2 -relaxation-under-spin-tagging (TRUST) imaging, and phase contrast angiography.

Assessment: Global OEF was computed as the relative difference between venous oxygenation (from TRUST) and arterial oxygenation (from pulse oximetry). Global CBF was computed as total blood flow to the brain normalized by intracranial tissue volume.

Statistical tests: Hemometabolic variables were compared using two-sided Wilcoxon signed-rank tests; associations were analyzed using two-sided Spearman's correlation testing.

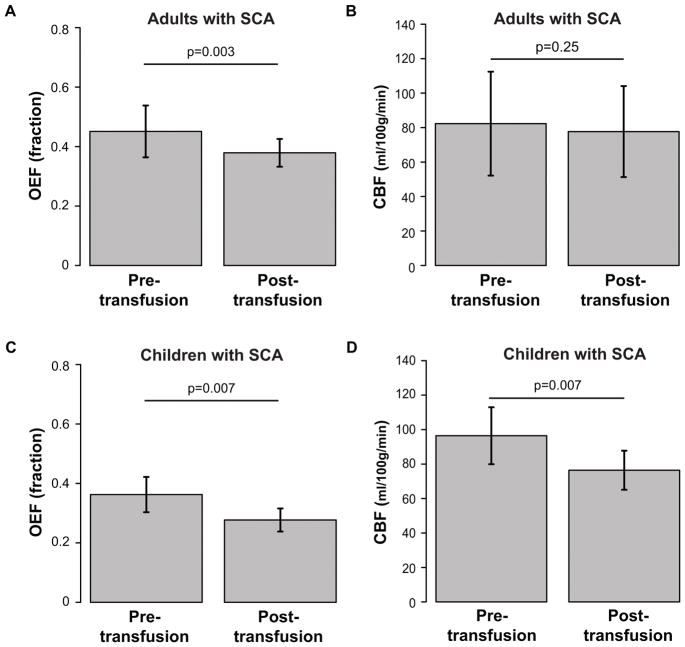
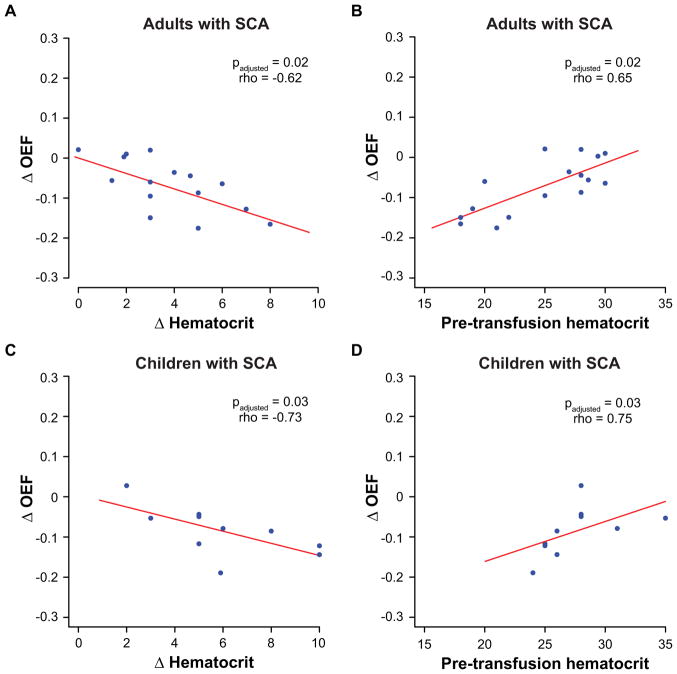
Results: In adults with SCA, posttransfusion OEF = 0.38 ± 0.05 was lower (P = 0.001) than pretransfusion OEF = 0.45 ± 0.09. A change in OEF was correlated with increases in hematocrit (P = 0.02; rho = -0.62) and with pretransfusion hematocrit (P = 0.02; rho = 0.65). OEF changes after transfusion were greater (P = 0.002) in adults receiving simple versus exchange transfusions. Posttransfusion CBF = 77.7 ± 26.4 ml/100g/min was not different (P = 0.27) from pretransfusion CBF = 82.3 ± 30.2 ml/100g/min. In children with SCA, both posttransfusion OEF = 0.28 ± 0.04 and CBF = 76.4 ± 26.4 were lower than pretransfusion OEF = 0.36 ± 0.06 (P = 0.004) and CBF = 96.4 ± 16.5 (P = 0.004).

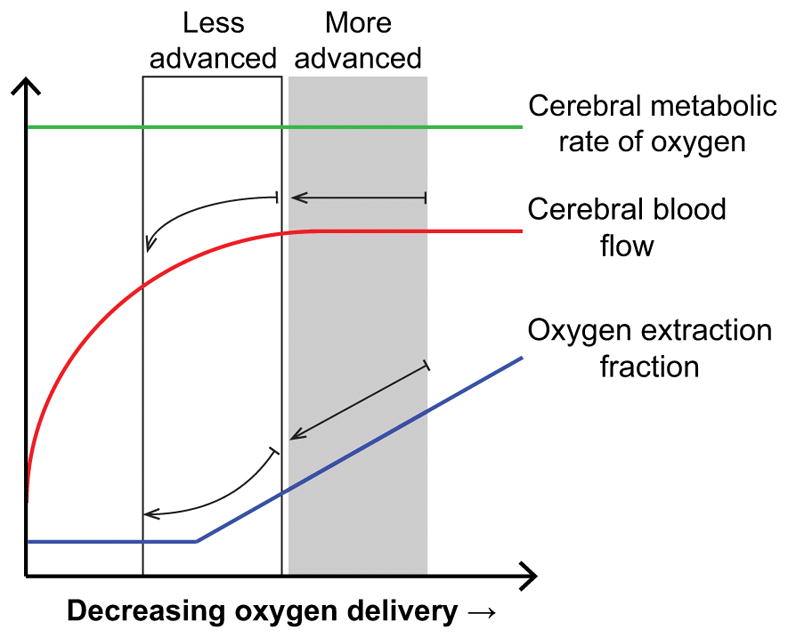
Data conclusion: Cerebral OEF reduces following transfusions in adults and children with SCA. CBF reduces following transfusions more often in children compared to adults, indicating that vascular reserve capacity may remain near exhaustion posttransfusion in many adults.

Level of evidence: 2 Technical Efficacy Stage 5 J. Magn. Reson. Imaging 2019;49:466-477.

Keywords: blood transfusion; cerebral blood flow; oxygen extraction fraction; phase contrast angiography; sickle cell anemia.


Figures

Figure 1
Figure 1. Physiological model
This schematic displays hypothesized behavior of cerebral metabolic rate of oxygen (CMRO2), cerebral blood flow (CBF), and oxygen extraction fraction (OEF) as hematocrit decreases in individuals with sickle cell anemia (SCA) based on models adapted from the arterial steno-occlusive disease literature (11,12). When autoregulatory increases in CBF are sufficient to compensate for anemia and reduced oxygen carrying capacity of blood, OEF is not expected to increase. In patients with SCA who cannot increase CBF sufficiently due to exhaustion of autoregulatory reserve capacity or arterial steno-occlusion, and who are in more advanced stages of disease, OEF will increase for unchanging CMRO2. Depending on the extent of impairment, small improvements in hematocrit following transfusion may produce variable changes in cerebral hemodynamics. In those who have less advanced disease (black box), both CBF and OEF are expected to reduce, while in those who have more advanced disease (gray box), transfusions will reduce OEF, but have little change on CBF.
Figure 2
Figure 2. Imaging methods
The locations of the T2-relaxation-under-spin-tagging (TRUST) and phase contrast (PC) imaging slices are shown overlaid on sagittal T1-weighted and angiographic images (A). The imaging slices for the TRUST sequence were oriented parallel to the anterior commissure/posterior commissure line and were located approximately 20 mm superior to the confluence of the sinuses. The slices for the PC imaging sequences were placed approximately at the location of the C2 vertebra and were orthogonal to the vessel of interest (as shown for the left internal carotid artery; ICA). Sample control and label images for the TRUST sequence are shown for one effective echo-time (eTE) (B). The superior sagittal sinus (yellow arrow) appears bright in the control image and dark in the label image. The subtracted signal between control and label pairs at four eTEs was used to calculate the venous oxygenation inside the sagittal sinus for oxygen extraction fraction (OEF) measurement. Sample magnitude and velocity images for the PC imaging sequence are shown for the left ICA (yellow arrows); positive velocity indicated inferior-to-superior flow direction and negative velocity indicated superior-to-inferior flow direction) (C). Each vessel was segmented, and the mean velocity and cross-sectional area of each vessel were used to calculate global cerebral blood flow (CBF).
Figure 3
Figure 3. Repeatability and temporal stability of OEF and CBF measurements
A Bland-Altman plot for repeatability analysis (repeats=2) for venous oxygen saturation (Yv), the key measurement to assess OEF, is shown here (A). Yv measurements are shown for adult controls (blue), adults with SCA (black), and children with SCA (purple) at two time points along with the mean (red) and 95% confidence intervals (black) of the difference. Bar graphs of mean global OEF (B) and CBF (C) measurements are shown at two time points. These analyses support that OEF measurements with TRUST are repeatable within a scan session; furthermore, OEF and CBF measurements are largely stable over time in healthy adults who did not receive interventions affecting cerebral hemodynamics.
Figure 4
Figure 4. Physiological changes
Bar graphs of mean oxygen extraction fraction (OEF; left) and cerebral blood flow (CBF; right) are shown in adults with SCA (top) and children with SCA (bottom) from pre- and post-transfusion scans. Error bars represent one standard deviation. OEF significantly (n=16; p<0.001) reduces post-transfusion compared to pre-transfusion in adults with SCA (n=16; p=0.003) (A) and in children with SCA (n=10; p=0.007) (C); CBF remains unchanged on average in adults with SCA (n=14; p=0.25) (B) but significantly reduces post-transfusion in children with SCA (n=10; p=0.007) (D).
Figure 5
Figure 5. Associations with hematologic variables
Scatter plots are shown comparing the change in oxygen extraction fraction (OEF) (post-pre) versus change in hematocrit (A) and pre-transfusion hematocrit (B) in adults with SCA (top); similar plots comparing change in OEF in versus change in hematocrit (C) and pre-transfusion hematocrit (D) are also shown for children with SCA (bottom). Spearman’s correlation testing was performed, and the appropriate p- and rho-values are reported for each comparison after correction for false discovery rate. Lines-of-best-fit (red) are shown for each comparison simply as an aid to visualize the direction (direct or inverse) of the trends between variables. In adults with SCA (n=16), the change in OEF is significantly associated with the change in hematocrit and with pre-transfusion hematocrit; these correlations are also seen in children with SCA (n=10).
Figure 6
Figure 6. Transfusion type
Box plots of the change in OEF (A) and CBF (B) are shown for adults with SCA receiving simple transfusions and exchange transfusions. Changes in OEF following transfusion were significantly (p=0.002) greater in those receiving simple transfusions (n=7) versus those receiving exchange transfusions (n=9) (A). No such differences were observed in CBF between adults with SCA receiving simple transfusions (n=6) and exchange transfusions (n=8) (B).

References

    1. Kassim AA, DeBaun MR. Sickle cell disease, vasculopathy, and therapeutics. Annu Rev Med. 2013;64:451–466. - PubMed
    1. Seakins M, Gibbs WN, Milner PF, Bertles JF. Erythrocyte Hb-S concentration. An important factor in the low oxygen affinity of blood in sickle cell anemia. J Clin Invest. 1973;52(2):422–432. - PMC - PubMed
    1. Arkuszewski M, Krejza J, Chen R, Melhem ER. Sickle cell anemia: reference values of cerebral blood flow determined by continuous arterial spin labeling MRI. Neuroradiol J. 2013;26(2):191–200. - PMC - PubMed
    1. Debaun MR, Derdeyn CP, McKinstry RC., 3rd Etiology of strokes in children with sickle cell anemia. Ment Retard Dev Disabil Res Rev. 2006;12(3):192–199. - PubMed
    1. Strouse JJ, Lanzkron S, Urrutia V. The epidemiology, evaluation and treatment of stroke in adults with sickle cell disease. Expert Rev Hematol. 2011;4(6):597–606. - PMC - PubMed

MeSH terms