. 2018 Oct 16:7:e36426.
doi: 10.7554/eLife.36426.

The Aquilegia genome provides insight into adaptive radiation and reveals an extraordinarily polymorphic chromosome with a unique history

Affiliations

The Aquilegia genome provides insight into adaptive radiation and reveals an extraordinarily polymorphic chromosome with a unique history

Danièle L Filiault et al. Elife. .

Abstract

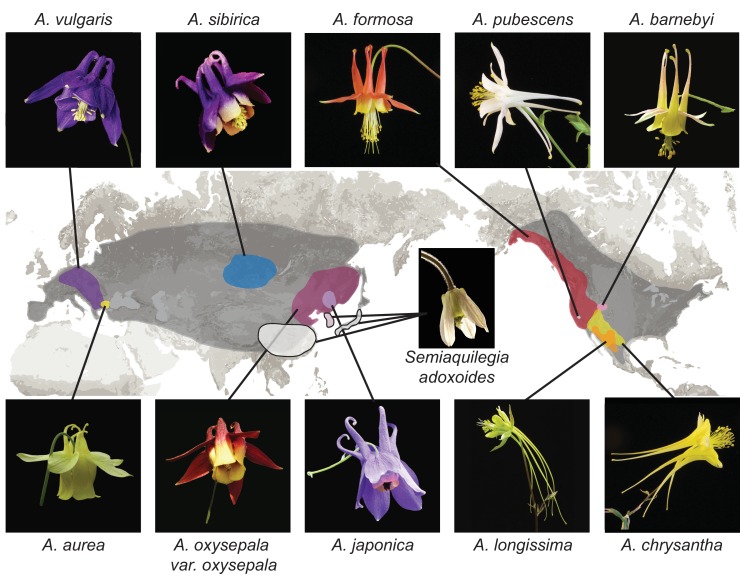
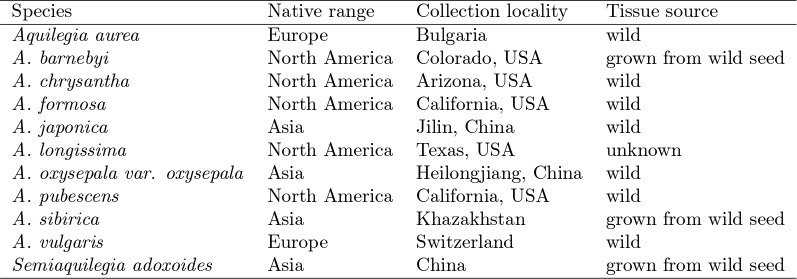
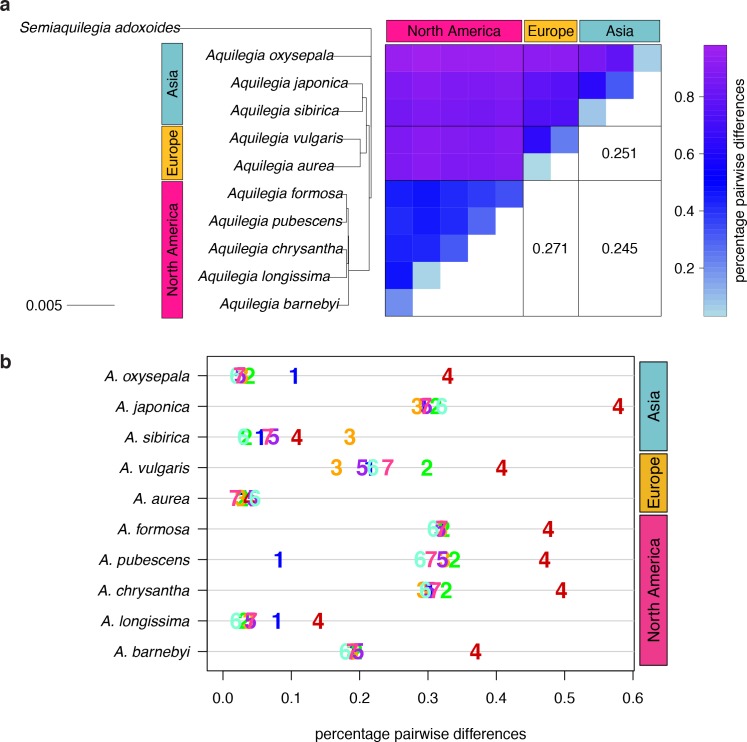
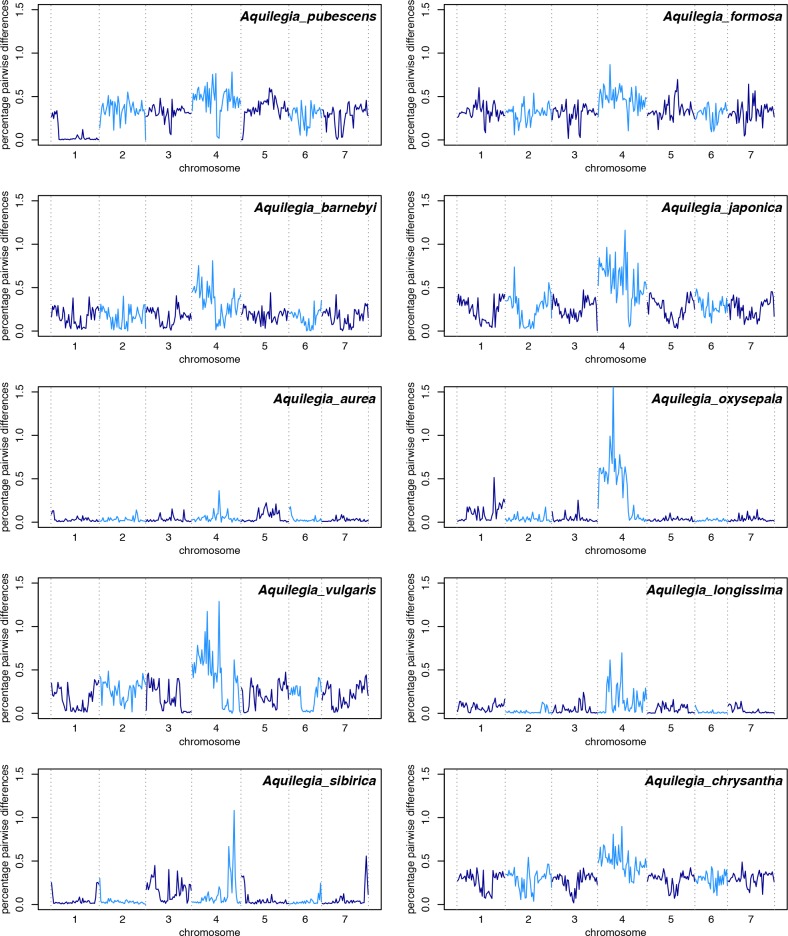
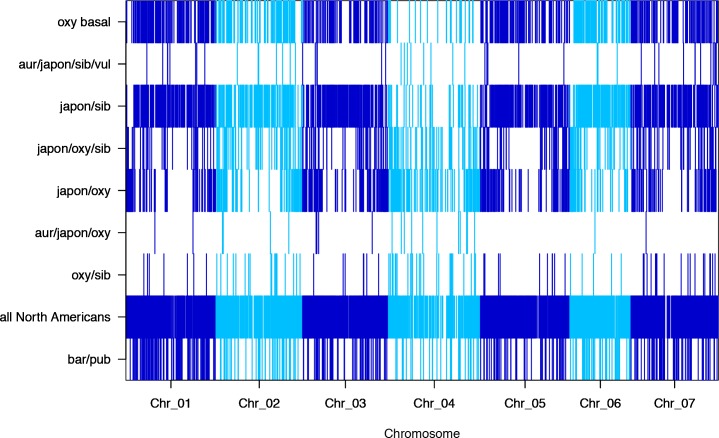
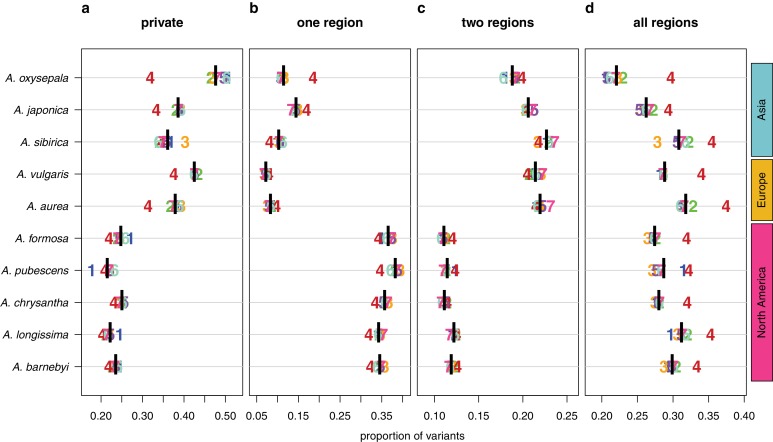
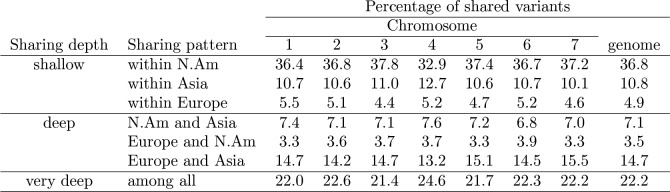
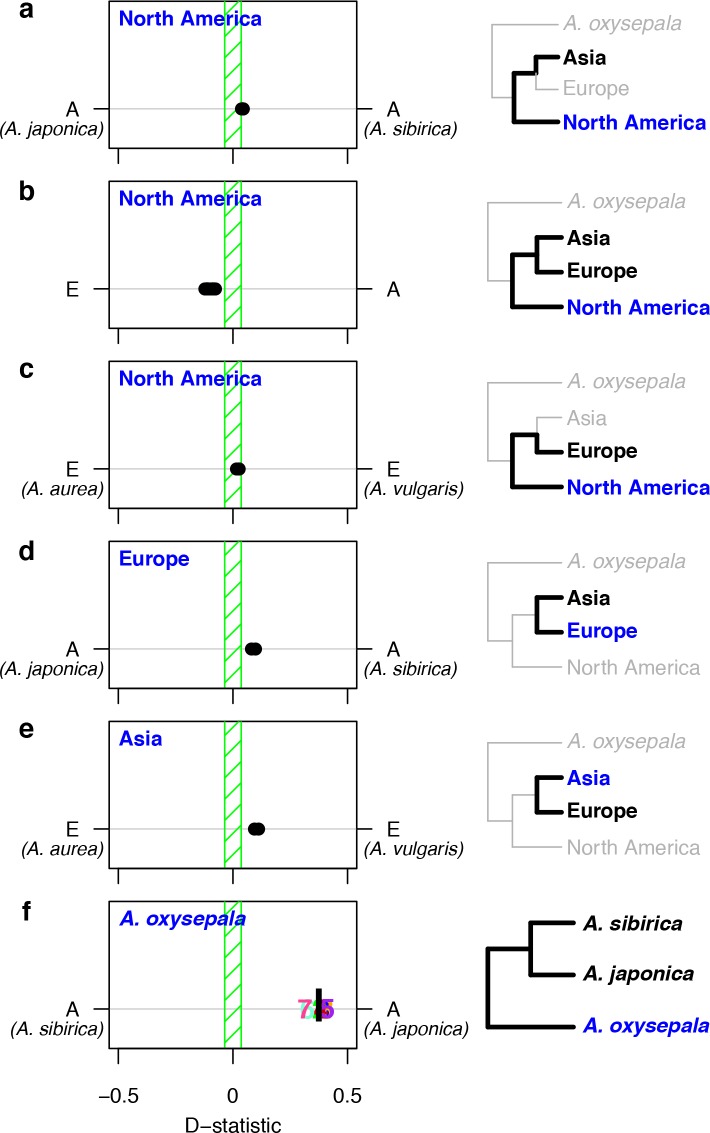
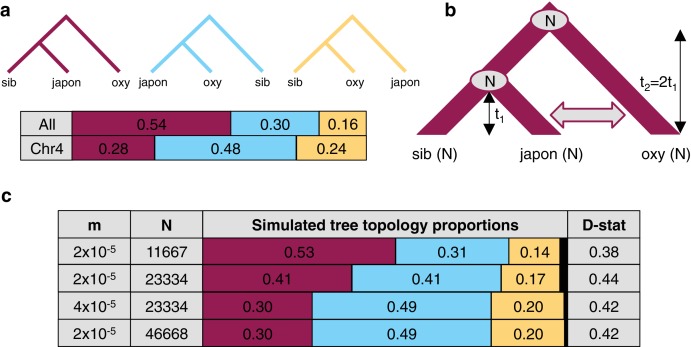
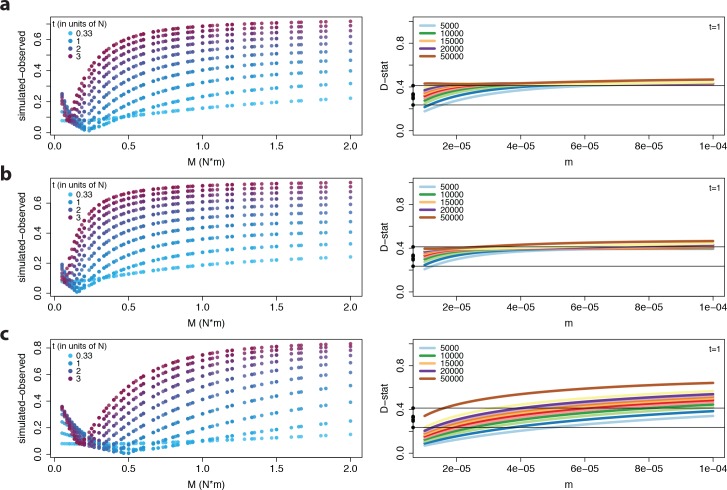
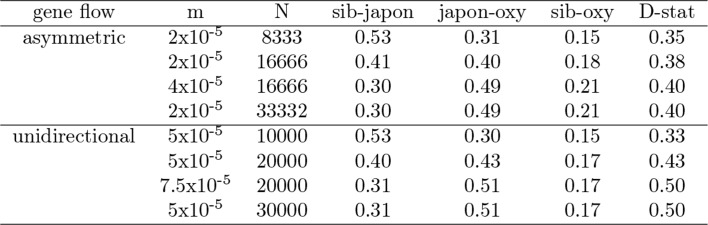
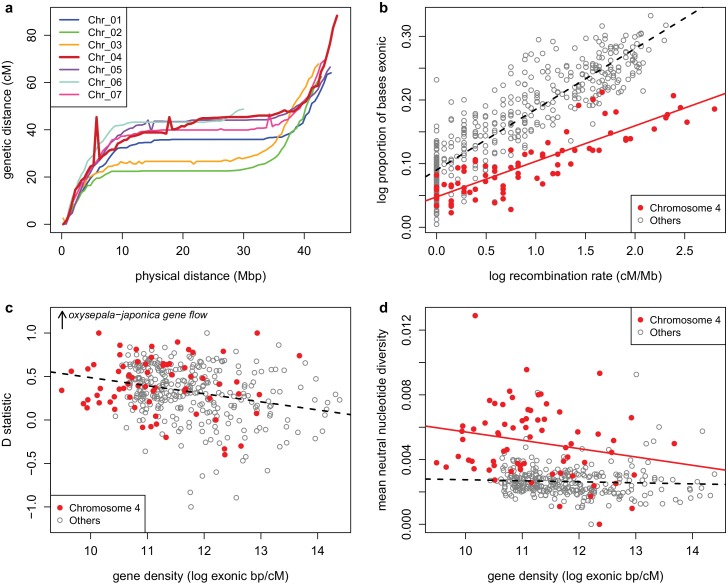
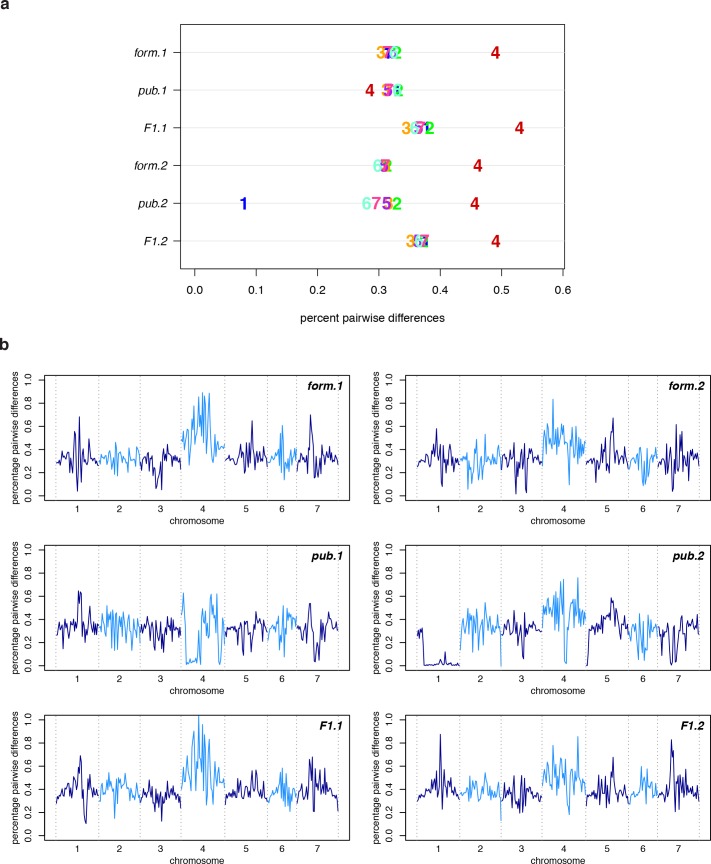
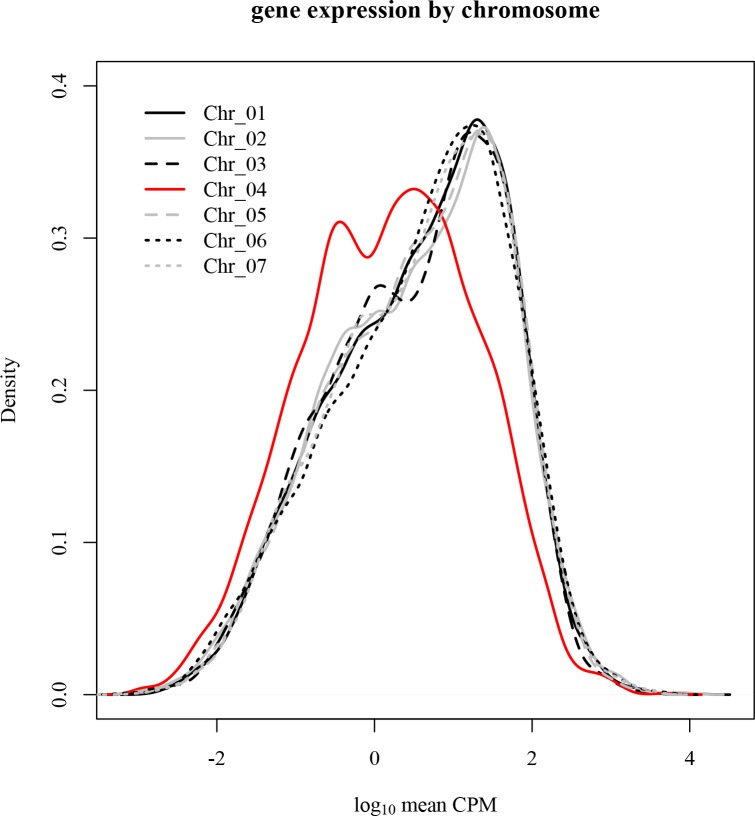
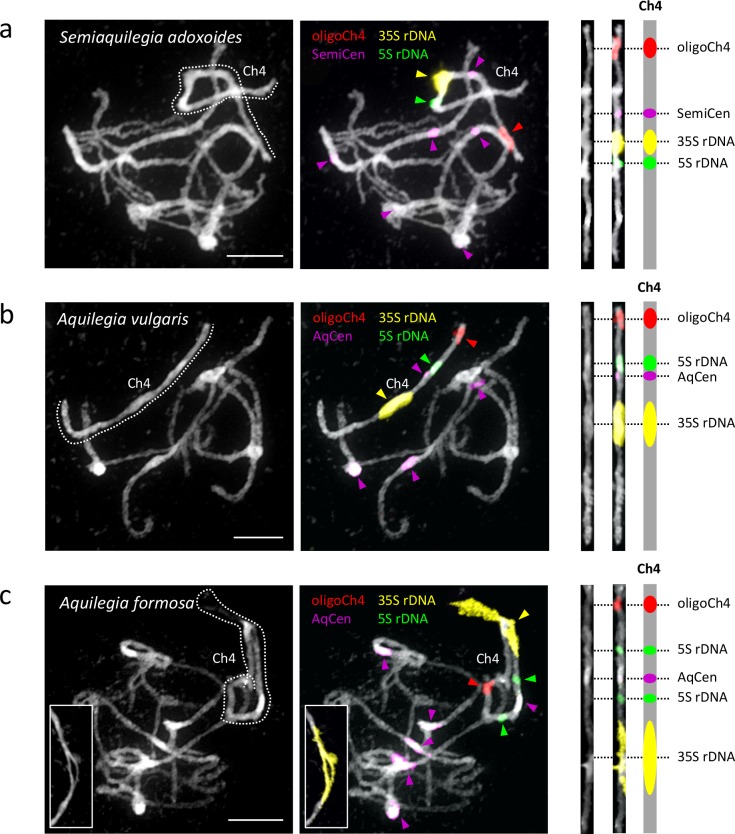
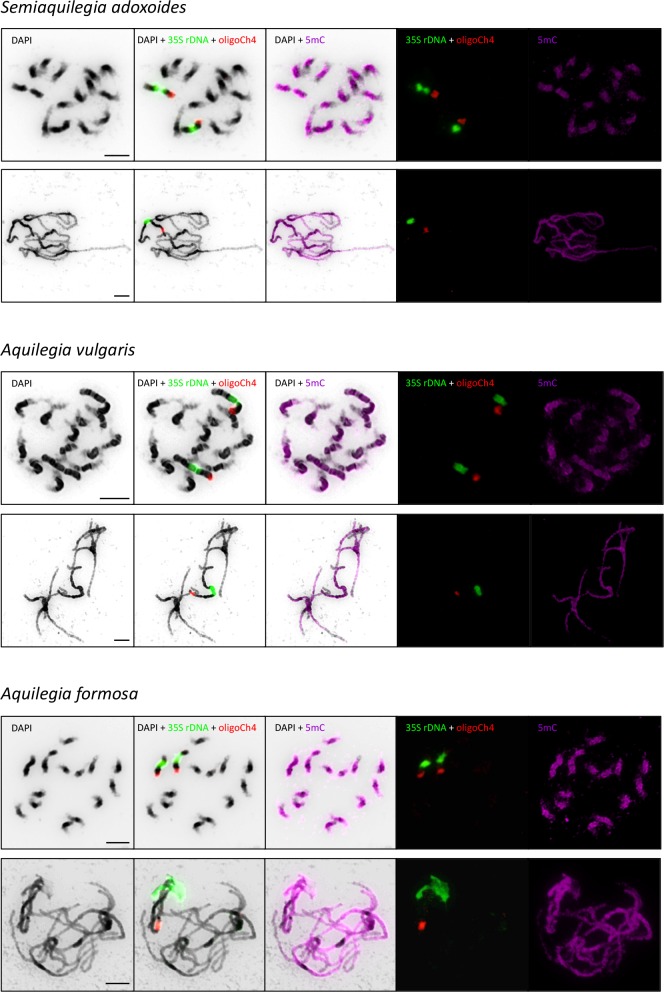
The columbine genus Aquilegia is a classic example of an adaptive radiation, involving a wide variety of pollinators and habitats. Here we present the genome assembly of A. coerulea 'Goldsmith', complemented by high-coverage sequencing data from 10 wild species covering the world-wide distribution. Our analyses reveal extensive allele sharing among species and demonstrate that introgression and selection played a role in the Aquilegia radiation. We also present the remarkable discovery that the evolutionary history of an entire chromosome differs from that of the rest of the genome - a phenomenon that we do not fully understand, but which highlights the need to consider chromosomes in an evolutionary context.

Keywords: Aquilegia; chromosome evolution; chromosomes; gene expression; genetics; genome evolution; genomics; population genetics; speciation.


Conflict of interest statement

DF, EB, TM, GA, ND, JS, JJ, JG, SS, RH, UH, KB, JY, SM, MK, VN, EK, ML, SH No competing interests declared, MN Reviewing editor, eLife

Figures

Figure 1.
Figure 1.. Distribution of Aquilegia species.
There are ~70 species in the genus Aquilegia, broadly distributed across temperate regions of the Northern Hemisphere (grey). The 10 Aquilegia species sequenced here were chosen as representatives spanning this geographic distribution as well as the diversity in ecological habitat and pollinator-influenced floral morphology of the genus. Semiaquilegia adoxoides, generally thought to be the sister taxon to Aquilegia (Fior et al., 2013), was also sequenced. A representative photo of each species is shown and is linked to its approximate distribution.
Figure 1—figure supplement 1.
Figure 1—figure supplement 1.. Origin of species samples used for sequencing.
Figure 2.
Figure 2.. Polymorphism and divergence in Aquilegia.
(a) The percentage of pairwise differences within each species (estimated from individual heterozygosity) and between species (divergence). FST values between geographic regions are given on the lower half of the pairwise differences heatmap. Both heatmap axes are ordered according to the neighbor joining tree to the left. This tree was constructed from a concatenated data set of reliably-called genomic positions. (b) Polymorphism within each sample by chromosome. Per-chromosome values are indicated by the chromosome number.
Figure 2—figure supplement 1.
Figure 2—figure supplement 1.. Polymorphism across the genome in all ten species samples.
Figure 2—figure supplement 2.
Figure 2—figure supplement 2.. Species and chromosome trees of Aquilegia.
Figure 3.
Figure 3.. Discordance between gene and species trees.
(a) Cloudogram of neighbor joining (NJ) trees constructed in 100 kb windows across the genome. The topology of each window-based tree is co-plotted in grey and the whole genome NJ tree shown in Figure 2a is superimposed in black. Blue numbers indicate the percentage of window trees that contain each of the subtrees observed in the whole genome tree. (b) Genome NJ tree topology. Blue letters a-c on the tree denote subtrees a-c in panel (d). (c) Chromosome four NJ tree topology. Blue letters d and e on the tree denote subtrees d and e in panel (d). (d) Prevalence of each subtree that varied significantly by chromosome. Genomic (black bar) and per chromosome (chromosome number) values are given.
Figure 3—figure supplement 1.
Figure 3—figure supplement 1.. Proportion of significantly-varying subtrees by chromosome.
Figure 3—figure supplement 2.
Figure 3—figure supplement 2.. P-values of proportion tests by chromosome for significantly-different trees.
Figure 3—figure supplement 3.
Figure 3—figure supplement 3.. Subtree prevalence across chromosomes for the nine significantly-different subtrees.
Figure 4.
Figure 4.. Sharing patterns of derived polymorphisms.
Proportion of derived variants (a) private to an individual species, (b) shared within the geographic region of origin, (c) shared across two geographic regions, and (d) shared across all three geographic regions. Genomic (black bar) and chromosome (chromosome number) values, for all 10 species.
Figure 4—figure supplement 1.
Figure 4—figure supplement 1.. Sharing pattern percentages by pattern type.
Figure 5.
Figure 5.. D statistics demonstrate gene flow during Aquilegia speciation.
D statistics for tests with (a–c) all North American species, (d) both European species, (e) Asian species other than A. oxysepala, and (f) A. oxysepala as H3 species. All tests use S. adoxoides as the outgroup. D statistics outside the green shaded areas are significantly different from zero. In (a–e), each individual dot represents the D statistic for a test done with a unique species combination. In (f), D statistics are presented by chromosome (chromosome number) or by the genome-wide value (black bar). In all panels, E = European and A = Asian without A. oxysepala. In some cases, individual species names are given when the geographical region designation consists of a single species. Right hand panels are a graphical representation of the D statistic tests in the corresponding left hand panels. Trees are a simplified version of the genome tree topology (Figure 2b), in which the bold sub tree(s) represent the bifurcation considered in each set of tests. H3 species are noted in blue while the H1 and H2 species are specified in black. (Figure 5—source data 1).
Figure 6.
Figure 6.. The effect of differences in coalescence time and gene flow on tree topologies.
(a) The observed proportion of informative derived variants supporting each possible Asian tree topology genome-wide and on chromosome four. Species considered include A. oxysepala (oxy), A. japonica (japon), and A. sibirica (sib). (b) The coalescent model with bidirectional gene flow in which A. oxysepala diverges first at time t2, but later hybridizes with A. japonica between t = 0 and t1 at a rate determined by per-generation migration rate, m. The population size (N) remains constant at all times. (c) The proportion of each tree topology and estimated D statistic for simulations using four combinations of m and Nvalues (t1 = 1 in units of N generations). The combination presented in the first row (m = 2x10⁻⁵ and N = 11667) generates tree topology proportions that match observed allele sharing proportions genomewide. Simulations with increased m and/or N (rows 3–4) result in proportions which more closely resemble those observed for chromosome four. Colors in proportion plots refer to tree topologies in (a), with black bars representing the residual probability of seeing no coalescence event. While this simulation assumes symmetric gene flow, similar results were seen for models incorporating both unidirectional and asymmetric gene flow (Figure 6—figure supplements 1 and 2).
Figure 6—figure supplement 1.
Figure 6—figure supplement 1.. Model output for all three gene flow scenarios.
Figure 6—figure supplement 2.
Figure 6—figure supplement 2.. Tree topology proportions simulated under assymmetric and unidirectional models.
Figure 7.
Figure 7.. Recombination and selection on chromosome four (a) Physical vs.
genetic distance for all chromosomes calculated in an A. formosa x A. pubescens mapping population. High nucleotide diversity on chromosome four was also observed in parental plants of this population (Figure 7—figure supplement 1. (b) Relationship between gene density (proportion exonic) and recombination rate (main effect p-value < 2 x 10-16, chromosome four effect p-value < 2 x 10-16, interaction p-value < 1.936 x 10⁻¹¹, adjusted R2 = 0.8045). (c) Relationship between gene density and D statistic for A. oxysepala and A. japonica gene flow. (d) Relationship between gene density and mean neutral nucleotide diversity. Figure 7—source data 1.
Figure 7—figure supplement 1.
Figure 7—figure supplement 1.. Polymorphism in the A. formosa x A. pubescens mapping population.
Figure 7—figure supplement 2.
Figure 7—figure supplement 2.. Distribution of gene expression values by chromosome.
Figure 8.
Figure 8.. Cytogenetic characterization of chromosome four in Semiaquilegia and Aquilegia species.
Pachytene chromosome spreads were probed with probes corresponding to oligoCh4 (red), 35S rDNA (yellow), 5S rDNA (green) and two (peri)centromeric tandem repeats (pink). Chromosomes were counterstained with DAPI. Scale bars = 10 μm.
Figure 8—figure supplement 1.
Figure 8—figure supplement 1.. Immunodetection of anti-5mC antibody.

References

    1. Aköz G, Nordborg M. Genome duplication and reorganization in Aquilegia. bioRxiv. 2018 doi: 10.1101/407973~. - DOI
    1. Avise JC, Robinson TJ. Hemiplasy: a new term in the lexicon of phylogenetics. Systematic Biology. 2008;57:503–507. doi: 10.1080/10635150802164587. - DOI - PubMed
    1. Bastida JM, Alcántara JM, Rey PJ, Vargas P, Herrera CM. Extended phylogeny of Aquilegia: the biogeographical and ecological patterns of two simultaneous but contrasting radiations. Plant Systematics and Evolution. 2010;284:171–185. doi: 10.1007/s00606-009-0243-z. - DOI
    1. Baym M, Kryazhimskiy S, Lieberman TD, Chung H, Desai MM, Kishony R. Inexpensive multiplexed library preparation for megabase-sized genomes. Plos One. 2015;10:e0128036. doi: 10.1371/journal.pone.0128036. - DOI - PMC - PubMed
    1. Bennett MD, Smith JB, Heslop-Harrison JS. Nuclear DNA amounts in angiosperms. Proceedings of the Royal Society B: Biological Sciences. 1982;216:179–199. doi: 10.1098/rspb.1982.0069. - DOI - PubMed

Publication types