Review
. 2018 Oct 15;19(10):3173.
doi: 10.3390/ijms19103173.

Exploring Protein⁻Protein Interaction in the Study of Hormone-Dependent Cancers

Affiliations
Review

Exploring Protein⁻Protein Interaction in the Study of Hormone-Dependent Cancers

Yasuhiro Miki et al. Int J Mol Sci. .

Abstract

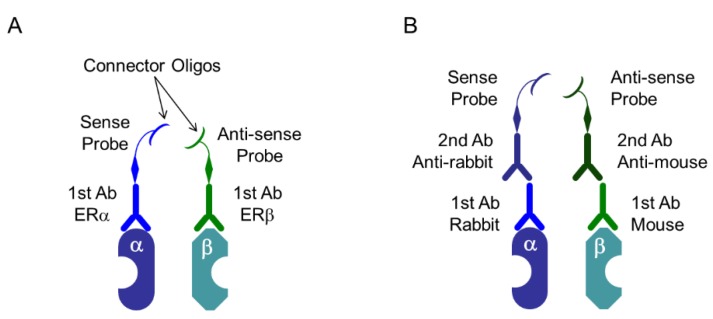
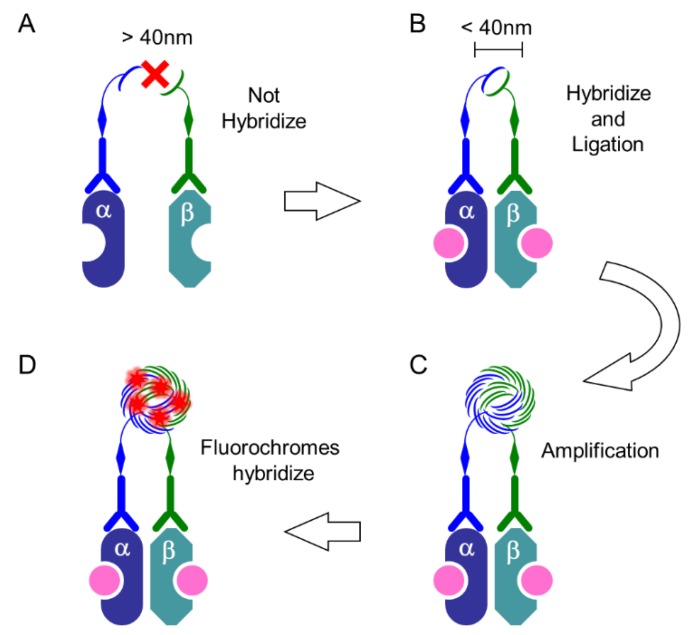
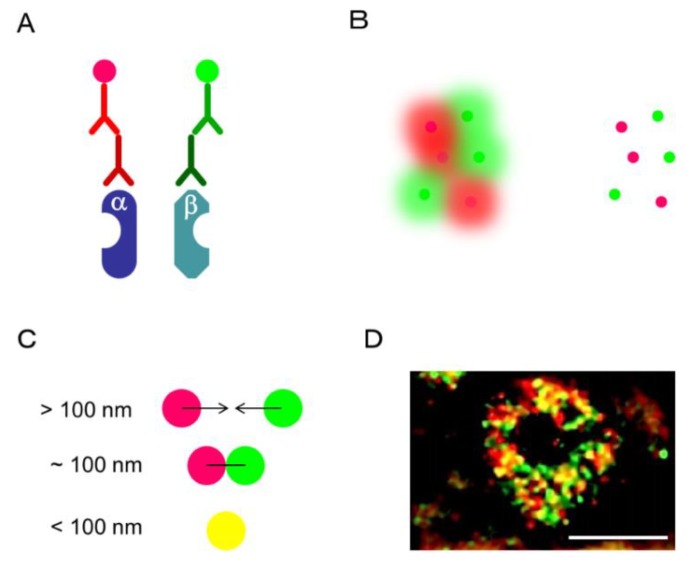
Estrogen receptors promote target gene transcription when they form a dimer, in which two identical (homodimer) or different (heterodimer) proteins are bound to each other. In hormone-dependent cancers, hormone receptor dimerization plays pivotal roles, not only in the pathogenesis or development of the tumors, but also in the development of therapeutic resistance. Protein⁻protein interactions (PPIs), including dimerization and complex formation, have been also well-known to be required for proteins to exert their functions. The methods which could detect PPIs are genetic engineering (i.e., resonance energy transfer) and/or antibody technology (i.e., co-immunoprecipitation) using cultured cells. In addition, visualization of the target proteins in tissues can be performed using antigen⁻antibody reactions, as in immunohistochemistry. Furthermore, development of microscopic techniques (i.e., electron microscopy and confocal laser microscopy) has made it possible to visualize intracellular and/or intranuclear organelles. We have recently reported the visualization of estrogen receptor dimers in breast cancer tissues by using the in situ proximity ligation assay (PLA). PLA was developed along the lines of antibody technology development, and this assay has made it possible to visualize PPIs in archival tissue specimens. Localization of PPI in organelles has also become possible using super-resolution microscopes exceeding the resolution limit of conventional microscopes. Therefore, in this review, we summarize the methodologies used for studying PPIs in both cells and tissues, and review the recently reported studies on PPIs of hormones.

Keywords: bioluminescence resonance energy transfer/förster resonance energy transfer; co-immunoprecipitation; estrogen receptor; immunohistochemistry; in situ proximity ligation assay; protein–protein interaction; super-resolution microscopy.


Conflict of interest statement

The authors declare no conflict of interest.

Figures

Figure 1
Figure 1
Prediction using the STRING database (https://string-db.org/). (A) ESR1 protein (ERα) interaction on confidence prediction. AKT1, V-akt murine thymoma viral oncogene homolog 1; CCND1, Cyclin D1; IGF1R, Insulin-like growth factor 1 receptor; NRIP1, Nuclear receptor interacting protein 1; JUN, Jun proto-oncogene; SRC, V-src sarcoma (Schmidt-Ruppin A-2) viral oncogene homolog (avian); NCOA, Nuclear receptor coactivator; NCOR1, Nuclear receptor corepressor 1. (B) ESR2 protein (ERβ) interaction on confidence prediction. MAPK11, Mitogen-activated protein kinase 11; NR0B1, Nuclear receptor subfamily 0, group B, member 1; DDX54, DEAD (Asp-Glu-Ala-Asp) box polypeptide 54; FOS, FBJ murine osteosarcoma viral oncogene homolog; NOS3, Nitric oxide synthase 3 (endothelial cell); NCOA, Nuclear receptor coactivator; MED1, Mediator complex subunit 1; NR0B2, Nuclear receptor subfamily 0, group B, member 2.
Figure 2
Figure 2
Immunohistochemistry of biomarker proteins used for pathological diagnosis of breast cancer subtypes. Immunostaining for ERα (A); progesterone receptor (B); and HER2 (C) was performed using autostainer, Ventana Benchmark ULUTRA staining system (Roche). Immunoreactivities of ERα and progesterone receptor were detected in the nucleus of breast carcinoma cells. HER2 was detected in cell membranes of breast carcinoma cells. Top photographs are of a lower magnification (scale bar, 200 μm), and bottom photographs are of a higher magnification (scale bar, 50 μm).
Figure 3
Figure 3
Immunohistochemistry of steroid hormone receptors in hormone-dependent cancers. (A) Expression of ERα in endometrial carcinoma tissue; (B) Expression of androgen receptor (AR) in endometrial carcinoma tissue. AR was detected in both carcinoma cells and stromal cells (arrow heads) in this case; (C) Expression of ERβ in non-pathological epithelia of prostate tissue; (D) Expression of ERβ5 in breast carcinoma tissue. Top photographs are of a lower magnification (scale bar, 200 μm), and bottom photographs are of a higher magnification (scale bar, 100 μm).
Figure 4
Figure 4
Immunoelectron microscopy. (A) Expression of chemokine receptor (CXCR, arrow heads) on the membrane of lymphocytes aggregated in colitis. Left photograph is at low magnification, and right is at high magnification (scale bar, 1 μm). Gold colloid conjugated antibody for CXCR, and the signal was amplified by the silver nanoparticles. Asterisks indicate nuclei of lymphocytes; (B) Secretion of 5-hydroxytryptamine (arrow heads) from gastric cancer cells. Colloidal Gold Conjugated secondary antibody was employed (scale bar, 0.5 μm). The asterisk indicates nucleus of gastric carcinoma cell.
Figure 5
Figure 5
Proximity ligation assay (PLA) system: specific probes. (A) Specific primary antibodies (1st Ab) are linked to special oligonucleotide probes, that are sense and antisense oligos named as PLUS oligo and MINUS oligo, respectively. In this case, primary antibodies derived from both, same and different species can be used; (B) PLUS oligo and MINUS oligo link to secondary antibodies (2nd Ab) derived from mouse, rabbit, or goat, and it depends on the species of the primary antibodies. In this case, primary antibodies derived from different species should be used. In this Scheme, as an example, heterodimer of ERα and ERβ are depicted.
Figure 6
Figure 6
PLA system: procedure. (A) When the distance between two targets is more than 40 nm, PLUS oligo and MINUS oligo, which is linked to primary or secondary antibodies, cannot hybridize with each other; (B) When these probes are present at less than 40 nm, they hybridize and then ligate to form a circle; (C) The DNA circle undergoes several hundredfold replication by the rolling-circle amplification (RCA) reaction; (D) The fluorescently labeled oligonucleotides will hybridize to the RCA product. In this Scheme, as an example, heterodimer of ERα and ERβ induced by estrogen-binding (pink) are depicted.
Figure 7
Figure 7
Detection of ERα homodimer in MCF-7 cells by in situ PLA. The cells were grown on cover slides. After fixation with 4% paraformaldehyde, cells were permeabilized using 0.1% Triton-X-100. (A) A few PLA signals (red dots) were detected in vehicle (dimethyl sulfoxide)-treated cells as a control. Antibodies for ERα were obtained from rabbit monoclonal antibody SP-1 (Abcam, Cambridge, UK) and mouse monoclonal antibody 6F11 (Leica Biosystems, Wetzlar, Germany); (B) When estradiol (10 nM) was used for treatment, PLA signals (red dots or clusters) significantly increased. Nuclei were stained blue (DAPI). PLA signals were red (Texas red). Top photographs are of a lower magnification, and bottom photographs are of a higher magnification. Scale bar, 10 μm.
Figure 8
Figure 8
Detection of ERα homodimer in breast carcinoma tissue by in situ PLA. Formalin-fixed paraffin-embedded (FFPE) samples were used for pathological diagnosis. ERα antibodies, SP-1 and 6F11 were employed. Both cases with low- (A) and high-PLA score (B) were demonstrated. PLA signals (red dots) were detected in the nucleus of breast carcinoma cells. Nuclei were stained blue (DAPI). PLA signals were stained red (Texas red). Top photographs are of a lower magnification, and bottom photographs are of a higher magnification. Scale bar, 20 μm.
Figure 9
Figure 9
SIM analysis. In this case, ERα homodimer was detected. ERα antibodies, rabbit monoclonal SP-1 and mouse monoclonal 6F11 were employed. (A) Secondary antibodies were labeled with Alexa Fluor 594 (Red) and Alexa Fluor 488 (Green), respectively. (B) In conventional fluorescence microscopy (Left), the fluorescence signal from the entire molecule in the sample is simultaneously detected, and the fluorescence from each molecule overlaps. In SIM analysis, fluorescence from only a small part of the fluorescent molecule is detected, making it possible to determine the exact position of the molecule [93]. (C) When the two molecules are located at 100 nm or more, they can be recognized as red and green fluorescence, respectively. When two molecules are close to each other (<100 nm), they can be visualized with a marginal yellow fluorescence. (D) Intranuclear localization of ERα in MCF-7 was observed by N-structured illumination microscopy (SIM). Scale bar, 5 μm.

References

    1. Kumar S., Nussinov R. Close-range electrostatic interactions in proteins. ChemBioChem. 2002;3:604–617. doi: 10.1002/1439-7633(20020703)3:7<604::AID-CBIC604>3.0.CO;2-X. - DOI - PubMed
    1. Lowenstein E.J., Daly R.J., Batzer A.G., Li W., Margolis B., Lammers R., Ullrich A., Skolnik E.Y., Bar-Sagi D., Schlessinger J. The SH2 and SH3 domain-containing protein GRB2 links receptor tyrosine kinases to ras signaling. Cell. 1992;70:431–442. doi: 10.1016/0092-8674(92)90167-B. - DOI - PubMed
    1. Rozakis-Adcock M., McGlade J., Mbamalu G., Pelicci G., Daly R., Li W., Batzer A., Thomas S., Brugge J., Pelicci P.G., et al. Association of the Shc and Grb2/Sem5 SH2-containing proteins is implicated in activation of the Ras pathway by tyrosine kinases. Nature. 1992;360:689–692. doi: 10.1038/360689a0. - DOI - PubMed
    1. Huang F., Khvorova A., Marshall W., Sorkin A. Analysis of clathrin-mediated endocytosis of epidermal growth factor receptor by RNA interference. J. Biol. Chem. 2004;279:16657–16661. doi: 10.1074/jbc.C400046200. - DOI - PubMed
    1. Jorissen R.N., Walker F., Pouliot N., Garrett T.P., Ward C.W., Burgess A.W. Epidermal growth factor receptor: Mechanisms of activation and signalling. Exp. Cell Res. 2003;284:31–53. doi: 10.1016/S0014-4827(02)00098-8. - DOI - PubMed