. 2018 Oct 16;18(1):239.
doi: 10.1186/s12870-018-1453-8.

Cellulose synthase-like D1 controls organ size in maize

Affiliations

Cellulose synthase-like D1 controls organ size in maize

Weiya Li et al. BMC Plant Biol. .

Abstract

Background: Plant architecture is a critical factor that affects planting density and, consequently, grain yield in maize. The genes or loci that determine organ size are the key regulators of plant architecture. Thus, understanding the genetic and molecular mechanisms of organ size will inform the use of a molecular manipulation approach to improve maize plant architecture and grain yield.

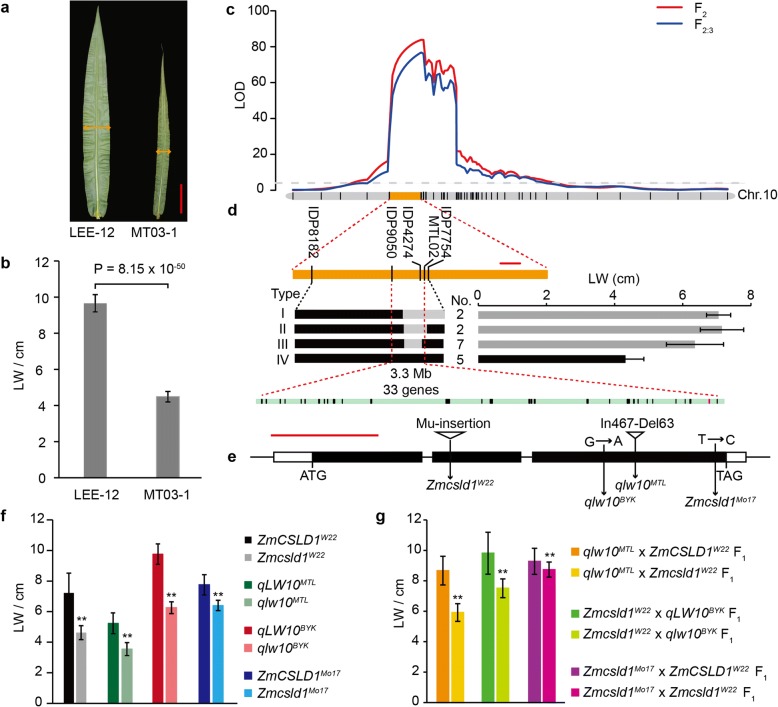
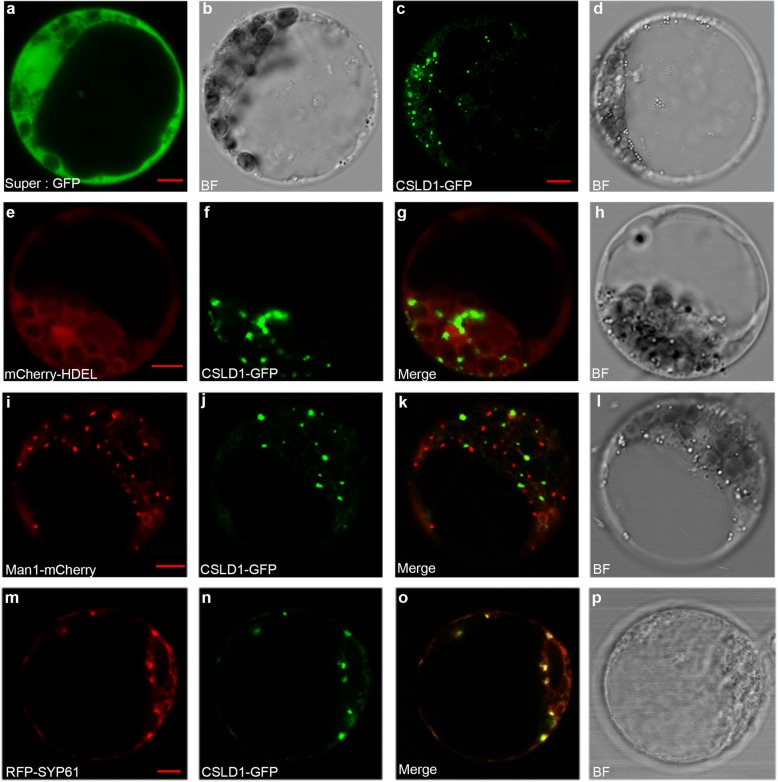
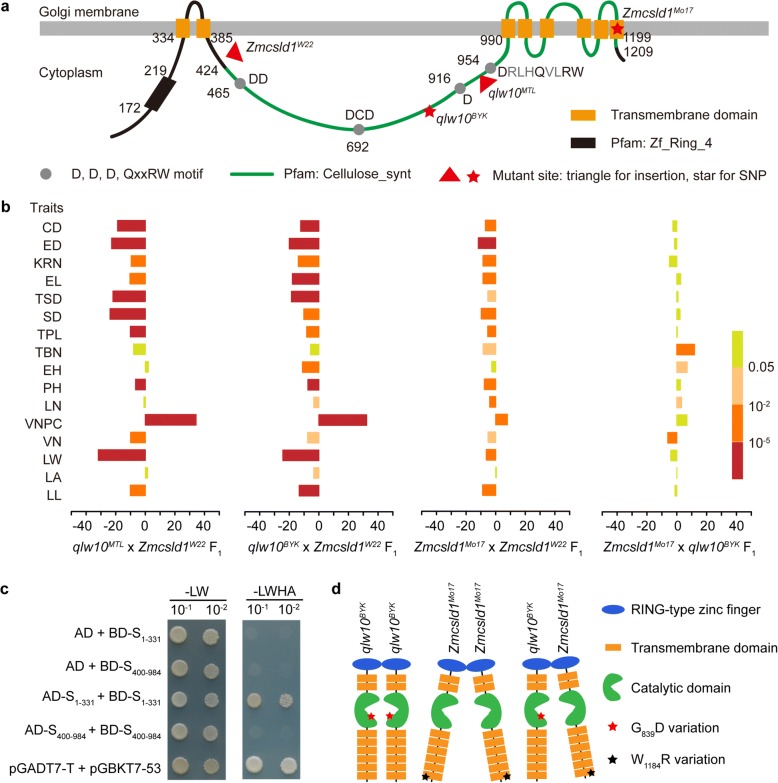
Results: A total of 18 unique quantitative trait loci (QTLs) were identified for 11 agronomic traits in the F2 and F2:3 segregating populations derived from a cross between a double haploid line with a small plant architecture (MT03-1) and an inbred line with a large plant architecture (LEE-12). Subsequently, we showed that one QTL, qLW10, for multiple agronomic traits that relate to plant organ size reflects allelic variation in ZmCSLD1, which encodes a cellulose synthase-like D protein. ZmCSLD1 was localized to the trans-Golgi and was highly expressed in the rapidly growing regions. The loss of ZmCSLD1 function decreased cell division, which resulted in smaller organs with fewer cell numbers and, in turn, pleiotropic effects on multiple agronomic traits. In addition, intragenic complementation was investigated for two Zmcsld1 alleles with nonsynonymous SNPs in different functional domains, and the mechanism of this complementation was determined to be through homodimeric interactions.

Conclusions: Through positional cloning by using two populations and allelism tests, qLW10 for organ size was resolved to be a cellulose synthase-like D family gene, ZmCSLD1. ZmCSLD1 has pleiotropic effects on multiple agronomic traits that alter plant organ size by changing the process of cell division. These findings provide new insight into the regulatory mechanism that underlies plant organ development.

Keywords: Organ size; Pleiotropic effects and intragenic complementation; QTL; ZmCSLD1.


Conflict of interest statement

Ethics approval and consent to participate

Not applicable.

Consent for publication

Not applicable.

Competing interests

The authors declare that they have no competing interests.

Publisher’s Note

Springer Nature remains neutral with regard to jurisdictional claims in published maps and institutional affiliations.

Figures

Fig. 1
Fig. 1
QTLs for 11 agronomic traits identified in the LEE-12 × MT03-1 F2 and F2:3 segregating populations. a Chromosomal distribution of QTLs for the 11 traits. The outermost circle represents the distribution of QTLs identified in the F2 population, and the innermost circle represents the distribution of QTLs identified in the F2:3 population. The circle beneath the scale represents the genetic position on the linkage map. b Pearson correlation among different traits. The lower left indicates the correlation coefficient in the F2 population, the upper right indicates the correlation coefficient in the F2:3 population, and the diagonal is the correlation coefficient of the same trait between F2 and F2:3. The abbreviations and detailed descriptions of the 11 traits are listed in Additional file 2: Table S2
Fig. 2
Fig. 2
Positional cloning of qLW10 by using LEE-12 × MT03-1 segregating populations. a Mature ear leaf of the parents MT03-1 and LEE-12. Scale bar = 10 cm. b Statistical analysis of the LW between MT03-1 and LEE-12. c LOD profile of qLW10, which was identified in the F2 and F2:3 populations. d qLW10 was mapped to a 3.3-Mb genomic DNA region between the markers IDP9050 and MTL02 by using 3,292 BC2F1 and 669 BC3F1 plants. The numbers (Num) and LW are shown for the recombinant plants (I–III) and the non-recombinant plants (IV). The black and grey bars represent the chromosomal segments for the homozygous MT03-1 and heterozygous alleles, respectively. The data are shown as the mean ± SD. Scale bar = 2 Mb. e Four allelic variations in the candidate gene ZmCSLD1; the insertions (triangles) and point mutations are shown. Scale bar = 1 kb. fg LW in the lines with four pairs of allelic samples (f) and three pairs of F1 hybrids (g). The data are shown as the mean ± SD (n = 30). **P < 0.01 (Student’s t-test)
Fig. 3
Fig. 3
Subcellular localization of ZmCSLD1. ab Empty Super:GFP vector expression observed by fluorescence (a) and bright-field (b; BF) microscopy. cd CSLD1-GFP fusion protein expression. eh The co-expression of the ER marker mCherry-HDEL and the CSLD1-GFP fusion protein (f), Merge (g) and BF (h) are shown. il The co-expression of the cis-Golgi marker Man1-mCherry (i) and the CSLD1-GFP fusion protein (j), Merge (k) and BF (l) are shown. mp The co-expression of the trans-Golgi marker RFP-SYP61 (m) and the CSLD1-GFP fusion protein (n), Merge (q) and BF (p) are shown. Scale bar = 5 μm
Fig. 4
Fig. 4
ZmCSLD1 regulates plant architecture, and the effects of ZmCSLD1 vary among different alleles. a Schematic diagram of the domains and the location of causative alleles in Zmcsld1. The protein domains were predicted according to the descriptions of Zeng and Keegstra [92] and Hunter et al. [36]. b The pleiotropic effects of Zmcsld1 by comparing four Zmcsld1-combined F1 hybrids with their ZmCSLD1-combined F1 hybrids, respectively. The significance levels of the differences analysed by Student’s t-test (n = 30) are indicated in different colours. Traits abbreviations are listed in Additional file 2: Table S2. c Yeast two-hybrid system showing the interactions between AD-S1-331 and BD-S1-331. pGADT7-T/pGBKT7-53 was used as a positive control. d Schematic diagram of the intragenic complementation between qlw10BYK and Zmcsld1Mo17
Fig. 5
Fig. 5
ZmCSLD1 regulates LW by cell division. a Comparison of LW and length between qLW10MTL and qlw10MTL of the six unfolded leaves (L2–7) from 40-day-old seedlings. b, c Comparison of the abaxial epidermal surface cells of the fourth middle leaf blade from 40-day-old seedlings. Fifty normal cells per plant were measured by ImageJ for the average cell width and length (b), and the number of cells in the lateral and longitudinal axis (c) of the leaf blades was estimated by dividing the average LW by the cell width and the average LL by the cell length, respectively. The data are shown as the mean ± SD (n = 30). **P < 0.01 (Student’s t-test)
Fig. 6
Fig. 6
Expression patterns of ZmCSLD1 and CycB1;4 in root, shoot and leaf tissues in qLW10MTL and qlw10MTL. ab Positions of primary roots and shoot from 5-day-old seedlings (a) and the third leaf tissue from 10-day-old seedlings (b), which are indicated by white frame, were sampled for expression analysis. Scale bar = 2 cm. cd Relative expression of ZmCSLD1 (c) and CycB1;4 (d) in eight tissues corresponding to (a) and (b) in qLW10MTL and qlw10MTL were detected by qRT-PCR, data are shown as the mean ± SE (n = 3)

References

    1. Duvick DN. The contribution of breeding to yield advances in maize (Zea mays L.) Adv Agron. 2005;86:83–145. doi: 10.1016/S0065-2113(05)86002-X. - DOI
    1. Fischer K, Edmeades G, Johnson E. Recurrent selection for reduced tassel branch number and reduced leaf area density above the ear in tropical maize populations. Crop Sci. 1987;27:1150–1156. doi: 10.2135/cropsci1987.0011183X002700060013x. - DOI
    1. Johnson E, Fischer K, Edmeades G, Palmer A. Recurrent selection for reduced plant height in lowland tropical maize. Crop Sci. 1986;26:253–260. doi: 10.2135/cropsci1986.0011183X002600020008x. - DOI
    1. Schuetz SH, Mock JJ. Genetics of tassel branch number in maize and its implications for a selection program for small tassel size. Theor Appl Genet. 1978;53:265–271. - PubMed
    1. Johnson K, Lenhard M. Genetic control of plant organ growth. New Phytol. 2011;191:319–333. doi: 10.1111/j.1469-8137.2011.03737.x. - DOI - PubMed

LinkOut - more resources