. 2019 Jan 15;25(2):698-709.
doi: 10.1158/1078-0432.CCR-18-1728. Epub 2018 Oct 16.

Antibody-based Delivery of TNF to the Tumor Neovasculature Potentiates the Therapeutic Activity of a Peptide Anticancer Vaccine

Affiliations

Antibody-based Delivery of TNF to the Tumor Neovasculature Potentiates the Therapeutic Activity of a Peptide Anticancer Vaccine

Philipp Probst et al. Clin Cancer Res. .

Abstract

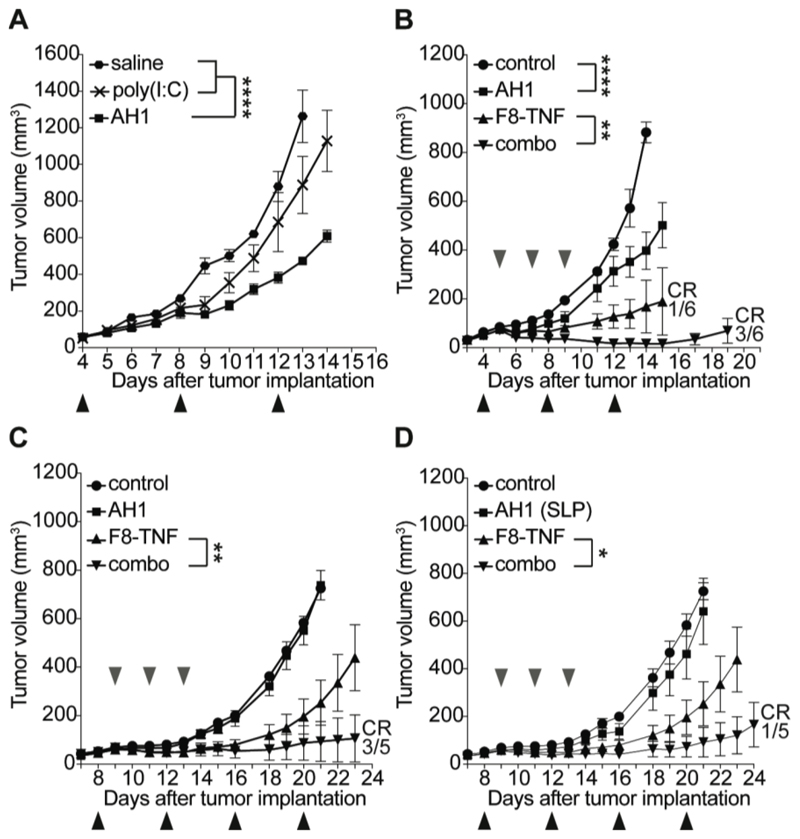
Purpose: There is a growing interest in the use of tumor antigens for therapeutic vaccination strategies. Unfortunately, in most cases, the use of peptide vaccines in patients does not mediate shrinkage of solid tumor masses.Experimental Design: Here, we studied the opportunity to boost peptide vaccination with F8-TNF, an antibody fusion protein that selectively delivers TNF to the tumor extracellular matrix. AH1, a model antigen to investigate CD8+ T-cell immunity in BALB/c mice, was used as vaccine.

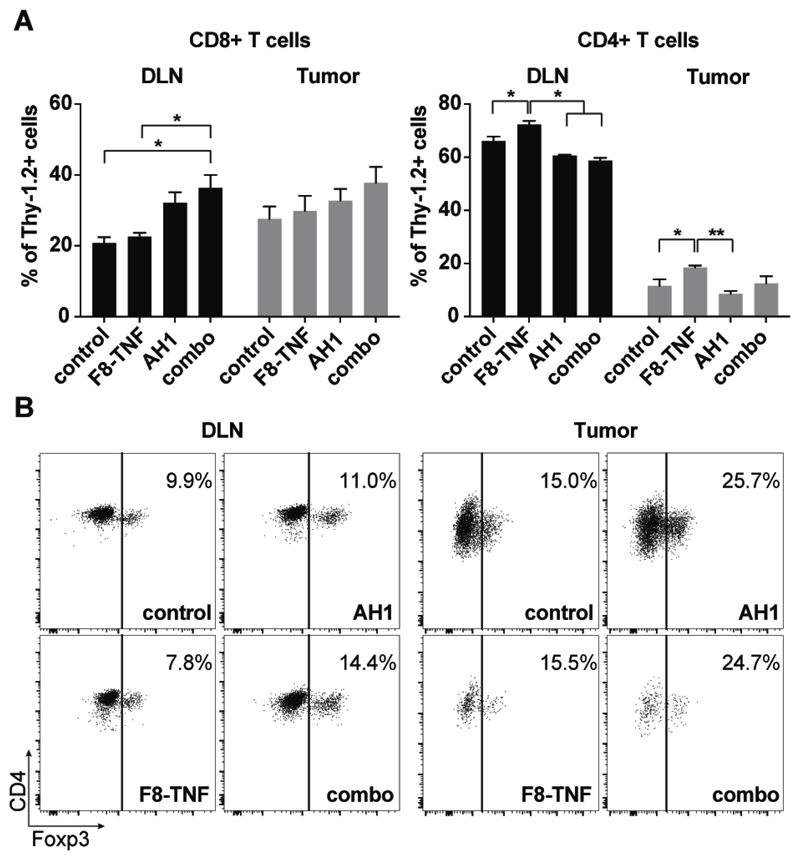
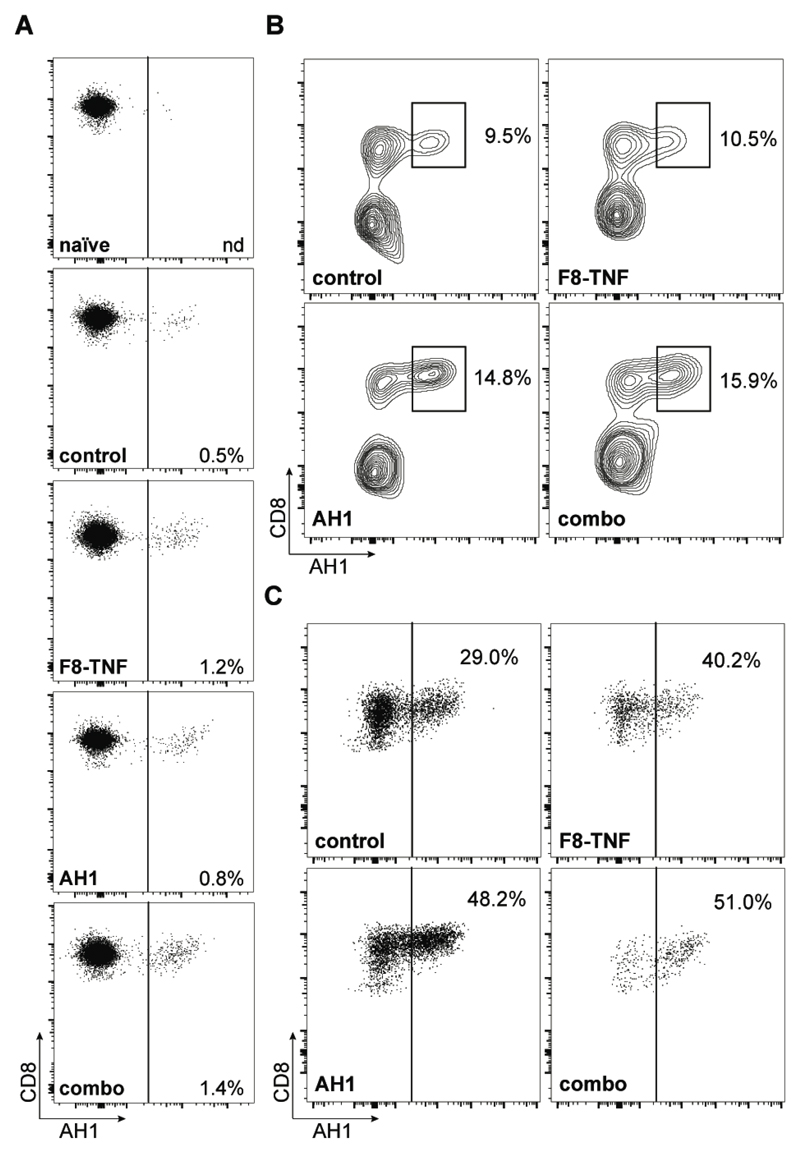
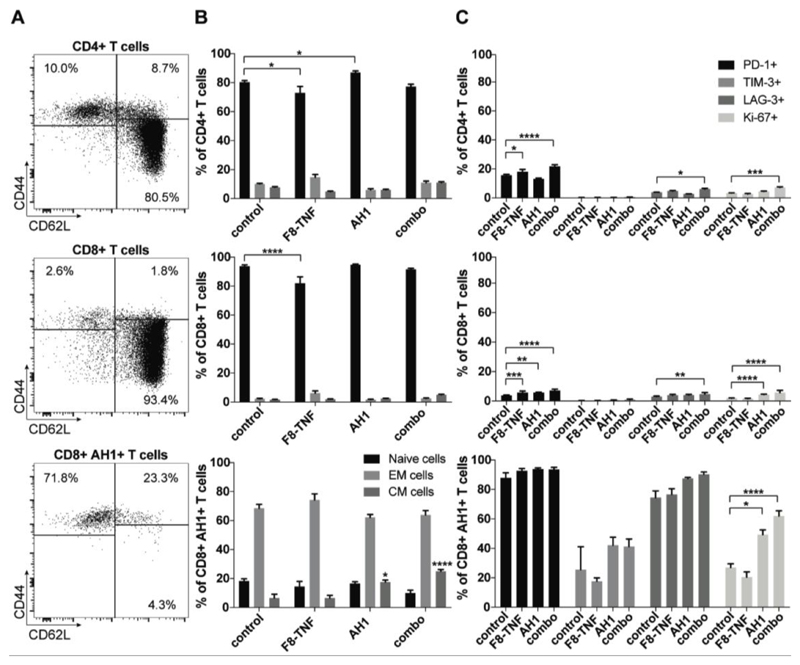
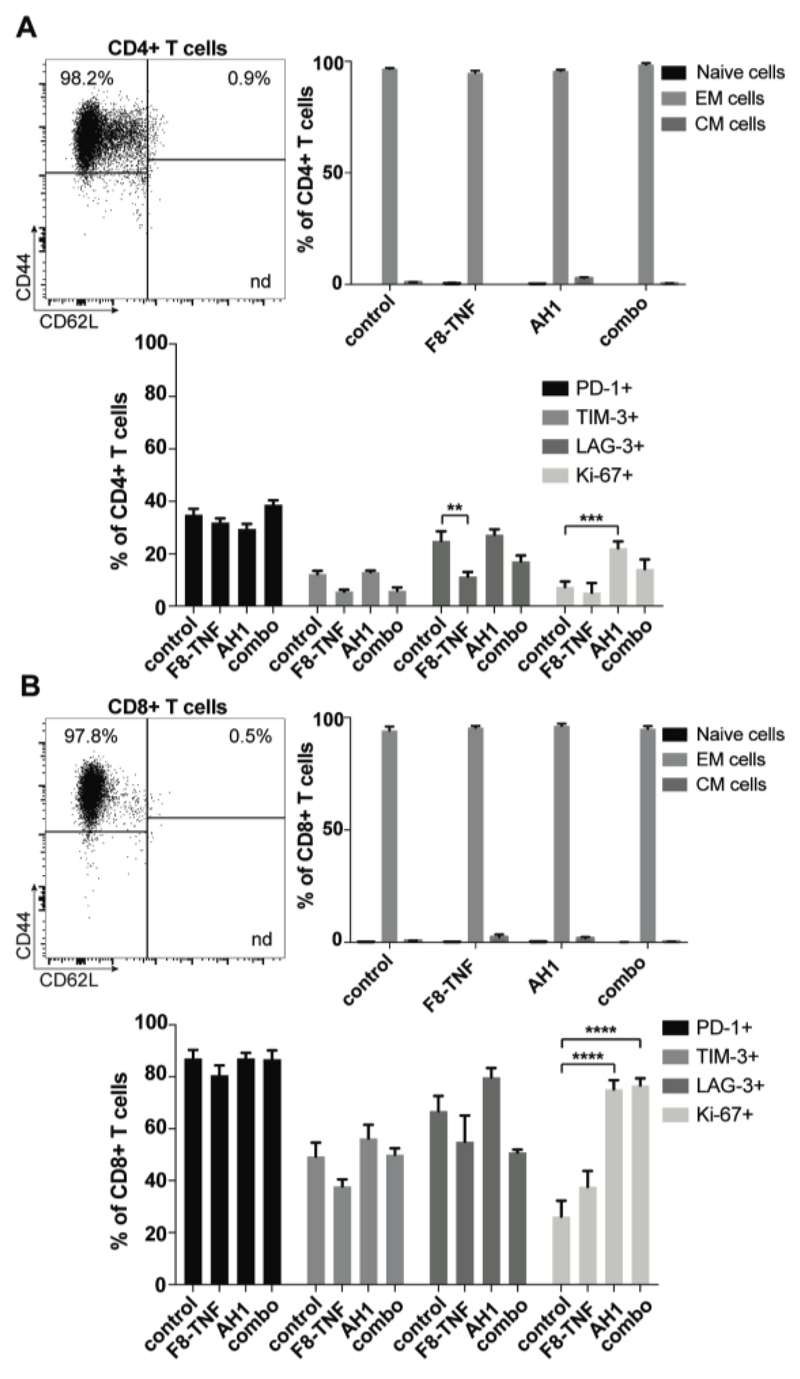
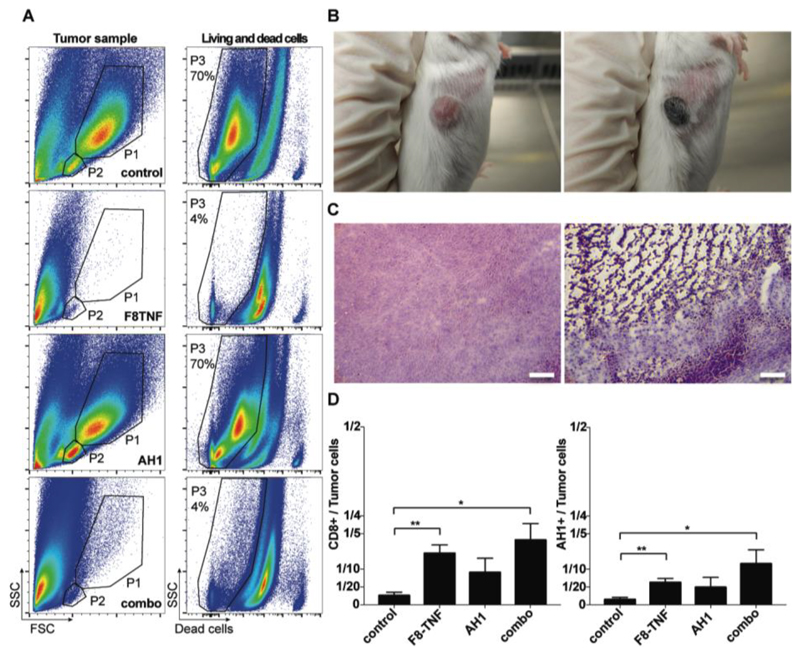
Results: Peptide antigens alone exhibited only a modest tumor growth inhibition. However, anticancer activity could be substantially increased by combination with F8-TNF. Analysis of T cells in tumors and in draining lymph nodes revealed a dramatic expansion of AH1-specific CD8+ T cells, which were strongly positive for PD-1, LAG-3, and TIM-3. The synergistic anticancer activity, observed in the combined use of peptide vaccination and F8-TNF, was largely due to the ability of the fusion protein to induce a rapid hemorrhagic necrosis in the tumor mass, thus leaving few residual tumor cells. While the cell surface phenotype of tumor-infiltrating CD8+ T cells did not substantially change upon treatment, the proportion of AH1-specific T cells was strongly increased in the combination therapy group, reaching more than 50% of the CD8+ T cells within the tumor mass.

Conclusions: Because both peptide vaccination strategies and tumor-homing TNF fusion proteins are currently being studied in clinical trials, our study provides a rationale for the combination of these 2 regimens for the treatment of patients with cancer.


Conflict of interest statement

Conflict of interest disclosure: D.N. is co-founder and shareholder of Philogen, a biotech company that owns the F8 antibody. T.F. and D.R. are employees of Philochem AG. The authors have no additional financial interests.

Figures

Figure 1
Figure 1. Therapeutic activity of AH1 vaccination in tumor-bearing mice.
A, Mice were injected with 3 x 10⁶ WEHI-164 cells and treatment was started when tumors reached a size of approximately 50 mm3. Mice were randomly grouped (n = 5) and received either the AH1 vaccine (50 μg AH1 peptide + 100 μg poly(I:C) in saline), poly(I:C) alone or saline alone subcutaneously (black arrows). ****, p < 0.0001 (regular two-way ANOVA test with the Bonferroni post-test). Data represent mean tumor volumes (± SEM). B, WEHI-164 bearing mice were treated either with the AH1 vaccine alone, 1 μg F8-TNF alone or their combination (n = 5). Poly(I:C) alone was used as negative control (n = 5). Subcutaneous vaccination was performed every 4 days (black arrows), F8-TNF was injected intravenously (grey arrows) in the lateral tail vein every 48 h, starting on the day after the first vaccination. CR = complete response. ****, p < 0.0001, **, p < 0.01 (regular two-way ANOVA test with the Bonferroni post-test). Data represent mean tumor volumes (± SEM). C, CT26 colon carcinoma-bearing mice were treated as described in B, either with the AH1 vaccine alone, 2.5 μg F8-TNF alone or the combination thereof (n = 5). Poly(I:C) alone was used as negative control (n = 5). CR = complete response. **, p < 0.01 (regular two-way ANOVA test with the Bonferroni post-test). Data represent mean tumor volumes (± SEM). D, The performance of a synthetic long peptide (SLP) of the natural gp70 amino acid sequence consisting of the AH1 domain (CD8+ T cell epitope) and predicted CD4+ T cell epitopes was tested in CT26-bearing mice. Vaccination was performed as described in B (black arrows) and three injections of 2.5 μg of F8-TNF were given intravenously in the lateral tail vein (grey arrows). CR = complete response. *, p < 0.05 (regular two-way ANOVA test with the Bonferroni post-test). Data represent mean tumor volumes (± SEM).
Figure 2
Figure 2. MHC class I peptidome analysis of CT26 cells.
A, Number of MHC class I-bound peptides identified in five independent analyses of 100 million cells. B, Length distribution of peptides identified from the CT26 cell line. C, Comparison of the MHC class I peptidome from CT26 and WEHI-164 cells. Venn diagrams were computed from the peptides identified from CT26 and WEHI-164, respectively. D, H-2 specific motifs from the MHC class I peptidome of CT26. All unique 9mers were subjected to Gibbs clustering with the GibbsCluster-2.0 Server (37). Motifs of H-2Dd, -Kd and -Ld alleles from 693, 585, and 552 peptides are presented from left to right.
Figure 3
Figure 3. Flow cytometric analysis of CD8+ and CD4+ T cells in draining lymph nodes and tumors.
A, Comparison of CD8+ T cell (left bar plot) and CD4+ T cell (right bar plot) density in tumor draining lymph nodes (DLN) among the different treatment groups of CT26-bearing mice. *, p < 0.05, **, p < 0.01 (regular two-way ANOVA test with the Bonferroni post-test). Data represent mean (± SEM). n = 4 per group. B, Representative flow cytometric dot plots showing the expression of Foxp3 on CD4+ T cells in DLN and tumors of control mice, AH1 vaccine-, F8-TNF- and combo treated mice (n = 4 per group). Numbers indicate the percentage of Foxp3+ cells among total CD4+ T cells.
Figure 4
Figure 4. Analysis of AH1-specific CD8+ T cells
A, Analysis of AH1-specific cells among total CD8+ T cells in tumor draining lymph nodes. Numbers indicate the frequency of antigen-specific CD8+ T cells (n = 4 per group). B, Representative flow cytometric dot plots of AH1+ CD8+ T cells in tumors of mice from the different treatment groups (n = 4). Plots were gated on total Thy1.2+ cells and C, on total CD8+ T cells. Numbers indicate the percentage of AH1-specific CD8+ T cells.
Figure 5
Figure 5. Phenotype analysis of CD4+ T cells, CD8+ T cells and AH1-specific cells in DLN
A, Representative FACS plots of CD4+ T cell, CD8+ T cell and AH1+ CD8+ T cell subsets: naïve (CD44- CD62L+), central memory (CD44+ CD62L+) and effector memory (CD44+ CD62L-) phenotypes. B, Bar plots showing the percentage of naïve, central memory (CM) and effector memory (EM) cells among CD4+ T cells, CD8+ T cells and AH1+ CD8+ T cells in draining lymph nodes of mice from the different therapy groups (n = 4). Statistical differences were assessed between the treatment groups and control mice. *, p < 0.05, ****, p < 0.0001 (regular two-way ANOVA test with the Bonferroni post-test). Data represent mean (± SEM). C, Expression of exhaustion markers PD-1, TIM-3 and LAG-3, and of the proliferation marker Ki-67 was assessed among CD4+ T cells, CD8+ T cells and AH1+ CD8+ T cells in draining lymph nodes of treated mice (n = 4 per group). Statistical differences were assessed between the treatment groups and control mice. Data represent mean (± SEM). *, p < 0.05, **, p < 0.01, ***, p < 0.001, ****, p < 0.0001 (regular two-way ANOVA test with the Bonferroni post-test).
Figure 6
Figure 6. Phenotype analysis of CD4+ T cells and CD8+ T cells in tumors
A, Flow cytometric dot plot (top left) of CD4+ T cell subsets in CT26 tumors: naïve (CD44- CD62L+), central memory (CD44+ CD62L+) and effector memory (CD44+ CD62L-) phenotypes. A bar plot (top right) shows the percentage of naïve, central memory (CM) and effector memory (EM) cells among CD4+ T cells in tumors of mice from the different therapy groups (n = 4). Expression of exhaustion markers PD-1, TIM-3 and LAG-3, and of the proliferation marker Ki-67 was assessed among tumor infiltrating CD4+ T cells (bottom). Statistical differences were assessed between the treatment groups and control mice. Data represent mean (± SEM). **, p < 0.01, ***, p < 0.001 (regular two-way ANOVA test with the Bonferroni post-test). B, The same analysis was performed for tumor infiltrating CD8+ T cells (n = 4 mice per group). Statistical differences were assessed between the treatment groups and control mice. Data represent mean (± SEM). ****, p < 0.0001 (regular two-way ANOVA test with the Bonferroni post-test).
Figure 7
Figure 7. Hemorrhagic necrosis in tumors due to F8-TNF
A, Representative FACS plots of tumor samples from mice of the four treatment groups. Definiton of tumor cells (P1) and the T cell containing population (P2) by forward (FSC) and side scatter (SSC) characteristics (left column). P3 shows the percentage of living cells among all analyzed cells. B, Representative images of CT26 tumors before the start of the F8-TNF treatment (left image), and 16 h after the first injection of 2.5 μg of the immunocytokine (right image) C, Ex vivo H&E analysis on WEHI-164 tumor sections 16 hours after treatment with saline (left) or F8-TNF (right). Magnification, x10. Scale bar, 100 μm. D, Bar plots representing the CD8+ T cell to tumor cell ratio (left plot) or the AH1+ CD8+ T cell to tumor ratio in treated mice (n = 4 per group) determined by flow cytometry. Statistical differences were assessed between the treatment groups and control mice. Data represent mean (± SEM). *, p < 0.05, **, p < 0.01 (unpaired, two-tailed t test).

References

    1. Melero I, Gaudernack G, Gerritsen W, Huber C, Parmiani G, Scholl S, et al. Therapeutic vaccines for cancer: an overview of clinical trials. Nature Reviews Clinical Oncology. 2014;11:509. - PubMed
    1. Guo C, Manjili MH, Subjeck JR, Sarkar D, Fisher PB, Wang X-Y. Therapeutic Cancer Vaccines: Past, Present, and Future. In: Tew KD, Fisher PB, editors. Adv Cancer Res. Vol. 119. Academic Press; 2013. pp. 421–75. - PMC - PubMed
    1. Melief CJM, van Hall T, Arens R, Ossendorp F, van der Burg SH. Therapeutic cancer vaccines. The Journal of Clinical Investigation. 2015;125(9):3401–12. - PMC - PubMed
    1. Moynihan KD, Opel CF, Szeto GL, Tzeng A, Zhu EF, Engreitz JM, et al. Eradication of large established tumors in mice by combination immunotherapy that engages innate and adaptive immune responses. Nat Med. 2016;22:1402. - PMC - PubMed
    1. Gubin MM, Zhang X, Schuster H, Caron E, Ward JP, Noguchi T, et al. Checkpoint blockade cancer immunotherapy targets tumour-specific mutant antigens. Nature. 2014;515:577. - PMC - PubMed

Publication types

MeSH terms