. 2018 Dec;41(12):2617-2624.
doi: 10.2337/dc18-0840. Epub 2018 Oct 16.

Plasma Lipidomic Profiling and Risk of Type 2 Diabetes in the PREDIMED Trial

Affiliations

Plasma Lipidomic Profiling and Risk of Type 2 Diabetes in the PREDIMED Trial

Cristina Razquin et al. Diabetes Care. 2018 Dec.

Abstract

Objective: Specific lipid molecular changes leading to type 2 diabetes (T2D) are largely unknown. We assessed lipidome factors associated with future occurrence of T2D in a population at high cardiovascular risk.

Research design and methods: We conducted a case-cohort study nested within the PREDIMED trial, with 250 incident T2D cases diagnosed during 3.8 years of median follow-up, and a random sample of 692 participants (639 noncases and 53 overlapping cases) without T2D at baseline. We repeatedly measured 207 plasma known lipid metabolites at baseline and after 1 year of follow-up. We built combined factors of lipid species using principal component analysis and assessed the association between these lipid factors (or their 1-year changes) and T2D incidence.

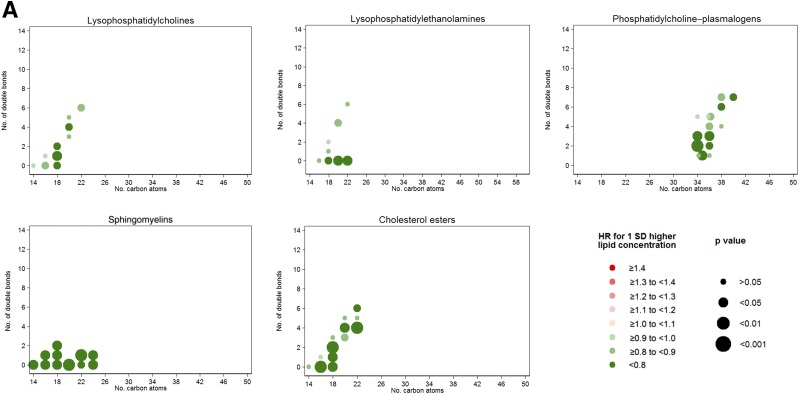
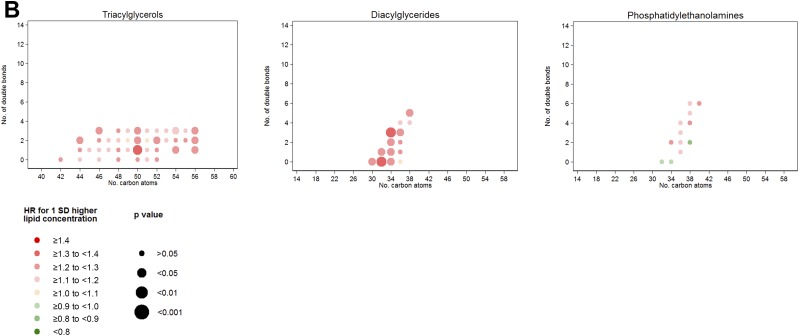
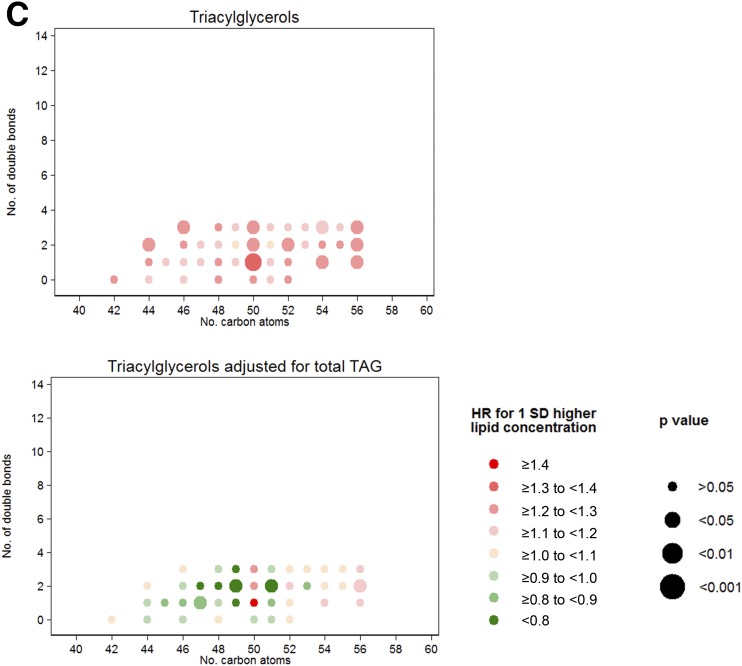
Results: Baseline lysophosphatidylcholines and lysophosphatidylethanolamines (lysophospholipids [LPs]), phosphatidylcholine-plasmalogens (PC-PLs), sphingomyelins (SMs), and cholesterol esters (CEs) were inversely associated with risk of T2D (multivariable-adjusted P for linear trend ≤0.001 for all). Baseline triacylglycerols (TAGs), diacylglycerols (DAGs), and phosphatidylethanolamines (PEs) were positively associated with T2D risk (multivariable-adjusted P for linear trend <0.001 for all). One-year changes in these lipids showed associations in similar directions but were not significant after adjustment for baseline levels. TAGs with odd-chain fatty acids showed inverse associations with T2D after adjusting for total TAGs.

Conclusions: Two plasma lipid profiles made up of different lipid classes were found to be associated with T2D in participants at high cardiovascular risk. A profile including LPs, PC-PLs, SMs, and CEs was associated with lower T2D risk. Another profile composed of TAGs, DAGs, and PEs was associated with higher T2D risk.


Figures

Figure 1
Figure 1
A: HRs per 1-SD increase in baseline lipid concentration for lipid groups inversely associated with T2D. Lipid species were inverse normally transformed, and HRs were calculated from weighted Cox models adjusted for age, sex, intervention group, BMI, smoking, hypertension, dyslipidemia, and baseline glucose (linear and quadratic term). B: HRs per 1-SD increase in baseline lipid concentration for lipid groups directly associated with T2D. Lipid species were inverse normally transformed, and HRs were calculated from weighted Cox models adjusted for age, sex, intervention group, BMI, smoking, hypertension, dyslipidemia, and baseline glucose (linear and quadratic term). C: HRs for T2D per 1 SD for the residual of each TAG over the total content of the considered TAG. Lipid species were inverse normally transformed before calculating the residual, and HRs were calculated from weighted Cox models adjusted for age, sex, intervention group, BMI, smoking, hypertension, dyslipidemia, and baseline glucose (linear and quadratic term).
Figure 1
Figure 1
A: HRs per 1-SD increase in baseline lipid concentration for lipid groups inversely associated with T2D. Lipid species were inverse normally transformed, and HRs were calculated from weighted Cox models adjusted for age, sex, intervention group, BMI, smoking, hypertension, dyslipidemia, and baseline glucose (linear and quadratic term). B: HRs per 1-SD increase in baseline lipid concentration for lipid groups directly associated with T2D. Lipid species were inverse normally transformed, and HRs were calculated from weighted Cox models adjusted for age, sex, intervention group, BMI, smoking, hypertension, dyslipidemia, and baseline glucose (linear and quadratic term). C: HRs for T2D per 1 SD for the residual of each TAG over the total content of the considered TAG. Lipid species were inverse normally transformed before calculating the residual, and HRs were calculated from weighted Cox models adjusted for age, sex, intervention group, BMI, smoking, hypertension, dyslipidemia, and baseline glucose (linear and quadratic term).

References

    1. American Diabetes Association 2. Classification and diagnosis of diabetes. Diabetes Care 2017;40(Suppl. 1):S11–S24 - PubMed
    1. American Diabetes Association Diagnosis and classification of diabetes mellitus. Diabetes Care 2008;31(Suppl. 1):S55–S60 - PubMed
    1. Ogurtsova K, da Rocha Fernandes JD, Huang Y, et al. . IDF Diabetes Atlas: global estimates for the prevalence of diabetes for 2015 and 2040. Diabetes Res Clin Pract 2017;128:40–50 - PubMed
    1. Mooradian AD. Dyslipidemia in type 2 diabetes mellitus. Nat Clin Pract Endocrinol Metab 2009;5:150–159 - PubMed
    1. Chehade JM, Gladysz M, Mooradian AD. Dyslipidemia in type 2 diabetes: prevalence, pathophysiology, and management. Drugs 2013;73:327–339 - PubMed

Publication types

Associated data