. 2018 Oct 23;2(20):2637-2645.
doi: 10.1182/bloodadvances.2018023705.

Visualizing hematopoiesis as a stochastic process

Affiliations

Visualizing hematopoiesis as a stochastic process

Jason Xu et al. Blood Adv. .

Abstract

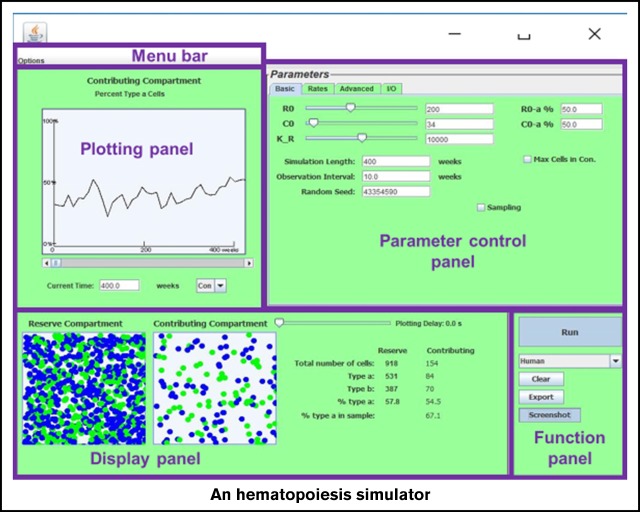
Stochastic simulation has played an important role in understanding hematopoiesis, but implementing and interpreting mathematical models requires a strong statistical background, often preventing their use by many clinical and translational researchers. Here, we introduce a user-friendly graphical interface with capabilities for visualizing hematopoiesis as a stochastic process, applicable to a variety of mammal systems and experimental designs. We describe the visualization tool and underlying mathematical model, and then use this to simulate serial transplantations in mice, human cord blood cell expansion, and clonal hematopoiesis of indeterminate potential. The outcomes of these virtual experiments challenge previous assumptions and provide examples of the flexible range of hypotheses easily testable via the visualization tool.


Conflict of interest statement

Conflict-of-interest disclosure: The authors declare no competing financial interests.

Figures

None
Graphical abstract
Figure 1.
Figure 1.
Illustration of the 2-compartment hidden stochastic model for hematopoiesis. The model designates 3 HSC behaviors: λ, the mean replication (self-renewal) rate (diagrammed as 1 HSC becoming 2 HSCs); α, the mean apoptosis rate (diagrammed as a HSC exiting from compartment 1); and ν, the mean rate at which an HSC becomes a multipotent progenitor (short-term repopulating) cell and gives rise to a differentiating clone. Once an HSC becomes a multipotent progenitor (diagrammed as an HSC entering compartment 2), it and its progeny (termed a differentiating clone) contribute to the blood cell production, which is observed for a mean of 1/μ weeks. With this tool, whether designated HSC behaviors could lead to experimental or clinical outcomes that are observed could be determined. See “Materials and methods” for further details. Adapted from Catlin et al. BFU-E, burst-forming unit erythroid; CFU, colony-forming unit; CFU-E, CFU erythroid; CFU-GM, CFU granulocyte macrophage; CFU-Meg, CFU megakaryocyte.
Figure 2.
Figure 2.
Screenshots of the current version of the visualization tool. Shown are 2 simulations where a small number of HSCs, 30 (R0 = 30) and the equivalent number of contributing clones that would be present in an aspirate of feline marrow containing 30 HSCs (C0 = 16) are transplanted into a lethally irradiated cat. Fifty percent of the initial transplanted cells are type a (blue) and 50% are type b (green), simulating the autologous transplantation of small numbers of G6PD heterozygous marrow cells as in Abkowitz et al and Golinelli et al. Observations were plotted every 10 weeks for a 300-week (∼6-year) interval. By the end of the simulation period in panel A, 2878 HSCs are present in the HSC compartment (or HSC reserve); 30.5% are type a. There are also 1337 contributing clones of which 29.5% are type a. Note that the HSC compartment is not yet full at 220 weeks (4 years after this transplantation) as the number of HSCs (N = 2878) is much less than the capacity of the stem cell compartment (K = 10 000 in this simulation). Model parameters, including λ, α, ν, and μ of type a and type b cells, can be independently controlled under the “Advanced” tab (top right). Data are preloaded for cat (shown), mouse, nonhuman primates, and humans, in accordance with Abkowitz et al, Catlin et al, Abkowitz et al, Shepherd et al, Guttorp et al, Abkowitz et al, Fong et al, and Becker et al. For cat, the preset value for λ = once per 10 weeks and ν = once per 12.5 weeks (9). The second simulation (B) has identical input parameters as the first simulation (A) but produces a vastly different outcome. Max Cells in Con., maximum cells in contributing compartment.
Figure 3.
Figure 3.
Virtual serial transplantation experiment in mice. (A) The numbers of HSCs 12 weeks after an initial transplantation and after 3 retransplantations. Optimized values for λ (once per 2.5 weeks), α (once per 20 weeks), ν (once per 3.4 weeks), and μ (6.9 weeks) were used, and are preset in the simulation tool. In these simulations of serial transplantations, mice receive 4% of the number of HSCs present 12 weeks after the previous transplantation. Histograms correspond to 1000 independent simulations of this process: as shown, by the third transplantation (recipient 3), ∼70% of the 1000 virtual mice fail to reconstitute. By the final sequential transplantation, almost all virtual mice have a depleted HSC reserve (ie, zero compartment 1 cells). (B) Similar histograms of the numbers of HSCs in the final recipients, and show the effects of varying the percentage of marrow cells transplanted and varying length of time between the sequential transplantation. As expected, transplanting higher percentages of marrow cells or waiting longer between transplantations ameliorates the quantity of HSC dilution; the rightmost histogram shows that only about one-third of the simulated mice will die of a lack of HSCs when doubling the parameters of the experiment in panel A.
Figure 4.
Figure 4.
Simulation of expanded cord blood cell transplantation in humans. The average numbers (Avg Pop) of short-term repopulating cells (STRCs) remaining after 1 year are shown. Also shown is the dependency of this number on the length of time an STRC-derived clone contributes to blood cell production and the initial number of STRCs transplanted. Results derive from 500 independent simulations for each set of parameters. When the mean length of time a STRC-derived clone contributes to blood cell production is set at 12 weeks, rare clones often persist for 1 year or longer because of the stochasticity in expansion and differentiation decisions of progeny cells. Indeed, the plot indicates persistence whenever the mean STRC-derived clone lifespan is over 10 weeks and over 200 to 500 STRCs are transplanted. Thus, the argument that observing a cell at 1 year implies that it derived from transplanted HSCs is not secure.
Figure 5.
Figure 5.
Simulation of mutations yielding a replication advantage. Example realizations of simulated human hematopoiesis under HSC mutation. Optimized values for λ (once per 40 weeks), α (once per 285 weeks), ν (once per 56 weeks), and μ (10 weeks) were used for the normal HSCs, and are preset in the simulation tool. Each simulation begins with 1 mutant HSC that self-renews on average twice as frequently (on average once every 20 weeks) as the 20 000 normal HSCs (which renew on average once every 40 weeks). In this thought experiment, the maximum numbers of normal HSCs plus mutant HSCs is set at 25 000. Mutant cells are represented as type a cells and appear as blue circles above. In roughly one-quarter of simulations, mutant HSC replicates but never contributes to hematopoiesis (enters compartment 2), or its clones transiently appear in compartment 2 at very low levels. (A) An example of this. At other times, the mutant clone very slowly expands in the stem cell reserve and then contributing compartments (B). Conceptually, these simulations provide a virtual representation of clonal hematopoiesis of indeterminate significance., (A) The clonal contribution reaches roughly 1% of compartment 2 (STRCs), decreases to near zero, and then reaches 1.8% after 400 weeks. (B) An example where the mutant clone persists, reaching a population of 411 mutant STRCs (of 2486 compartment 2 cells or 14.1%) after 400 weeks. In this simulation, the number of mutant HSC (compartment 1 cells) increases to 3911, or 15.6% of total HSCs. Expansions to 10 or more percent of HSCs occurs in roughly one-quarter of the simulations. In contrast, this rarely ever occurs when decreasing the replicative advantage of the mutant cell to once every 30 weeks. Varying the parameter values enables simulating hematopoiesis with different behaviors for a single mutant HSC, allowing for visualization of the differing physiologies under which clonal hematopoiesis could emerge or progress.

References

    1. Szilvassy SJ, Humphries RK, Lansdorp PM, Eaves AC, Eaves CJ. Quantitative assay for totipotent reconstituting hematopoietic stem cells by a competitive repopulation strategy. Proc Natl Acad Sci USA. 1990;87(22):8736-8740. - PMC - PubMed
    1. Uchida N, Tsukamoto A, He D, Friera AM, Scollay R, Weissman IL. High doses of purified stem cells cause early hematopoietic recovery in syngeneic and allogeneic hosts. J Clin Invest. 1998;101(5):961-966. - PMC - PubMed
    1. Abkowitz JL, Golinelli D, Harrison DE, Guttorp P. In vivo kinetics of murine hemopoietic stem cells. Blood. 2000;96(10):3399-3405. - PubMed
    1. Catlin SN, Busque L, Gale RE, Guttorp P, Abkowitz JL. The replication rate of human hematopoietic stem cells in vivo. Blood. 2011;117(17):4460-4466. - PMC - PubMed
    1. Abkowitz JL, Catlin SN, McCallie MT, Guttorp P. Evidence that the number of hematopoietic stem cells per animal is conserved in mammals. Blood. 2002;100(7):2665-2667. - PubMed

Publication types