. 2018 Oct 16;9(1):4300.
doi: 10.1038/s41467-018-06665-5.

PWWP2A binds distinct chromatin moieties and interacts with an MTA1-specific core NuRD complex

Affiliations

PWWP2A binds distinct chromatin moieties and interacts with an MTA1-specific core NuRD complex

Stephanie Link et al. Nat Commun. .

Abstract

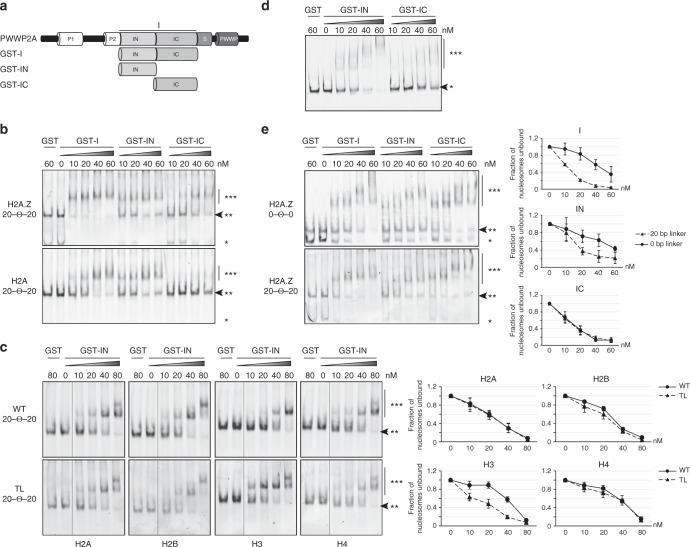
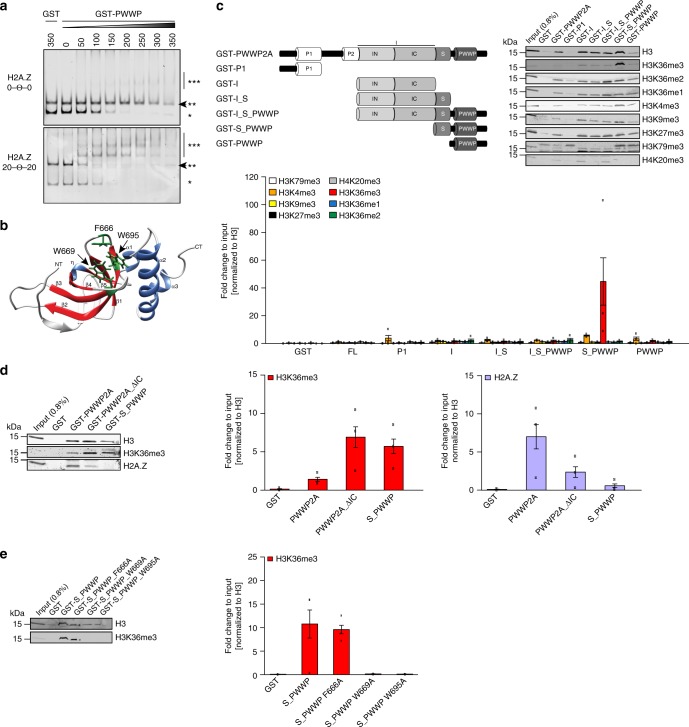
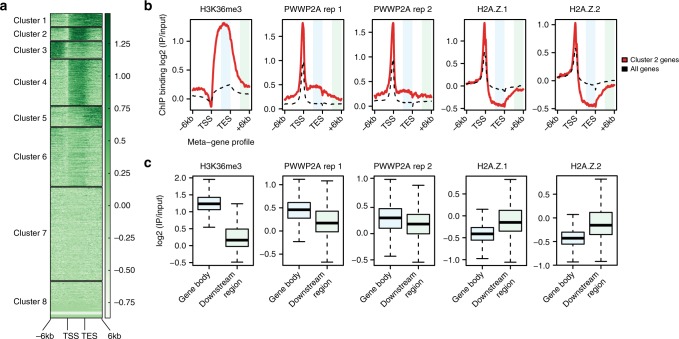
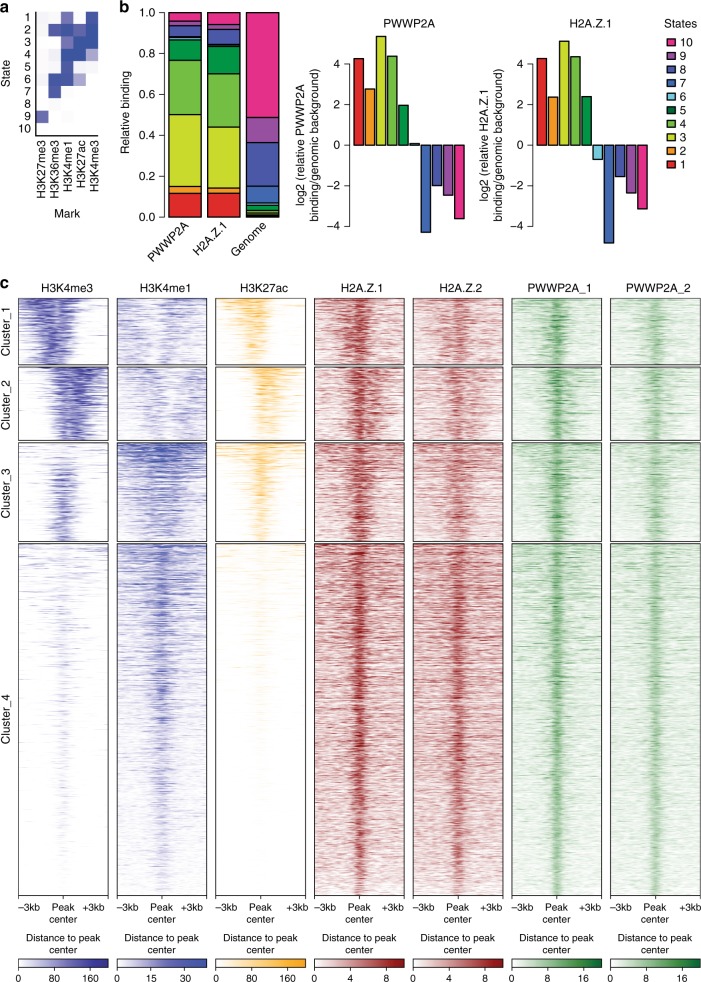
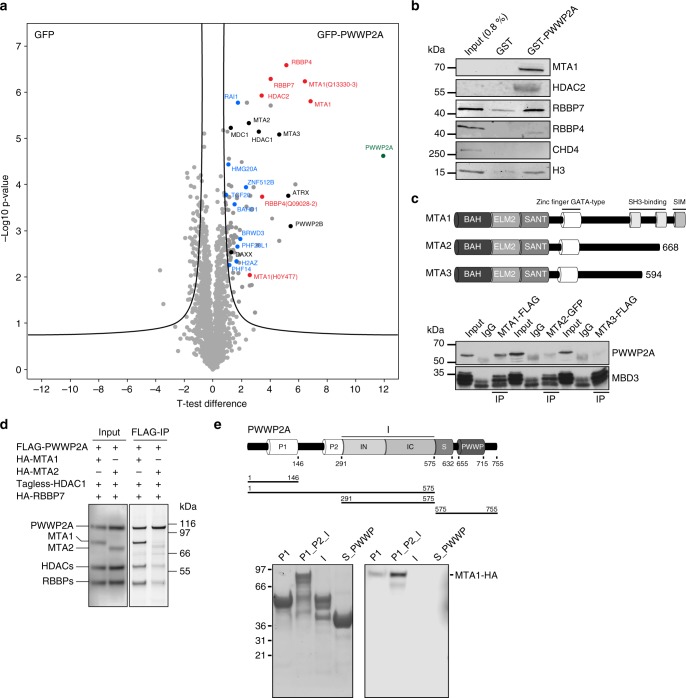
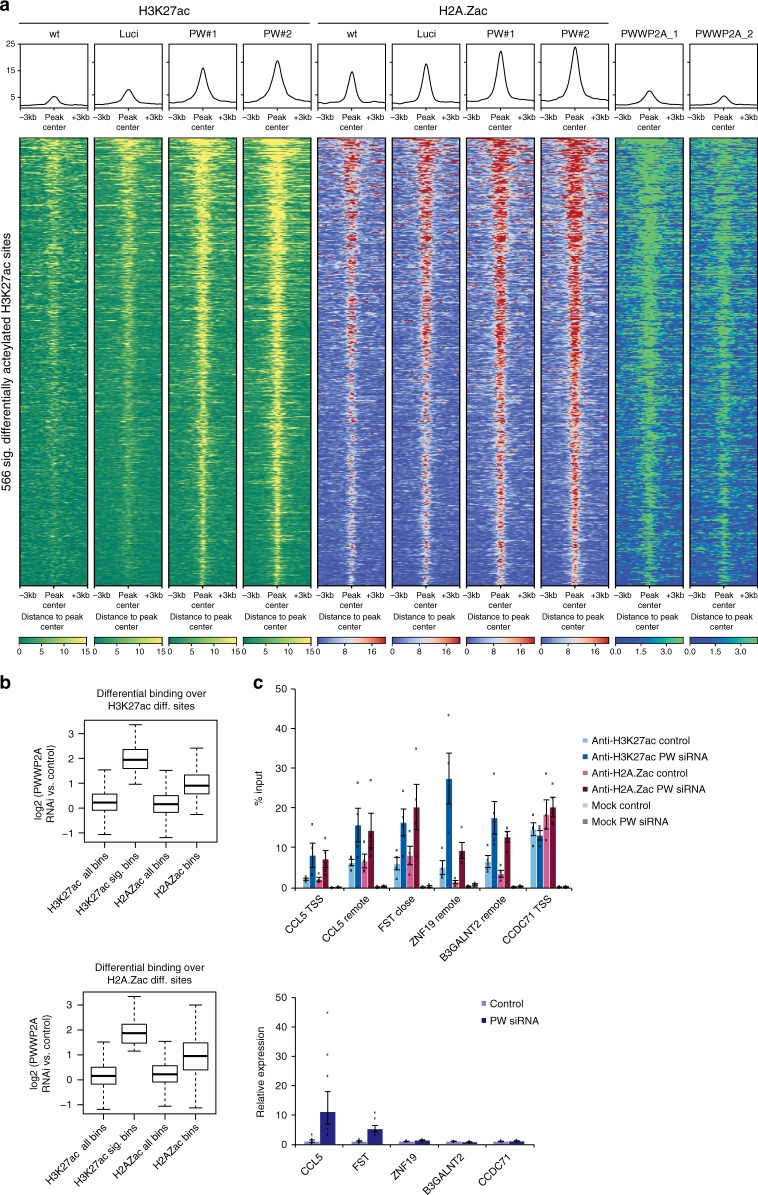
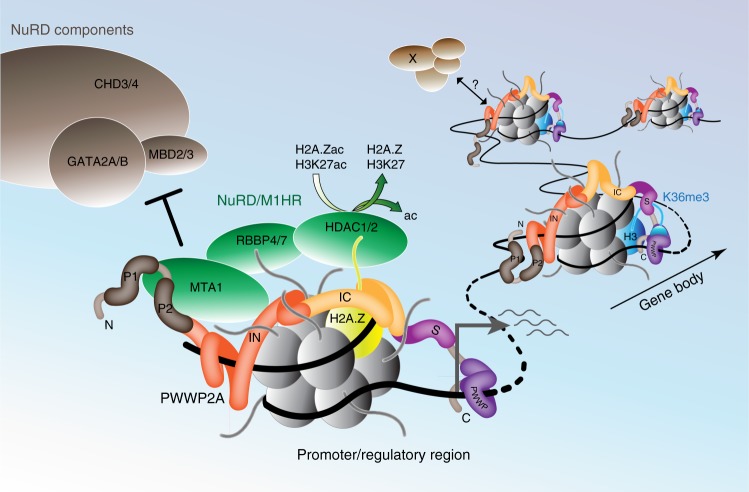
Chromatin structure and function is regulated by reader proteins recognizing histone modifications and/or histone variants. We recently identified that PWWP2A tightly binds to H2A.Z-containing nucleosomes and is involved in mitotic progression and cranial-facial development. Here, using in vitro assays, we show that distinct domains of PWWP2A mediate binding to free linker DNA as well as H3K36me3 nucleosomes. In vivo, PWWP2A strongly recognizes H2A.Z-containing regulatory regions and weakly binds H3K36me3-containing gene bodies. Further, PWWP2A binds to an MTA1-specific subcomplex of the NuRD complex (M1HR), which consists solely of MTA1, HDAC1, and RBBP4/7, and excludes CHD, GATAD2 and MBD proteins. Depletion of PWWP2A leads to an increase of acetylation levels on H3K27 as well as H2A.Z, presumably by impaired chromatin recruitment of M1HR. Thus, this study identifies PWWP2A as a complex chromatin-binding protein that serves to direct the deacetylase complex M1HR to H2A.Z-containing chromatin, thereby promoting changes in histone acetylation levels.


Conflict of interest statement

The authors declare no competing interests.

Figures

Fig. 1
Fig. 1
IC distinguishes between H2A and H2A.Z, whereas IN recognizes nucleosomal linker DNA. a Schematic representation of recombinant GST–PWWP2A deletions (GST-I, GST–IN, and GST-IC) used in cEMSAs. b Representative cEMSA in which a 1:1 mixture of H2A- and H2A.Z-containing nucleosomes (each with a distinct fluorescent tag) was incubated with increasing concentrations of GST-tagged I-domain constructs. The top gel shows detection of the H2A.Z nucleosomes and the bottom gel detection of the H2A nucleosomes. In both cases, the DNA contained a 20-bp linker DNA (Widom 601-sequence) on each side of the nucleosome (20–Θ–20). GST alone served as negative control. *Free DNA, **nucleosome, ***nucleosome GST–protein complex. Arrow indicates loss of signal when nucleosome GST–protein complexes are formed. c Left: representative cEMSAs similar to (b) using recombinant wildtype mononucleosomes (WT, top) or mononucleosomes lacking single histone tails (TL, bottom) containing 20-bp linker DNA (20–Θ–20). Nucleosomes were incubated with the indicated concentrations of GST–IN and the gel visualized by fluorescence detection of the indicated nucleosome. Right: quantification of signal intensities of nucleosomes (**) using Image Studio Lite Ver 5.2 (LI-COR). Error bars indicate SEM of three independent replicates. d Representative EMSA using Cy-5 labeled 187-bp dsDNA and the indicated concentrations of GST–IN and GST-IC. *free DNA, ***DNA–GST–protein complex. Arrow indicates unbound DNA. e Left: representative cEMSAs similar to (b) using recombinant H2A.Z-containing mononucleosomes without (0–Θ–0, top) and with (20–Θ–20, bottom) linker DNA; these nucleosomes were incubated with the indicated concentrations of GST-I, GST–IN, and GST-IC. *Free DNA, **nucleosome, ***nucleosome GST–protein complex. Arrow indicates loss of signal when nucleosome GST–protein complexes are formed. Right: Quantification of signal intensities of nucleosomes (**) using Image Studio Lite Ver 5.2 (LI-COR). Error bars indicate SEM of three independent replicates
Fig. 2
Fig. 2
PWWP domain binds nucleic acids and S_PWWP interacts with H3K36me3. a Representative cEMSA using recombinant H2A.Z-containing mononucleosomes assembled either without (0–Θ–0, top) or with linker DNA (20–Θ–20, bottom) incubated with indicated increasing concentrations of GST–PWWP. GST alone served as negative control. *Free DNA, **nucleosome, ***nucleosome GST–PWWP complex. Arrow indicates loss of signal when nucleosome GST–protein complexes are formed. b In silico structure of PWWP domain modeled with the web browser-based tool iTASSER and visualized with Chimera (1.8.0). β-barrels (β1–β5) are colored in red, α-helixes (α1–α3), and η-helix in blue and the three residues forming the aromatic cage (F666, W669, and W695) are highlighted in green and depicted in stick mode. NT = N-terminus, CT = C-terminus. c Top left: schematic representation of recombinant GST–PWWP2A and deletions (GST-P1, GST-I, GST-I_S, GST-I_S_PWWP, GST-S_PWWP, and GST–PWWP) used in cell-derived mononucleosome-IPs. Top right: Immunoblotting of different histone PTMs upon GST–PWWP2A deletion construct (GST–PWWP2A, GST-P1, GST-I, GST-I_S, GST-I_S_PWWP, GST-S_PWWP, and GST–PWWP) IPs with HK cell-derived mononucleosomes. Notice enrichment of H3K36me3 in comparison to other modifications in S_PWWP pulldown. GST alone served as negative control. Bottom: Data quantification was done for three biological replicates for each PTM (n = 3). Data shown are means and error bars depict SEM. d Left: immunoblotting of H3K36me3 and H2A.Z upon GST–PWWP2A, GST-PWWP2A_ΔIC and GST-S_PWWP IPs with HK cell-derived mononucleosomes. Right: Data quantification of H3K36me3 enrichment (middle) and H2A.Z binding (right) was done for three biological replicates (n = 3). Data shown are means and error bars depict SEM. e Left: immunoblotting of H3K36me3 upon GST-S_PWWP aromatic cage point mutants (GST-S_PWWP_F666A, GST-S_PWWP_W669A, GST-S_PWWP_W695A) IPs with HK cell-derived mononucleosomes. Notice reduction of H3K36me3 in GST-S_PWWP_W669A and GST-S_PWWP_W695A pulldowns. Right: Data quantification was done for three biological replicates (n = 3). Data shown are means and error bars depict SEM
Fig. 3
Fig. 3
PWWP2A associates weakly with H3K36me3-enriched, H2A.Z-depleted gene body regions. a ChIP-seq density heatmap of H3K36me3 (ENCODE) clustering analysis of meta-gene binding profiles encompassing gene bodies and 6 kb upstream and downstream regions of transcriptional start sites (TSS) and transcriptional end sites (TES). Color intensity represents normalized and scaled tag counts. Cluster 2, which represents H3K36me3-enriched genes, was used for further analysis. b Meta-gene profile correlations of ChIP-seq data for H3K36me3, two GFP–PWWP2A replicates (rep), GFP-H2A.Z.1, and GFP-H2A.Z.2 mean coverage signals of cluster 2 genes (red line) and all genes (black dotted line) encompassing gene bodies and 6 kb upstream and downstream regions of TSS and TES. Regions highlighted in light blue (gene body) and light green (downstream region) were further analyzed in (c). GFP–PWWP2A and GFP-H2A.Z nChIP-seq data are from. (c) Boxplots of H3K36me3, two independent GFP–PWWP2A, GFP-H2A.Z.1, and GFP-H2A.Z.2 signal intensities comparing gene body with non-coding regions of same size within cluster 2
Fig. 4
Fig. 4
PWWP2A associates with regulatory regions genome-wide. a ChromHMM,-based characterization of chromatin states of PWWP2A-containing genomic regions. The heatmap depicts the emission parameters of the HMM and describes the combinatorial occurrence of the individual histone modifications in different chromatin states. b Chromatin-state enrichment of PWWP2A- or H2A.Z.1-enriched sites compared to complete human genome (left) and log2-fold enrichment or depletion of PWWP2A sites in specific states calculated to frequency in complete genome (right). Notice enrichment of PWWP2A in states 1–5 that resemble promoter and enhancer regions. c nChIP-seq density heatmap of PWWP2A enriched sites (two replicates, green) and visualization of the intensities of H3K4me3 (dark blue, ENCODE), H3K4me1 (light blue, ENCODE), H3K27ac (yellow, ENCODE), and H2A.Z1 and H2A.Z.2 variants (red) at these regions. Color intensity represents normalized and globally scaled tag counts. Notice PWWP2A is found at active promoter regions (H3K4me3+, H3K4me1−, H3K27ac+) encompassing clusters 1 and 2, as well as active (cluster 3: H3K4me3+, H3Kme1+, H3K27ac+) and inactive (cluster 4: H3K4me3−, H3K4me1+. H3K27ac−) enhancers, all containing H2A.Z variants
Fig. 5
Fig. 5
PWWP2A interacts with members of a core NuRD complex via MTA1. a Volcano plot of label-free interaction of GFP–PWWP2A-associated mononucleosomes. Significantly enriched proteins over GFP-associated mononucleosomes are shown in the upper right part. t test differences were obtained by two-sample t test. PWWP2A is highlighted in green, members of the core NuRD (M1HR) complex in red, previously identified H2A.Z-mononucleosome binders in blue, PWWP2A-specific interactors not found in H2A.Z pulldowns in black and background binding proteins in gray. b Immunoblots of several NuRD members (MTA1, HDAC2, RBBP7, RBBP4, and CHD4) and H3 upon GST and GST–PWWP2A IP with HK cell-derived mononucleosomes. c Upper part: schematic depiction of mammalian MTA1-3 paralogues. Lower part: immunoblots of PWWP2A or MBD3 after IP of endogenously tagged MTA1–FLAG, MTA2–GFP, or MTA3–FLAG from mouse embryonic stem cell (mESC) nuclear extracts. Input lanes represent 10% of the lysate used for the IP. d FLAG-PWWP2A IPs with cell lysates from HEK293 cells co-transfected with combinations of plasmids encoding FLAG-PWWP2A, HDAC1 (tagless), HA-RBBP4, and either HA-MTA1 or HA-MTA2. Left panel: western blot of inputs. Right panel: SYPRO Ruby-stained SDS-PAGE of the precipitated proteins.  e Top: schematic depiction of domain structure of PWWP2A and deletion constructs. Bottom: coomassie-stained SDS–PAGE gel with indicated recombinant PWWP2A deletion constructs on beads (left) and immunoblots of IPs from lysates from HEK293 cells expressing HA-MTA1 (right)
Fig. 6
Fig. 6
Depletion of PWWP2A mediates increase of H3K27 and H2A.Z acetylation. a nChIP-seq density heatmap of 566 induced H3K27ac sites upon PWWP2A-depeletion. H3K27ac (yellow) and H2A.Zac (red) mark intensities at these regions upon control (wt, Luci) or PWWP2A (PW#1, PW#2) siRNA-mediated knockdown. Color intensity represents normalized and globally scaled tag counts. Notice strong signal intensity increase of H3K27ac and H2A.Zac upon PWWP2A depletion at PWWP2A-bound regions (green, two replicates are shown). b Boxplots showing quantification of binding events at 566 sites differentially acetylated at H3K27 (p < 0.001) after siRNA-mediated knockdown of PWWP2A (top). Plots indicate that the majority of the observed acetylation changes were characterized by induction of acetylation (p value: sig. H3K27ac versus all: p < 2.2e−16). These sites show simultaneous induction of H2A.Zac, although not as strongly pronounced as for H3K27ac (p value < 2.2e−16) (top). Analysis of differentially regulated H2A.Zac (423 sites, bottom) indicates prevalent induction of acetylation (p value < 2.2e−16). These sites show simultaneous induction of H3K27ac, although not as strongly pronounced as for H2A.Zac (p value < 2.2e−16). Boxplots represent the median and first and third quartiles with whiskers indicating the most extreme data point that is no more than 1.5 times the length of the box away from the box. c Top: validation of nChIP-seq by nChIP-qPCR at selected loci. Shown is percent input of two replicates of H3K27ac or H2A.Zac nChIPs upon control (wt, Luci) or PWWP2A (PW: PW#1, PW#2) siRNA-mediated knockdown. Error bars depict SEM (n = 4). Notice two different classes of genes/loci: Increase of acetylation levels on H3K27ac and H2A.Zac can result in (i) upregulation of expression of a nearby gene (CCL5, FST) or (ii) no change in expression of a nearby gene (ZNF19 and B3GALTN2); CCDC71 represents a locus where acetylation level and gene expression remain unchanged. TSS: transcriptional start site, remote: regulatory region close to a gene. Bottom: Relative expression of selected genes corresponding to differentially acetylated sites (upper panel) after control (wt, Luci) or PWWP2A (PW: PW#1, PW#2) siRNA-mediated knockdown. Shown is the fold change of three replicates normalized to HPRT expression. Error bars depict SEM (n = 6). Notice upregulation of gene expression of only CCL5 and FST
Fig. 7
Fig. 7
Model of PWWP2A recruitment to chromatin and binding to M1HR complex. PWWP2A is able to interact with different chromatin states via distinct domains. It binds weakly to H3K36me3-enriched gene body regions using aromatic cage residues in its S_PWWP domain and recognizes free nucleic acid strands with the PWWP domain. Additionally, PWWP2A binds strongly to H2A.Z-containing promoter and regulatory sites with the IN domain interacting with linker DNA and the IC region mediating H2A.Z–nucleosome specificity. On chromatin, PWWP2A serves as adapter between distinct nucleosome components (H3K36me3 or H2A.Z) and chromatin-modifying complexes. Notably, H2A.Z-bound PWWP2A interacts with a MTA1-specific core NuRD complex (M1HR), preventing formation of full NuRD (+CHD/MBD/GATA subunits) by competing with the MTA-MBD interaction. PWWP2A thereby leads to the recruitment of HDAC1/2 to promoter and regulatory regions, resulting in turn in the deacetylation of nearby H3K27 and H2A.Z. This activity could dampen transcriptional output by reducing acetylation of regulatory regions to prevent hyperacetylation at active genomic sites

References

    1. Strahl BD, Allis CD. The language of covalent histone modifications. Nature. 2000;403:41–45. doi: 10.1038/47412. - DOI - PubMed
    1. Buschbeck M, Hake SB. Variants of core histones and their roles in cell fate decisions, development and cancer. Nat. Rev. Mol. Cell Biol. 2017;18:299–314. doi: 10.1038/nrm.2016.166. - DOI - PubMed
    1. Valdes-Mora F, et al. Acetylated histone variant H2A.Z is involved in the activation of neo-enhancers in prostate cancer. Nat. Commun. 2017;8:1346. doi: 10.1038/s41467-017-01393-8. - DOI - PMC - PubMed
    1. Santisteban MS, Kalashnikova T, Smith MM. Histone H2A.Z regulats transcription and is partially redundant with nucleosome remodeling complexes. Cell. 2000;103:411–422. doi: 10.1016/S0092-8674(00)00133-1. - DOI - PubMed
    1. Bannister AJ, et al. Spatial distribution of di- and tri-methyl lysine 36 of histone H3 at active genes. J. Biol. Chem. 2005;280:17732–17736. doi: 10.1074/jbc.M500796200. - DOI - PubMed

Publication types

MeSH terms