. 2018 Oct 16;9(1):4181.
doi: 10.1038/s41467-018-06616-0.

Characterization of Nigerian breast cancer reveals prevalent homologous recombination deficiency and aggressive molecular features

Affiliations

Characterization of Nigerian breast cancer reveals prevalent homologous recombination deficiency and aggressive molecular features

Jason J Pitt et al. Nat Commun. .

Erratum in

  • Author Correction: Characterization of Nigerian breast cancer reveals prevalent homologous recombination deficiency and aggressive molecular features.
    Pitt JJ, Riester M, Zheng Y, Yoshimatsu TF, Sanni A, Oluwasola O, Veloso A, Labrot E, Wang S, Odetunde A, Ademola A, Okedere B, Mahan S, Leary R, Macomber M, Ajani M, Johnson RS, Fitzgerald D, Grundstad AJ, Tuteja JH, Khramtsova G, Zhang J, Sveen E, Hwang B, Clayton W, Nkwodimmah C, Famooto B, Obasi E, Aderoju V, Oludara M, Omodele F, Akinyele O, Adeoye A, Ogundiran T, Babalola C, MacIsaac K, Popoola A, Morrissey MP, Chen LS, Wang J, Olopade CO, Falusi AG, Winckler W, Haase K, Van Loo P, Obafunwa J, Papoutsakis D, Ojengbede O, Weber B, Ibrahim N, White KP, Huo D, Olopade OI, Barretina J. Pitt JJ, et al. Nat Commun. 2019 Jan 14;10(1):288. doi: 10.1038/s41467-018-07886-4. Nat Commun. 2019. PMID: 30643118 Free PMC article.

Abstract

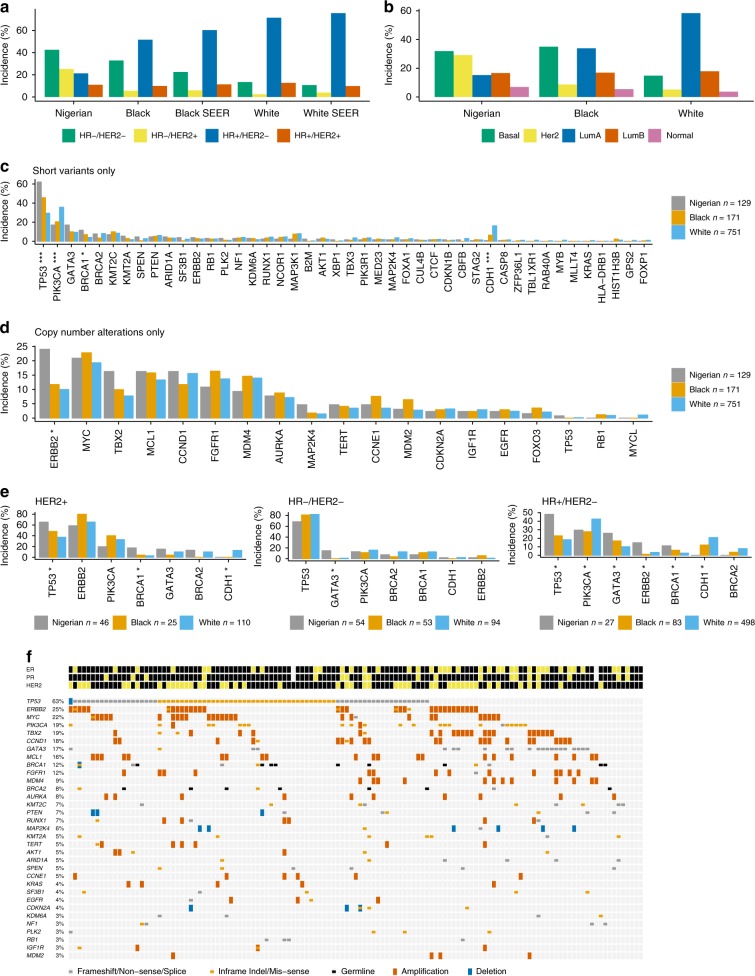
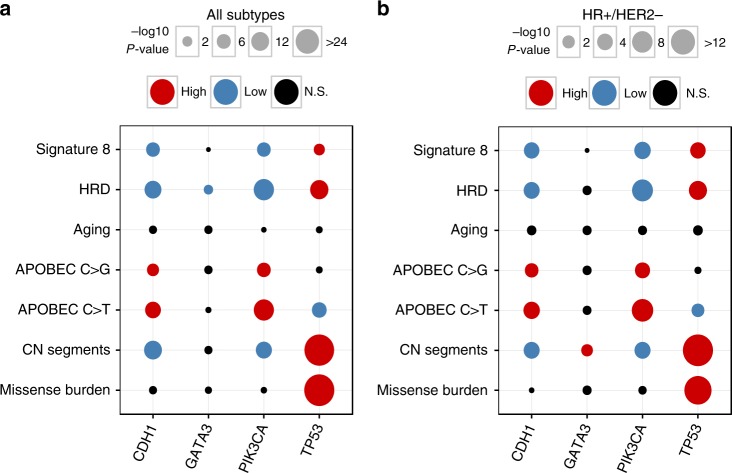
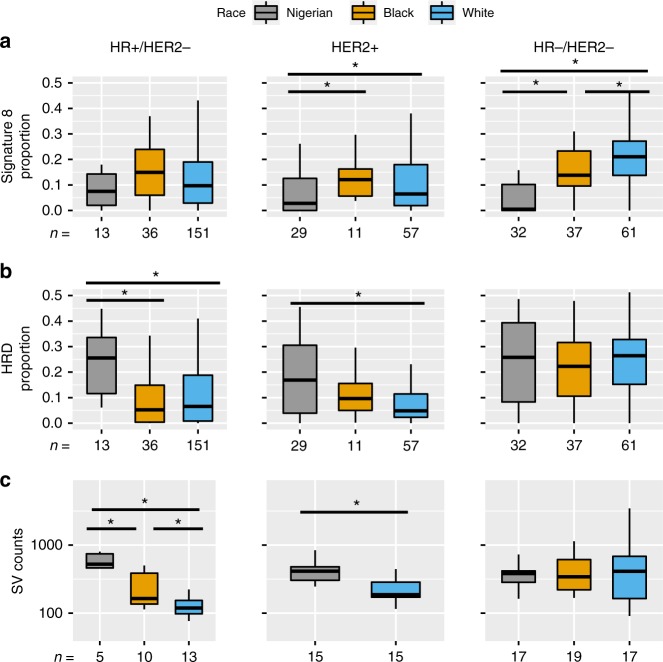
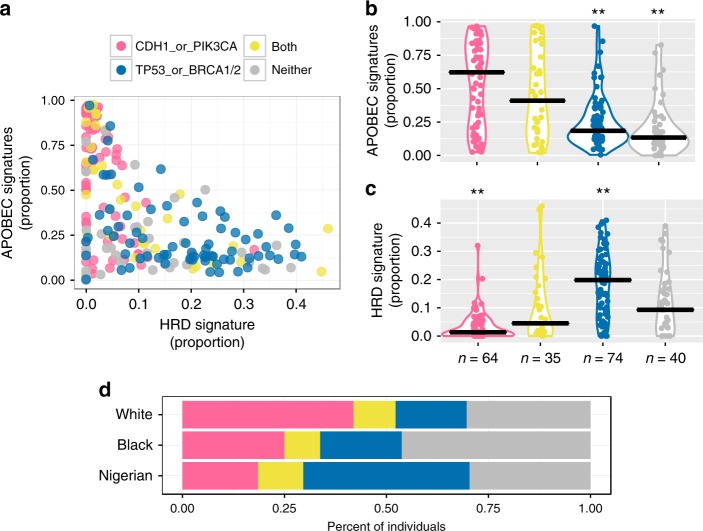
Racial/ethnic disparities in breast cancer mortality continue to widen but genomic studies rarely interrogate breast cancer in diverse populations. Through genome, exome, and RNA sequencing, we examined the molecular features of breast cancers using 194 patients from Nigeria and 1037 patients from The Cancer Genome Atlas (TCGA). Relative to Black and White cohorts in TCGA, Nigerian HR + /HER2 - tumors are characterized by increased homologous recombination deficiency signature, pervasive TP53 mutations, and greater structural variation-indicating aggressive biology. GATA3 mutations are also more frequent in Nigerians regardless of subtype. Higher proportions of APOBEC-mediated substitutions strongly associate with PIK3CA and CDH1 mutations, which are underrepresented in Nigerians and Blacks. PLK2, KDM6A, and B2M are also identified as previously unreported significantly mutated genes in breast cancer. This dataset provides novel insights into potential molecular mechanisms underlying outcome disparities and lay a foundation for deployment of precision therapeutics in underserved populations.


Conflict of interest statement

The authors declare the following competing interests: M.R., A.V., E.L., S.M., R.L., M.M., R.S.J., B.H., KM, M.P.M., W.W., D.P., B.W., and J.B. are all employees of Novartis Institutes for BioMedical Research. K.P.W. serves as President at Tempus. O.I.O is an equity stock holder of CancerIQ and Tempus. All other authors declare no competing interest.

Figures

Fig. 1
Fig. 1
Landscape of breast cancer in Nigerians compared to Black and White Americans. a Proportion of IHC subtypes in the Nigerian, Black, and White cohorts from TCGA and in the SEER database. b Proportion of PAM50 subtypes in Nigerians, Blacks, and Whites. c Comparison of the frequencies of short variants (SNVs and indels) in 44 breast cancer drivers in all cohorts. d Alteration frequencies of 19 genes recurrently affected by CNAs (homozygous deletions and amplifications). e Comparison of key breast cancer drivers stratified by IHC subtype. Both short variants and copy number events are included. f Oncoprint of short mutations and CNAs in Nigerians. Recurrently mutated genes that were altered least 3% of Nigerians are shown. *P < 0.05; **P < 0.001; ***P < 0.0001 (Fisher’s exact with P-values adjusted via the Benjamini–Hochberg method)
Fig. 2
Fig. 2
Mutation signature contributions across race/ethnicity and subtype. a The contribution (proportion) of mutation signatures (Signatures D, E, F, and G are combined into “Other”) within each individual. Individuals are partitioned by race/ethnicity and ordered by APOBEC C > T signature contributions (high to low). The number of individuals representing each cohort is shown. b Mekko plot of the proportional contributions of mutation signatures across IHC subtypes
Fig. 3
Fig. 3
Associations between genome-wide oncogenic features and the mutation status of common driver genes. Dot plot depicting the relationships between mutation status in TP53, PIK3CA, CDH1, and GATA3, and mutation signatures (APOBEC C > T, APOBEC C > G, aging, HRD, and signature 8), missense mutation burden, and copy number (CN) segments a across all IHC subtypes (n = 500) and b within HR +/HER2 − (n = 222). Only TCGA data, including samples lacking mutation signature estimates, was used for CN associations (all subtype n = 1,023; HR +/HER2 − n = 635). No samples were excluded based on race/ethnicity. Comparisons between mutation status and genomic features were performed with Mann–Whitney U and P-values were corrected for multiple testing (Benjamini–Hochberg method). Circle size is proportional to the magnitude of the − log10 BH P-value (i.e., lower BH P-values have larger circles). If mutation status associated with a significant increase or decrease of a genomic feature, the corresponding circle is colored red or blue, respectively. Non-significant (NS) comparisons are colored black
Fig. 4
Fig. 4
Mutation signature contributions and structural variant counts by race/ethnicity and IHC subtype. Mutation signature contributions from a signature 8 and b HRD subdivided by race/ethnicity and IHC subtype. c Boxplots representing the number of SVs identified across WGS samples partitioned by race/ethnicity and IHC subtype. Asterisks denote significant differences (P < 0.05) between groups using Kruskal–Wallis tests followed by post-hoc comparisons with Dunn’s test. Each box represents the upper and lower quartiles of the data, and the median is depicted with a horizontal line. Upper and lower whiskers extend to the largest and smallest values within [1.5 × interquartile range], respectively
Fig. 5
Fig. 5
Driver gene mutations associate with APOBEC and HRD signature balance in HR+/HER2- breast cancer. a For each tumor, the proportion of APOBEC signatures (sum of APOBEC C > T and C > G) by the proportion of HRD is shown. Each patient is colored based on harboring a CDH1 or PIK3CA mutation (pink), a TP53 or BRCA1/2 (including germline) mutation (blue), mutations from both aforementioned categories (yellow), or mutations in neither of the aforementioned categories (gray). These values are decomposed into violin plots for b APOBEC and c HRD signatures, respectively. Horizontal black bars represent the median contribution proportion for each group. Between group comparisons were made using a Kruskal–Wallis test followed by Dunn’s test. Panels ac were not restricted by race/ethnicity. d The proportion of HR +/HER2 − individuals falling into each mutational group by race/ethnicity (n White = 465; n Black = 80; n Nigerian = 27). This also includes samples for which mutation signatures were not estimated. **Groups that were significantly different (P < 0.05) from all three other categories
Fig. 6
Fig. 6
Gene signatures of immune cell infiltration. a Heatmap visualizing gene signature activation in all 1040 patients with RNA-seq data (Nigerian n = 103, Black n = 183, and White n = 754). High signature scores (red) indicate high overall expression of genes in the signatures, whereas low values (blue) indicate low expression. b Distribution of signature scores across PAM50 subtypes and ethnicities. c, d Pairwise Pearson’s correlation of immune signatures as well as potential predictors of response to immunotherapy (APOBEC, HRD, CIN, mutation burden). The Nigerian data are shown in c and the combined Black and White cohorts in d. CIN chromosomal instability; HRD homologous recombination deficiency; IFN interferon. Each box represents the upper and lower quartiles of the data and the median is depicted with a horizontal line. Upper and lower whiskers extend to largest and smallest values within [1.5 × interquartile range], respectively. *P < 0.05; **P < 0.001, ***P < 0.0001 (all adjusted using the Benjamini–Hochberg method)

References

    1. Torre LA, et al. Global cancer statistics, 2012. CA Cancer J. Clin. 2015;65:87–108. doi: 10.3322/caac.21262. - DOI - PubMed
    1. Huo D, et al. Population differences in breast cancer: survey in indigenous African women reveals over-representation of triple-negative breast cancer. J. Clin. Oncol. 2009;27:4515–4521. doi: 10.1200/JCO.2008.19.6873. - DOI - PMC - PubMed
    1. Servick K. Breast cancer. Breast Cancer. 2014;343:1452–1453. - PubMed
    1. Newman LA, et al. African-American ethnicity, socioeconomic status, and breast cancer survival: a meta-analysis of 14 studies involving over 10,000 African-American and 40,000 White American patients with carcinoma of the breast. Cancer. 2002;94:2844–2854. doi: 10.1002/cncr.10575. - DOI - PubMed
    1. Lehmann BD, et al. Identification of human triple-negative breast cancer subtypes and preclinical models for selection of targeted therapies. J. Clin. Invest. 2011;121:2750–2767. doi: 10.1172/JCI45014. - DOI - PMC - PubMed

Publication types