. 2018 Nov;14(11):1021-1031.
doi: 10.1038/s41589-018-0132-2. Epub 2018 Oct 16.

Enzyme promiscuity drives branched-chain fatty acid synthesis in adipose tissues

Affiliations

Enzyme promiscuity drives branched-chain fatty acid synthesis in adipose tissues

Martina Wallace et al. Nat Chem Biol. 2018 Nov.

Abstract

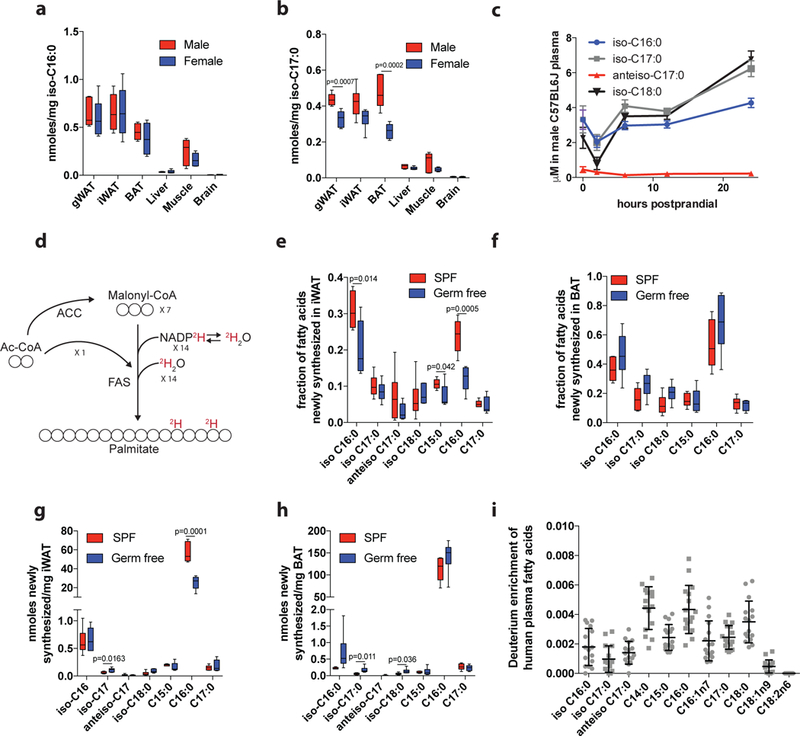
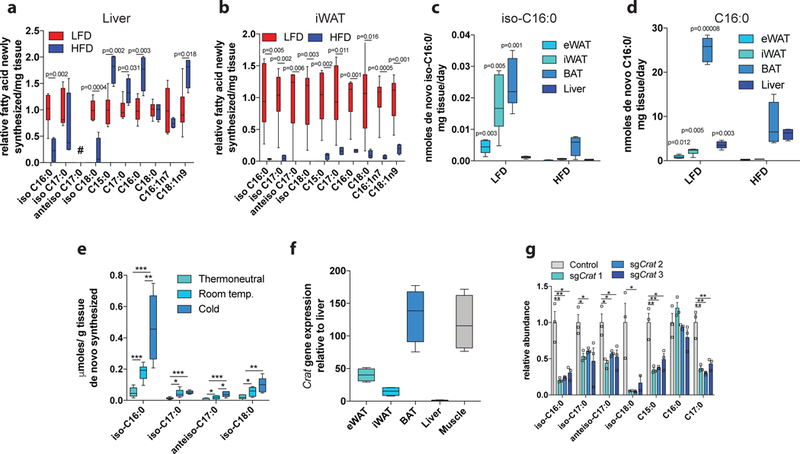
Fatty acid synthase (FASN) predominantly generates straight-chain fatty acids using acetyl-CoA as the initiating substrate. However, monomethyl branched-chain fatty acids (mmBCFAs) are also present in mammals but are thought to be primarily diet derived. Here we demonstrate that mmBCFAs are de novo synthesized via mitochondrial BCAA catabolism, exported to the cytosol by adipose-specific expression of carnitine acetyltransferase (CrAT), and elongated by FASN. Brown fat exhibits the highest BCAA catabolic and mmBCFA synthesis fluxes, whereas these lipids are largely absent from liver and brain. mmBCFA synthesis is also sustained in the absence of microbiota. We identify hypoxia as a potent suppressor of BCAA catabolism that decreases mmBCFA synthesis in obese adipose tissue, such that mmBCFAs are significantly decreased in obese animals. These results identify adipose tissue mmBCFA synthesis as a novel link between BCAA metabolism and lipogenesis, highlighting roles for CrAT and FASN promiscuity influencing acyl-chain diversity in the lipidome.


Figures

Figure 1.
Figure 1.. Mammalian adipocytes synthesize mmBCFAs via fatty acid synthase.
a. mmBCFA abundance in differentiating 3T3L1 adipocytes. b. mmBCFA abundance in 3T3L1 adipocytes differentiated for 7 days +/− 500 nM B12. Two-tailed students t-test was performed on three cellular replicates (p=0.000019) with no adjustment for multiple comparisons. c. Atom-transition map demonstrating isotope incorporation into de novo synthesized fatty acids from [U-13C6]glucose. Closed circles indicate 13C carbon. d. Isotopologue distribution of iso-C16:0 from [U-13C6]glucose traced 3T3L1 cells. e. % enrichment from [U-13C6]isoleucine-derived acetyl-CoA (M1-M2 only) in 3T3L1 adipocytes +/− 100 nM ND646 for 24 hours. f. Atom-transition map depicting transfer of isotope [3-2H]glucose through glycolysis, the pentose phosphate pathway and reductive biosynthesis. Open circles indicate carbon and small red circles indicate deuterium label from [3-2H]glucose. g. Contribution from [3-2H]glucose labelled NADPH to fatty acid de novo synthesis determined via ISA. 3T3L1 adipocytes cultured in tracer for 72 hours. h, Iso-C16:0 levels as % total FA in pooled CRISPR/Cas9 FASN KO 3T3L1 adipocytes following addition of isobutyrate for 24 hours. i. Relative abundances of mmBCFAs and C16:0 in differentiated 3T3L1s following addition of isobutyrate for 24 hours. Two-tailed students t-test was performed on three cellular replicates for each comparison with no adjustment for multiple comparisons. All data are presented as means ± SEM with dot plots overlaid except for g, where 95% confidence intervals from ISA model are shown. All data are representative of three cellular replicates, and each experiment was repeated 3 independent times with the exception of h, where two separate infections were carried out. The same result was obtained in each independent experiment. *p<0.05, **p<0.01, ***p<0.001.
Figure 2.
Figure 2.. BCAA catabolic intermediates drive mmBCFA synthesis.
a. Pathway depicting BCAA catabolism and mmBCFA synthesis. b-d. Isotopologue distributions of b, iso-C16:0 from [U-13C5]valine c, iso-C17:0 from [U-13C6]leucine and d, anteiso-C17:0 from [U-13C6]isoleucine. Representative data from three cell replicates in b-d. e-g. Relative abundance of e, iso-C16:0 f, iso-C17:0 and g, anteiso-C17:0 following knock down of ACAD enzymes. Representative data from six cell replicates in e-g. h. Relative mRNA expression. Representative data shown from three cell replicates. All experiments are carried out in 3T3L1 adipocytes. All experiments were repeated 3 independent times with similar results. Data are presented as means ± SEM with dot plots overlaid (b-d, h) or box (25th to 75th percentile with median line) and whiskers (min to max values) (e-g).
Figure 3.
Figure 3.. mmBCFAs are de novo synthesized in vivo a-b.
Abundance of a, iso-C16:0, and b, iso-C17:0, in various tissues from C57BL/6J male (n=6) and female mice (n=6). c. Plasma concentration of total hydrolyzed mmBCFAs from C57BL/6J male mice (n=8) following removal of food at time 0 (7 am) and sampled at 2hrs, 6hrs, 12hrs and 24hrs. d. Incorporation of 2H2O into newly synthesized fatty acids. e-f. Fractional synthesis of fatty acids in e, iWAT, and f, BAT of germ free (n=6) and SPF mice (n=6). g-h. Amount of newly synthesized fatty acids present in g, iWAT and h, BAT of germ free (n=6) and SPF mice (n=6). i. Deuterium enrichment of plasma FAs in NAFLD patients (n=16) normalized to the area under the curve of plasma 2H2O levels from day 0 to day 21 for each patient. Two-tailed students t-test was performed for each comparison in this figure with no adjustment for multiple comparisons. Data are presented as means ± SEM (c), means ± SD with dot plots overlaid (i), or box (25th to 75th percentile with median line) and whiskers (min to max values) (a-b,e-h).
Figure 4.
Figure 4.. BCAA flux to mmBCFAs is decreased by diet-induced obesity.
a. Relative abundances of FAs in iWAT from C57BL/6J mice fed HFD (n=4) or LFD (n=5) for 15 weeks. b. Total FAs abundances in plasma from C57BL/6J mice fed HFD (n=8) or LFD (n=8) for 15 weeks. c-f, 13C enrichment in specified metabolite from HFD or LFD with 25% of valine and leucine supplied as [U13C,15N]isotope.c. Citrate % 13C enrichment. N=8 for all comparisons except LFD iWAT (n=7), eWAT (n=7), BAT (n=7), heart (n=5) and HFD iWAT (n=4), BAT (n=7), heart (n=4). d. 13C molar enrichment of C16:0. N=8 for all comparisons except LFD eWAT (n=7), heart (n=5) and HFD iWAT (n=7). e. Isotopologue distribution of iso-C16:0 from [U-13C5]valine (HFD n=8, LFD n=8). f. 13C molar enrichment of iso-C16:0. N=8 for all comparisons except HFD iWAT (n=7), liver (n=5) and brain (n=6). Two-tailed students t-test was performed for each comparison in this figure with no adjustment for multiple comparisons. Data are presented as means ± SEM with dot plot overlaid (a-d, f) or box (25th to 75th percentile with median line) and whiskers (min to max values) (e).
Figure 5.
Figure 5.. Adipose tissue mmBCFA synthesis is facilitated by CrAT a-b.
Fold difference in the levels of newly synthesized FAs present in a, liver and b, iWAT. LFD (n=6) and HFD (n=4) for all comparisons in a-b. c. De novo lipogenic turnover of iso-C16:0 across the primary lipogenic tissues. d. De novo lipogenic turnover of C16:0 across the primary lipogenic tissues. LFD (n=6) and HFD (n=4) for all comparisons in c-d except LFD BAT iso C16:0. P values indicate intra-tissue comparison between HFD and LFD. e. Amount of newly synthesized FAs in BAT of mice exposed to thermoneutral (30°C), room temperature (22°C), or acclimatized to severe cold (6°C) over 1 month, (n=6 per group). f. Crat expression relative to liver in tissues from male C57BL/6J mice (n=4). g. relative abundance of total FAs in pooled CRISPR/Cas9 Crat KO 3T3L1 adipocytes. Representative data from three cell replicates. Three independent infections have been carried out with the same result. Data is presented as box (25th to 75th percentile with median line) and whiskers (min to max values) (a-f) or means ± SEM with dot plots overlaid (g). Two-tailed students t-test was performed for each comparison in this figure with no adjustment for multiple comparisons. *p<0.05, **p<0.01, ***p<0.001.
Figure 6.
Figure 6.. Hypoxia suppresses BCAA catabolism and mmBCFA synthesis in adipocytes.
a. Volcano plot of changes in metabolite abundance in 3T3L1 cells exposed to hypoxia (1% O2) or normoxia for 48 hours. 12 cell replicates. b. Glucose and amino acid uptake by 3T3L1 cells in hypoxia (1%) or normoxia. 14 cell replicates for lactate and glucose, 6 cell replicates for glutamine and glutamate, 3 cell replicates for leucine, isoleucine and valine. Two-tailed students t-test was performed for each comparison in a and b with no adjustment for multiple comparisons. c. Mole percent enrichment (MPE) of TCA intermediates from [U-13C] BCAAs in 3T3L1s following 24 hours of tracing in hypoxia (1%) or normoxia. d. Relative contribution of different substrates to lipogenic acetyl-CoA in 3T3L1s as determined by ISA following 24 hours of tracing in hypoxia (1%) or normoxia. e. % of each FA newly synthesized over 24 hours in hypoxia (1%) or normoxia. Three cell replicates are shown in c-e. All experiments in figure have been repeated 3 independent times with the same results. Data are presented as means ± SEM with dot plots overlaid with exception of b where data is presented as box (25th to 75th percentile with median line) and whiskers (min to max values) and d-e, mean +/− 95% confidence interval.

References

    1. Newgard CB et al. A branched-chain amino acid-related metabolic signature that differentiates obese and lean humans and contributes to insulin resistance. Cell Metab 9, 311–26 (2009). - PMC - PubMed
    1. Wang TJ et al. Metabolite profiles and the risk of developing diabetes. Nat Med 17, 448–53 (2011). - PMC - PubMed
    1. Tonjes M et al. BCAT1 promotes cell proliferation through amino acid catabolism in gliomas carrying wild-type IDH1. Nat Med 19, 901–8 (2013). - PMC - PubMed
    1. Overmyer KA et al. Maximal oxidative capacity during exercise is associated with skeletal muscle fuel selection and dynamic changes in mitochondrial protein acetylation. Cell Metab 21, 468–78 (2015). - PMC - PubMed
    1. Herman MA, She P, Peroni OD, Lynch CJ & Kahn BB Adipose tissue branched chain amino acid (BCAA) metabolism modulates circulating BCAA levels. J Biol Chem 285, 11348–56 (2010). - PMC - PubMed

Publication types

MeSH terms