. 2018 Oct 17;2(1):34.
doi: 10.1186/s41747-018-0063-4.

Multicolour imaging with spectral photon-counting CT: a phantom study

Affiliations

Multicolour imaging with spectral photon-counting CT: a phantom study

Salim Si-Mohamed et al. Eur Radiol Exp. .

Abstract

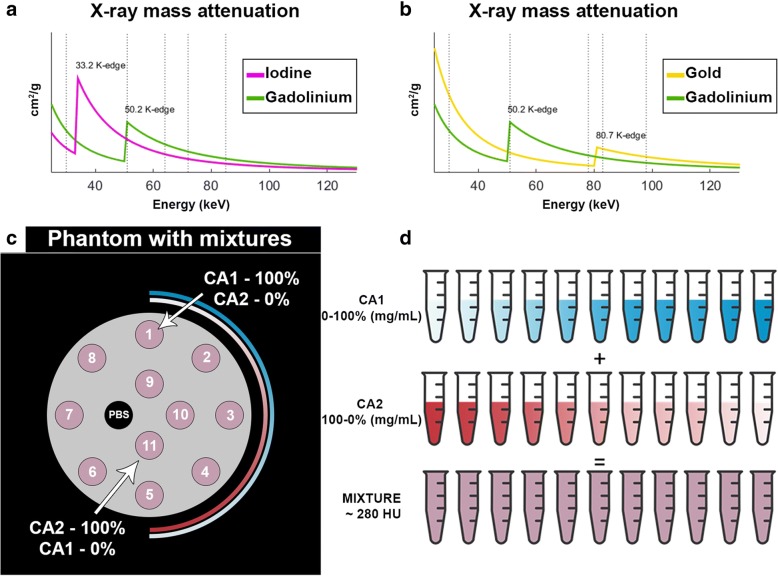
Background: To evaluate the feasibility of multicolour quantitative imaging with spectral photon-counting computed tomography (SPCCT) of different mixed contrast agents.

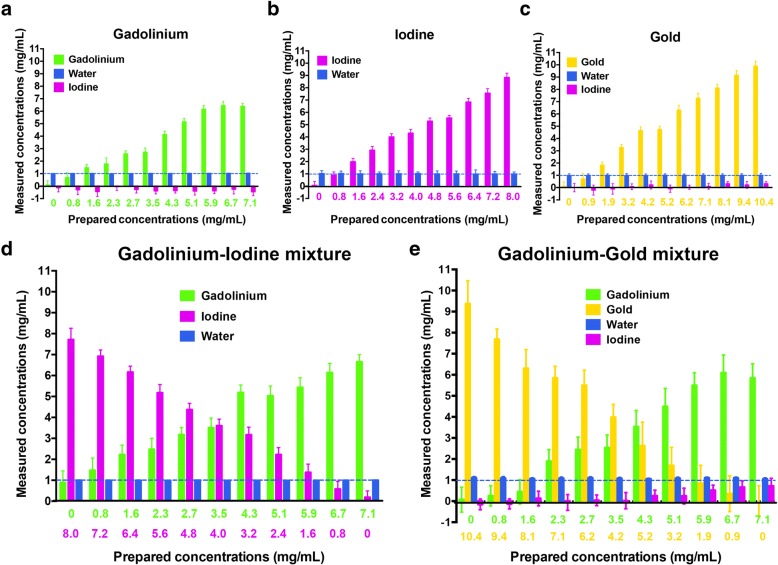
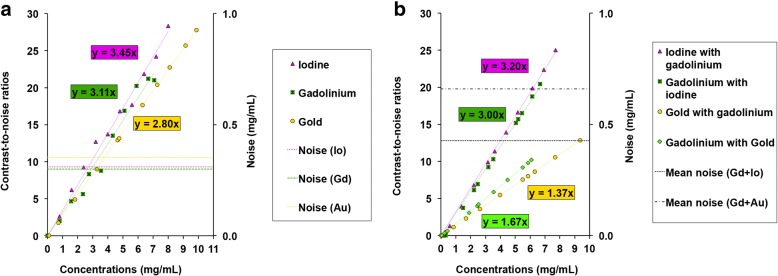
Methods: Phantoms containing eleven tubes with mixtures of varying proportions of two contrast agents (i.e. two selected from gadolinium, iodine or gold nanoparticles) were prepared so that the attenuation of each tube was about 280 HU. Scans were acquired at 120 kVp and 100 mAs using a five-bin preclinical SPCCT prototype, generating conventional, water, iodine, gadolinium and gold images. The correlation between prepared and measured concentrations was assessed using linear regression. The cross-contamination was measured for each material as the root mean square error (RMSE) of its concentration in the other material images, where no signal was expected. The contrast-to-noise ratio (CNR) relative to a phosphate buffered saline tube was calculated for each contrast agent.

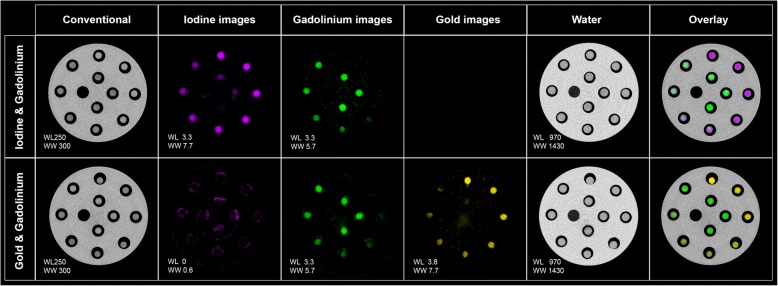
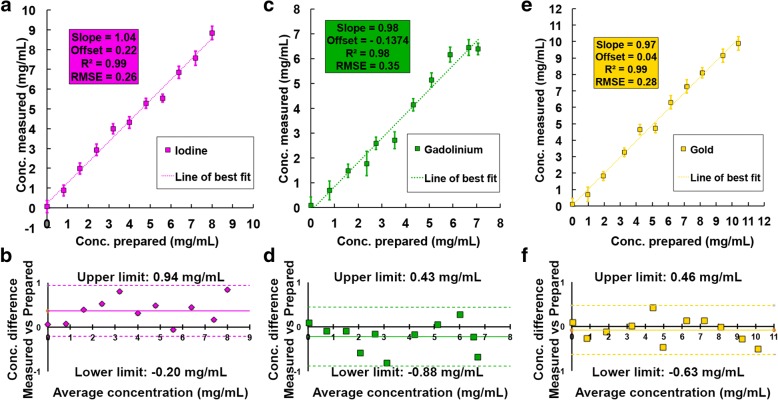
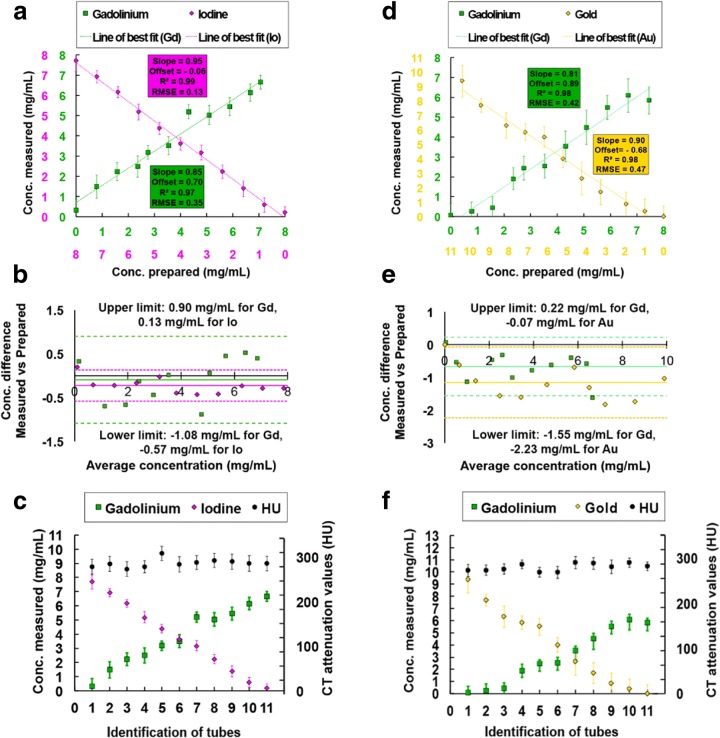
Results: The solutions had similar attenuations (279 ± 10 HU, mean ± standard deviation) and could not be differentiated on conventional images. However, a distinction was observed in the material images within the same samples, and the measured and prepared concentrations were strongly correlated (R2 ≥ 0.97, 0.81 ≤ slope ≤ 0.95, -0.68 ≤ offset ≤ 0.89 mg/mL). Cross-contamination in the iodine images for the mixture of gold and gadolinium contrast agents (RMSE = 0.34 mg/mL) was observed. CNR for 1 mg/mL of contrast agent was better for the mixture of iodine and gadolinium (CNRiodine = 3.20, CNRgadolinium = 2.80) than gold and gadolinium (CNRgadolinium = 1.67, CNRgold = 1.37).

Conclusions: SPCCT enables multicolour quantitative imaging. As a result, it should be possible to perform imaging of multiple uptake phases of a given tissue/organ within a single scan by injecting different contrast agents sequentially.

Keywords: Gadolinium; Gold; Iodine; Phantoms (imaging); Tomography (x-ray computed).


Conflict of interest statement

Ethics approval and consent to participate

Not applicable.

Consent for publication

Not applicable

Competing interests

Philippe Coulon, Michal Rokni, Ewald Roessl, Yoad Yagil and Ami Altman are employees of Philips Healthcare, the manufacturer of the scanner.

Publisher’s Note

Springer Nature remains neutral with regard to jurisdictional claims in published maps and institutional affiliations.

Figures

Fig. 1
Fig. 1
Representation of the K-edge energies and thresholds (dotted lines) used for the characterisation of each element. x-ray mass attenuations of iodine (purple) and gadolinium (green) (a), as well as gold (yellow) and gadolinium (green) (b) are shown with solid lines. c, d Eleven tubes of mixed contrast agents were prepared. The solutions were organised in a spiral, such that contrast agent 1 (in blue) was prepared at a decreasing concentration while contrast agent 2 (in red) was prepared at an increasing concentration. The tubes in the phantom have the same colour on the schema because of their same-targeted CT attenuation values (~ 280 HU)
Fig. 2
Fig. 2
Spectral photon-counting images of conventional, iodine (purple), gadolinium (green), gold (yellow) and water for both sets of mixed contrast agents. Top: iodine–gadolinium mixture; bottom: gold–gadolinium mixture; conventional image units are HU and material images (water, iodine, gold, gadolinium) units are mg/mL. Note that no gold image was generated from the material decomposition process for the iodine–gadolinium mixture, whereas an iodine image was generated from the material decomposition process for the gadolinium–gold mixture
Fig. 3
Fig. 3
Measurements of the concentrations of contrast agents in the unmixed solutions. The concentrations of iodine (purple) (a, b), gadolinium (green) (c, d) and gold (yellow) (e, f) were measured in their respective unmixed solutions. a, c, e Linear regression; b, d, f Bland–Altman analysis. Note the linear correlations and the slope values approaching 1 for all contrast agents
Fig. 4
Fig. 4
Measurements of the concentrations of contrast agents and attenuation values in the mixed solutions. The concentrations of each contrast agent were measured within the gadolinium–iodine (a, b, c) and gadolinium–gold (d, e, f) mixtures. a, d Linear regression; b, e: Bland–Altman analysis; c, f: graphs of the mean ± standard deviation of attenuation values and concentrations. Note that, as expected, the measured concentrations in the tubes varied inversely between the two mixed contrast agents
Fig. 5
Fig. 5
Cross-contamination in the contrast agent images. The graph bars show the concentrations (mean ± standard deviation) of water (blue), iodine (purple), gadolinium (green) and gold (yellow) measured by the system, in each contrast material images, as a function of the prepared concentrations within the unmixed (a, gadolinium; b, iodine; c, gold) and mixed (d, gadolinium–iodine; e, gadolinium–gold) solutions. The blue dotted line represents the concentration of water expected in each solution (1000 mg/mL). Note the slight cross-contamination in the iodine image for the gadolinium–gold mixture that increases with increasing concentration of gadolinium, but not gold
Fig. 6
Fig. 6
CNRs of the contrast agents. The graphs represent the CNR values depending on the concentration of the contrast agent and the noise values of the contrast agents measured in their respective contrast material maps within the unmixed (a) and mixed (b) solutions. The dotted lines represent the noise measured in a tube filled with PBS only within the contrast material images. Mean noise is the mean of the noise measured within the two contrast material images of each mixture

References

    1. Schlomka JP, Roessl E, Dorscheid R, et al. Experimental feasibility of multi-energy photon-counting K-edge imaging in pre-clinical computed tomography. Phys Med Biol. 2008;53:4031–4047. doi: 10.1088/0031-9155/53/15/002. - DOI - PubMed
    1. Cole Lisa E, Ross Ryan D, Tilley Jennifer MR, Vargo-Gogola Tracy, Roeder Ryan K. Gold nanoparticles as contrast agents in x-ray imaging and computed tomography. Nanomedicine. 2015;10(2):321–341. doi: 10.2217/nnm.14.171. - DOI - PubMed
    1. Hong SR, Chang S, Im DJ, et al. Feasibility of single scan for simultaneous evaluation of regional krypton and iodine concentrations with dual-energy CT: an experimental study. Radiology. 2016;281:597–605. doi: 10.1148/radiol.16152429. - DOI - PubMed
    1. Altman A, Carmi R. TU-E-210A-03: A Double-Layer Detector, Dual-Energy CT - Principles, Advantages and Applications. Medical Physics. 2009;36(6Part24):2750–2750. doi: 10.1118/1.3182434. - DOI
    1. McCollough Cynthia H., Leng Shuai, Yu Lifeng, Fletcher Joel G. Dual- and Multi-Energy CT: Principles, Technical Approaches, and Clinical Applications. Radiology. 2015;276(3):637–653. doi: 10.1148/radiol.2015142631. - DOI - PMC - PubMed

LinkOut - more resources