. 2019 Sep 1;527(13):2146-2157.
doi: 10.1002/cne.24560. Epub 2018 Nov 23.

Whole mouse brain connectomics

Affiliations

Whole mouse brain connectomics

G Allan Johnson et al. J Comp Neurol. .

Abstract

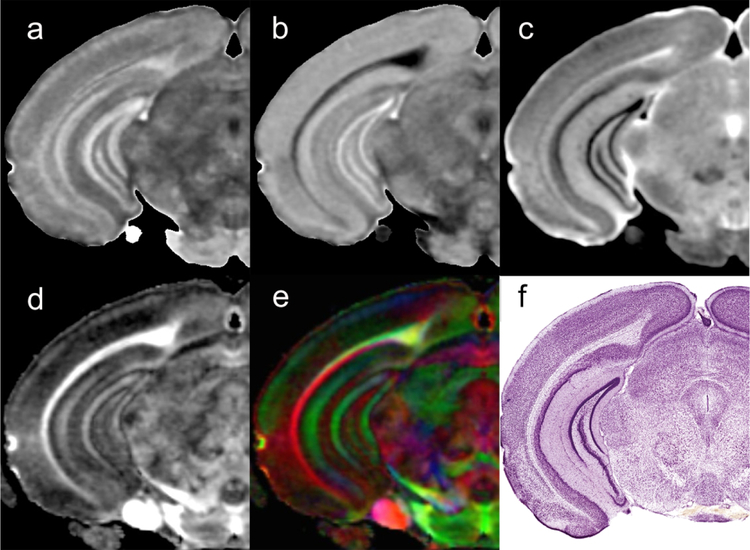
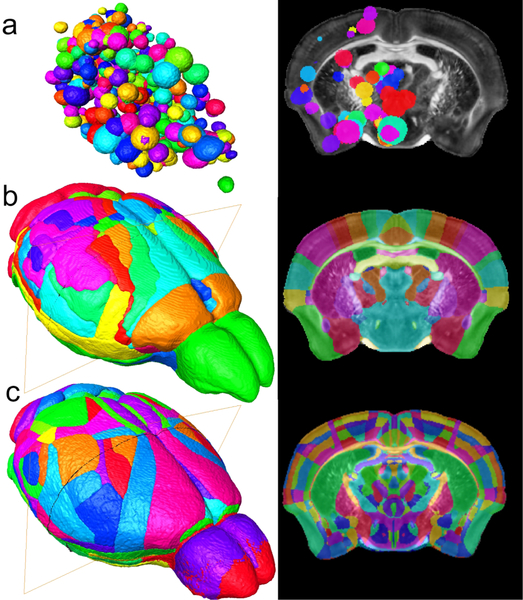
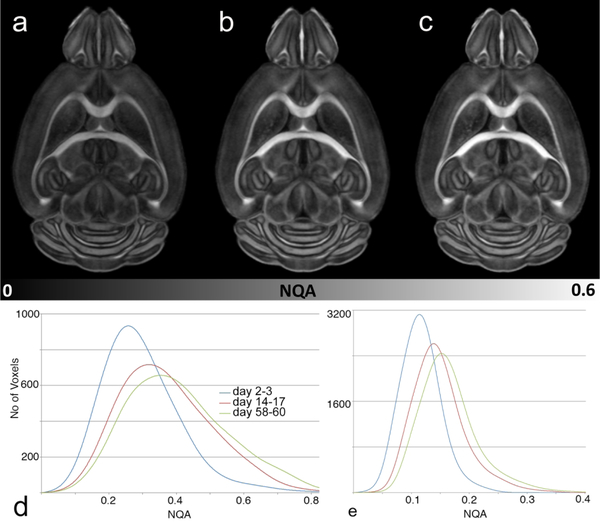
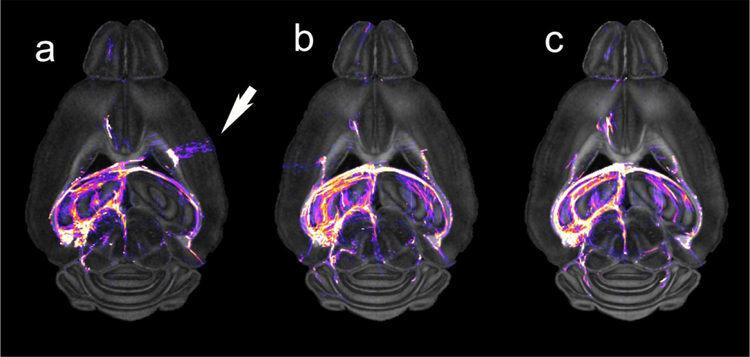
Methods have been developed to allow quantitative connectivity of the whole fixed mouse brain by means of magnetic resonance imaging (MRI). We have translated what we have learned in clinical imaging to the very special domain of the mouse brain. Diffusion tensor imaging (DTI) of perfusion fixed specimens can now be performed with spatial resolution of 45 μm3 , that is, voxels that are 21,000 times smaller than the human connectome protocol. Specimen preparation has been optimized through an active staining protocol using a Gd chelate. Compressed sensing has been integrated into high performance reconstruction and post processing pipelines allowing acquisition of a whole mouse brain connectome in <12 hr. The methods have been validated against retroviral tracer studies. False positive tracts, which are especially problematic in clinical studies, have been reduced substantially to ~28%. The methods have been streamlined to provide high-fidelity, whole mouse brain connectomes as a routine study. The data package provides holistic insight into the mouse brain with anatomic definition at the meso-scale, quantitative volumes of subfields, scalar DTI metrics, and quantitative tractography.

Keywords: Connectomes; MR histology; MRI; mouse brain.


Conflict of interest statement

CONFLICT OF INTEREST

None.

Figures

Figure 1
Figure 1
Scalar images from the Trackvis pipeline are used to drive the registration of the seed labels for the connectome: a) axial diffusivity (AD); b) radial diffusivity(RD); c) mean diffusivity; d) fractional anisotropy (FA); e) color fractional anisotropy (clrFA). For comparison, a histological section stained for Nissl substance (Plate 59 reprinted from (Paxinos and Franklin, 2012) , with permission from Elsevier).
Figure 2
Figure 2
Seed regions are a critical determinant of the connectome. a) Seed regions (i.e., retroviral injection sites) from the ABCA have been mapped into the MR images of Waxhom Space, with spherical dimensions estimated from the volume of injected tracer. b) Seed regions from Waxholm Space have been derived from anatomic landmarks visible in the scalar images (Figure 1). c) Recent work has resulted in a merger of Waxholm Space canonical MR images with a new set of delineations from ABA (version 3). This will facilitate harmonization of connectomics data with gene expression.
Figure 3
Figure 3
Fixation and diffusion of the contrast agent induce change in tissue properties. a) NQA image at 2–3 days after perfusion fixation, b) 14–17 days after fixation; c) 58–60 days after fixation show increase of the NQA over time. d) Histogram of all the white matter shows a shift in NQA from day 2–3 to day 14–17 and day 58–60. d) Histogram of NQA in the isocortex demonstrates a shift even in the cortical areas that has profound impact on the resulting tractography.
Figure 4
Figure 4
Dorsal NQA image from a C57BL/6J mouse acquired with a) 16 angles; b) 46 angles; c) 120 angles demonstrate the value of increased angular sampling. Tractography was generated by seeding the left hippocampus. The white arrow highlights a false positive tract in the 16-angle data that does not appear in the 46 and 120 angle data.
Figure 5
Figure 5
Connectomes generated from a) our foundation set with full k space sampling and 120 angular samples (235 hour acquisition) and b) the accelerated acquisition protocol acquired with compressed sampling and 46 angular samples (11.6 hour acquisition) have a correlation coefficient of 0.97.
Figure 6
Figure 6
Tractography from the somatosensory cortex of a) a single C57BL/6J male mouse and b) a group average (n=4) produced with q space diffeomorphic reconstruction demonstrate improved sensitivity of group analysis.
Figure 7
Figure 7
The whole brain protocol allows one to compare strains with several different perspectives. The comparison of C57BL/6J-top (a) and BTBR-bottom (d) in a dorsal color FA slice shows disruption of the corpus callosum and hippocampal commissure. Comparison of whole brain tractography (b-C57BL/6J and e-BTBR) shows significant global difference in tract organization. Connectome matrices (c-C57BL/6J and f-BTBR) shows quantitative differences in connectivity across the entire brain.
Figure 8
Figure 8
Comparison of tractography within the forelimb representation of the right primary somatosensory cortex in two murine strains (individual specimens): C57BL/J6 (a), a common mouse model in biomedical research, and BTBR (b) a murine model that bears phenotypic resemblance to human autism spectrum disorders (Meyza and Blanchard, 2017, Scattoni et al., 2008). Images to the far left and right in (a) and (b) show tractography as seen from the dorsal aspect of the mouse brain; Insets localize the forelimb representations. Dashed lines identify the locations of coronal NQA images from the same datasets with in-plane streamlines superimposed. Note strain-specific differences in commissural connections and longitudinal associational connections in the ipsilateral hemispheres.

References

    1. A TV, JAMISON K, GLASSER MF, SMITH SM, COALSON T, MOELLER S, AUERBACH EJ, UGURBIL K & YACOUB E 2017. Tradeoffs in pushing the spatial resolution of fMRI for the 7T Human Connectome Project. Neuroimage, 154, 23–32. - PMC - PubMed
    1. AVANTS BB, EPSTEIN CL, GROSSMAN M & GEE JC 2008. Symmetric diffeomorphic image registration with cross-correlation: evaluating automated labeling of elderly and neurodegenerative brain. Med Image Anal, 12, 26–41. - PMC - PubMed
    1. AVANTS BB, T. N SONG G, COOK PA, KLEIN A, GEE JC 2011. reproducible evaluation of ANTs similarity metric performance in brain image registration. Neuroimage, 54, 2033–2044. - PMC - PubMed
    1. AYDOGAN DB, JACOBS R, DULAWA S, THOMPSON SL, FRANCOIS MC, TOGA AW, DONG H, KNOWLES JA & SHI Y 2018. When tractography meets tracer injections: a systematic study of trends and variation sources of diffusion-based connectivity. Brain Struct Funct, 223, 2841–2858. - PMC - PubMed
    1. AZADBAKHT H, PARKES LM, HAROON HA, AUGATH M, LOGOTHETIS NK, DE CRESPIGNY A, D’ARCEUIL HE & PARKER GJ 2015. Validation of High-Resolution Tractography Against In Vivo Tracing in the Macaque Visual Cortex. Cereb Cortex, 25, 4299–309. - PMC - PubMed

Publication types

MeSH terms