. 2018 Oct;9(5):987-1002.
doi: 10.1002/jcsm.12354. Epub 2018 Oct 16.

Protein imbalance in the development of skeletal muscle wasting in tumour-bearing mice

Affiliations

Protein imbalance in the development of skeletal muscle wasting in tumour-bearing mice

Jacob L Brown et al. J Cachexia Sarcopenia Muscle. 2018 Oct.

Erratum in

  • Corrigendum.
    [No authors listed] [No authors listed] J Cachexia Sarcopenia Muscle. 2019 Jun;10(3):712. doi: 10.1002/jcsm.12464. J Cachexia Sarcopenia Muscle. 2019. PMID: 31246374 Free PMC article. No abstract available.

Abstract

Background: Cancer cachexia occurs in approximately 80% of cancer patients and is a key contributor to cancer-related death. The mechanisms controlling development of tumour-induced muscle wasting are not fully elucidated. Specifically, the progression and development of cancer cachexia are underexplored. Therefore, we examined skeletal muscle protein turnover throughout the development of cancer cachexia in tumour-bearing mice.

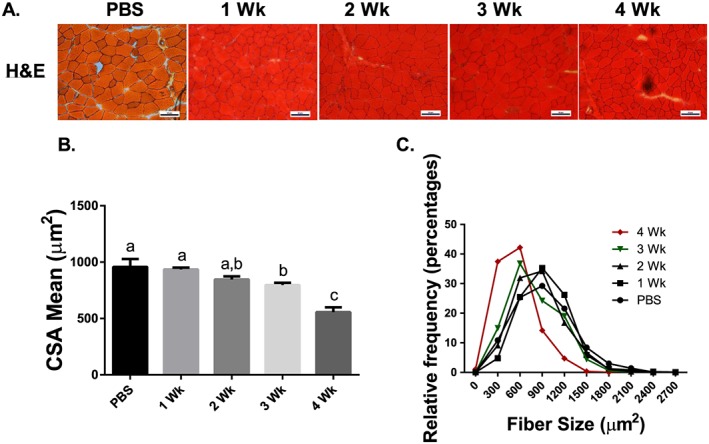
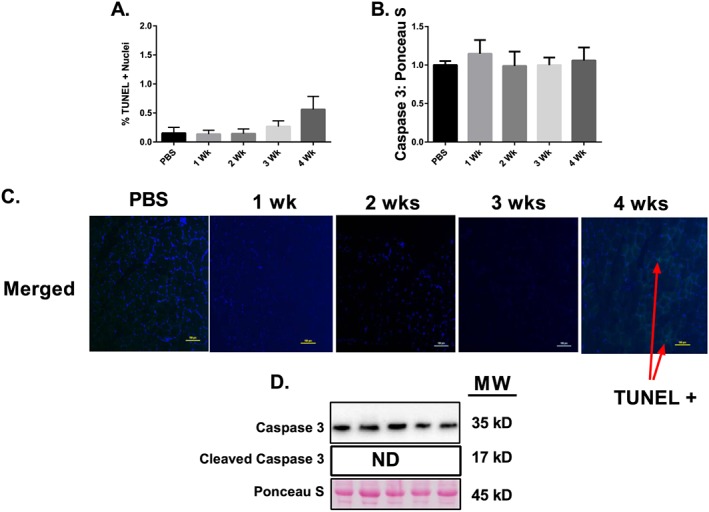
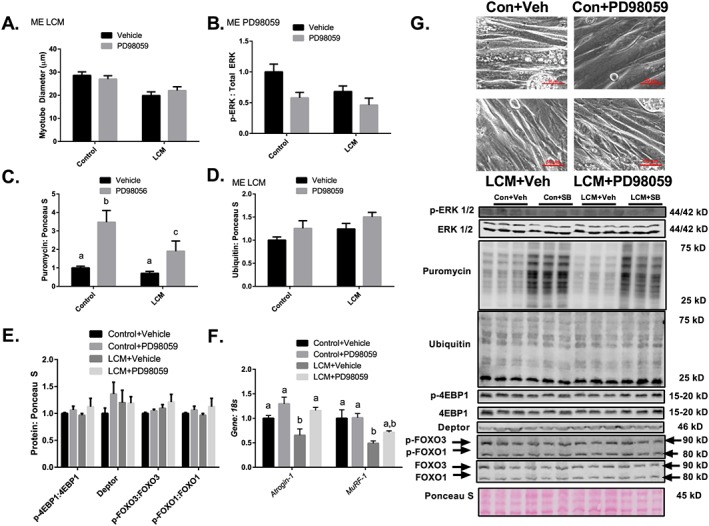
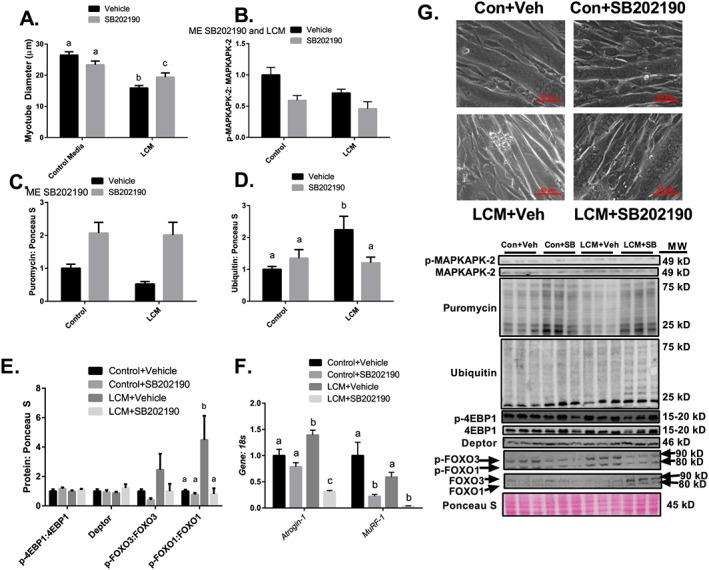
Methods: Lewis lung carcinoma (LLC) was injected into the hind flank of C57BL6/J mice at 8 weeks age with tumour allowed to develop for 1, 2, 3, or 4 weeks and compared with PBS injected control. Muscle size was measured by cross-sectional area analysis of haematoxylin and eosin stained tibialis anterior muscle. 2 H2 O was used to assess protein synthesis throughout the development of cancer cachexia. Immunoblot and RT-qPCR were used to measure regulators of protein turnover. TUNEL staining was utilized to measure apoptotic nuclei. LLC conditioned media (LCM) treatment of C2C12 myotubes was used to analyse cancer cachexia in vitro.

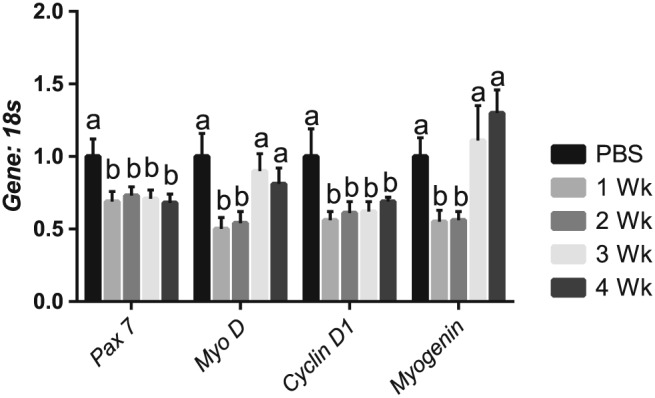
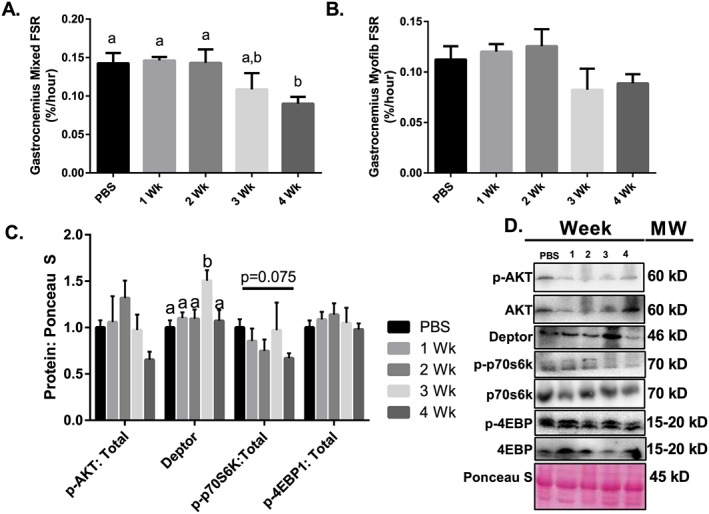
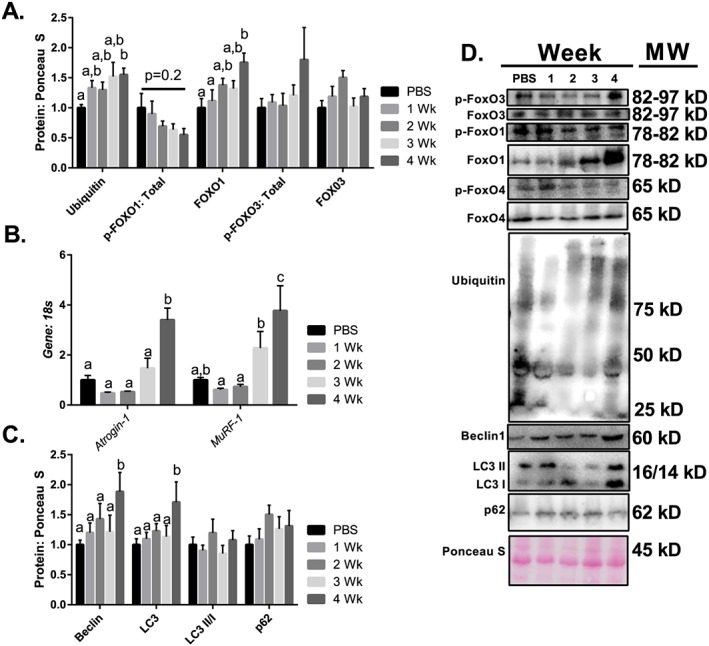
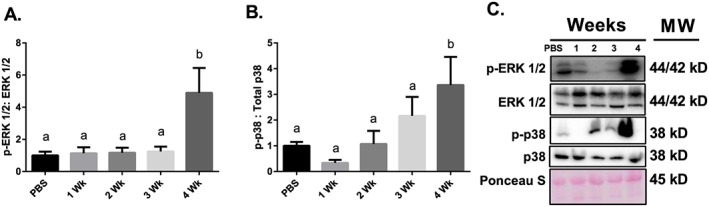
Results: Muscle cross-sectional area decreased ~40% 4 weeks following tumour implantation. Myogenic signalling was suppressed in tumour-bearing mice as soon as 1 week following tumour implantation, including lower mRNA contents of Pax7, MyoD, CyclinD1, and Myogenin, when compared with control animals. AchRδ and AchRε mRNA contents were down-regulated by ~50% 3 weeks following tumour implantation. Mixed fractional synthesis rate protein synthesis was ~40% lower in 4 week tumour-bearing mice when compared with PBS controls. Protein ubiquitination was elevated by ~50% 4 weeks after tumour implantation. Moreover, there was an increase in autophagy machinery after 4 weeks of tumour growth. Finally, ERK and p38 MAPK phosphorylations were fourfold and threefold greater than control muscle 4 weeks following tumour implantation, respectively. Inhibition of p38 MAPK, but not ERK MAPK, in vitro partially rescued LCM-induced loss of myotube diameter.

Conclusions: Our findings work towards understanding the pathophysiological signalling in skeletal muscle in the initial development of cancer cachexia. Shortly following the onset of the tumour-bearing state alterations in myogenic regulatory factors are apparent, suggesting early onset alterations in the capacity for myogenic induction. Cancer cachexia presents with a combination of a loss of protein synthesis and increased markers of protein breakdown, specifically in the ubiquitin-proteasome system. Also, p38 MAPK may be a potential therapeutic target to combat cancer cachexia via a p38-FOX01-atrogene-ubiquitin-proteasome mechanism.

Keywords: ERK; LLC; MAPK; Protein synthesis; Ubiquitin; p38.


Figures

Figure 1
Figure 1
Cross‐sectional area throughout the progression of cancer cachexia. (A) Haematoxylin and eosin staining sample images (scale 50 μM). (B) Mean CSA of TA muscle fibres throughout the progression of cancer cachexia. (C) Histogram of fibre sizes throughout the progression of cancer cachexia. N of 7–8 was utilized for each group. Lettering denotes statistical significance (means that do not share the same letter are statistically different) at an alpha set at P < 0.05.
Figure 2
Figure 2
Satellite cell and myogenic markers are impaired throughout the development of cachexia. (A) Pax 7 mRNA content throughout the progression of cancer cachexia. MyoD mRNA content throughout the progression of cancer cachexia. CyclinD1 content throughout the progression of cancer cachexia. MyoG content throughout the progression of cancer cachexia. N of 7–8 was utilized for each group. Lettering denotes statistical significance (means that do not share the same letter are statistically different) at an alpha set at P < 0.05.
Figure 3
Figure 3
Protein synthesis throughout the progression of cancer cachexia. (A) Mixed FSR throughout the progression of cancer cachexia. (B) Myofibrilar FSR throughout the progression of cancer cachexia. (C) AKT phosphorylation relative to total protein content. Deptor protein content throughout the progression or cancer cachexia. 4EBP1 phosphorylation relative to total protein content. p70s6k phosphorylation relative to total protein content. (D) Sample images for immunoblot analysis. N of 7–8 was utilized for each group. Lettering denotes statistical significance (means that do not share the same letter are statistically different) at an alpha set at P < 0.05.
Figure 4
Figure 4
Protein breakdown throughout the progression of cancer cachexia. (A) Protein ubiquitination throughout the progression of cancer cachexia. FOXO1 protein content throughout the progression of cancer cachexia. Phosphorylation of FOXO1 relative to total protein content throughout the progression of cancer cachexia. (B) Atrogin1 mRNA content throughout the progression of cancer cachexia. (B) MuRF1 mRNA content throughout the progression of cancer cachexia. (C) Beclin1 protein content throughout the progression of cancer cachexia. (C) Total LC3 protein content throughout the progression of cancer cachexia. (C) LC3 II/I ratio throughout the progression of cancer cachexia. (C) p62 protein content throughout the progression of cancer cachexia. (D) Representative immunoblot images. N of 7–8 was utilized for each group. Lettering denotes statistical significance (means that do not share the same letter are statistically different) at an alpha set at P < 0.05.
Figure 5
Figure 5
Apoptosis throughout the progression of cancer cachexia. (A) Percent TUNEL + Nuclei throughout the progression of cancer cachexia. (B) Total caspase 3 protein content throughout the progression of cancer cachexia. (C) Sample images for the TUNEL assay including a positive control image. (D) Representative immunoblot images. N of 7–8 per group was utilized. Lettering denotes statistical significance (means that do not share the same letter are statistically different) at an alpha set at P < 0.05.
Figure 6
Figure 6
MAPK signalling throughout the progression of cancer cachexia. (A) ERK MAPK phosphorylation relative to total protein content. (B) p38 MAPK phosphorylation relative to total protein content. (C) Representative immunoblot images. N of 7–8 per group was utilized. Lettering denotes statistical significance (means that do not share the same letter are statistically different) at an alpha set at P < 0.05.
Figure 7
Figure 7
Inhibition of ERK–MAPK does not protect against LCM mediated loss of myotube diameter despite promoting protein synthesis. (A) Myotube diameter analysis of Control Media + Vehicle, Control Media + PD98059, LCM + Vehicle, and LCM + PD98059. (B) ERK MAPK phosphorylation relative to total protein content following 18 h of Control Media + Vehicle, Control Media + PD98059, LCM + Vehicle, and LCM + PD98059 treatment. (C) Puromycin incorporation for groups Control Media + Vehicle, Control Media + PD98059, LCM + Vehicle, and LCM + PD98059 after 30 min puromycin treatment following 18 h of treatments. (D) Protein ubiquitination following 18 h of Control Media + Vehicle, Control Media + PD98059, LCM + Vehicle, and LCM + PD98059 treatment. (E) Protein content of p‐4EBP1 relative to total 4EBP1, Deptor, p‐FOXO3 relative to total FOXO3, and p‐FOXO1 content relative to total FOXO1 following 18 h of Control Media + Vehicle, Control Media + PD98059, LCM + Vehicle, and LCM + PD98059 treatment. (F) Atrogin‐1 and MuRF‐1 mRNA content following 18 h of Control Media + Vehicle, Control Media + PD98059, LCM + Vehicle, and LCM + PD98059 treatment. All measured in C2C12 myotubes and normalized to and Ponceau S. Data are mean ± SEM. (G) Representative micrograph and immunoblot images for each protein of interest taken in order from same membrane. N of 6 was utilized for each group. Lettering denotes statistical significance (means that do not share the same letter are statistically different) at an alpha set at P < 0.05. ME indicates statistical Main Effect of indicated factor(s).
Figure 8
Figure 8
Inhibition of p38 MAPK partially protects against LCM‐mediated loss of myotube diameter. (A) Myotube diameter analysis of Control Media + Vehicle, Control Media + SB202190, LCM + Vehicle, and LCM + SB202190. (B) MAPKAPK‐2 phosphorylation relative to total protein content following 18 h of treatments. (C) Puromycin incorporated for groups Control Media + Vehicle, Control Media + SB202190, LCM + Vehicle, and LCM + SB202190 after 30 min puromycin treatment following 18 h of treatments. (D) Protein content of ubiquitin following 18 h of Control Media + Vehicle, Control Media + SB202190, LCM + Vehicle, or LCM + SB202190 treatment. (E) Protein content of p‐4EBP1 relative to total 4EBP1, Deptor, p‐FOXO3 relative to total FOXO3, and p‐FOXO1 content relative to total FOXO1 following 18 h of Control Media + Vehicle, Control Media + SB202190, LCM + Vehicle, or LCM + SB202190 treatment. (F) Atrogin‐1 and MuRF‐1 mRNA content following 18 h of Control Media + Vehicle, Control Media + SB202190, LCM + Vehicle, or LCM + SB202190 treatment. All measured in C2C12 myotubes and normalized to and Ponceau S. Data are mean ± SEM. (G) Representative micrographs and immunoblot images for each protein of interest taken in order from same membrane. N of 6 was utilized for each group. Lettering denotes statistical significance (means that do not share the same letter are statistically different) at an alpha set at P < 0.05. ME indicates statistical Main Effect of indicated factor(s).

References

    1. Ferlay J, Soerjomataram I, Dikshit R, Eser S, Mathers C, Rebelo M, et al. Cancer incidence and mortality worldwide: sources, methods and major patterns in GLOBOCAN 2012. Int J Cancer 2015;136:E359–E386. - PubMed
    1. Fitzmaurice C, Dicker D, Pain A, Hamavid H, Moradi‐Lakeh M, MacIntyre MF, et al. The Global Burden of Cancer 2013. JAMA Oncol 2015;1:505–527. - PMC - PubMed
    1. Fearon Kenneth CH, Glass David J, Guttridge DC. Cancer cachexia: mediators, signaling, and metabolic pathways. Cell Metab 2012;16:153–166. - PubMed
    1. Onesti JK, Guttridge DC. Inflammation based regulation of cancer cachexia. Biomed Res Int 2014;2014:168407. - PMC - PubMed
    1. Fearon K, Strasser F, Anker SD, Bosaeus I, Bruera E, Fainsinger RL, et al. Definition and classification of cancer cachexia: an international consensus. Lancet Oncol 2011;12:489–495. - PubMed

Publication types