Review
. 2018 Nov 26;47(23):8512-8524.
doi: 10.1039/c8cs00106e.

Single-molecule protein sensing in a nanopore: a tutorial

Affiliations
Review

Single-molecule protein sensing in a nanopore: a tutorial

Nitinun Varongchayakul et al. Chem Soc Rev. .

Abstract

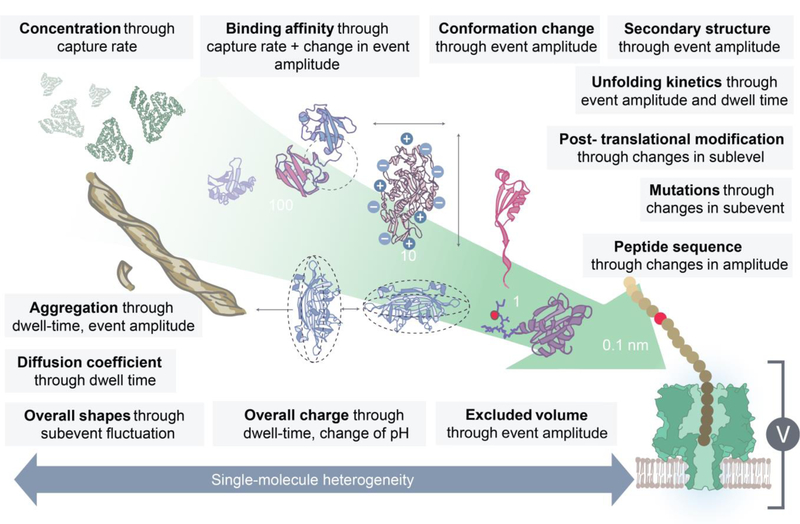
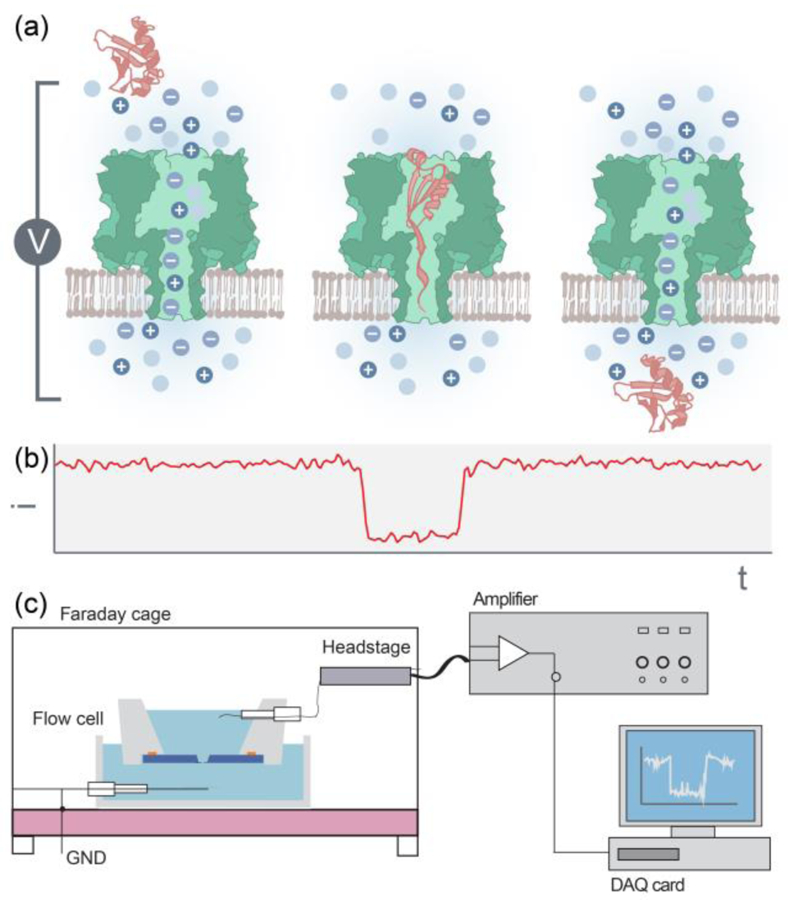
Proteins are the structural elements and machinery of cells responsible for a functioning biological architecture and homeostasis. Advances in nanotechnology are catalyzing key breakthroughs in many areas, including the analysis and study of proteins at the single-molecule level. Nanopore sensing is at the forefront of this revolution. This tutorial review provides readers a guidebook and reference for detecting and characterizing proteins at the single-molecule level using nanopores. Specifically, the review describes the key materials, nanoscale features, and design requirements of nanopores. It also discusses general design requirements as well as details on the analysis of protein translocation. Finally, the article provides the background necessary to understand current research trends and to encourage the identification of new biomedical applications for protein sensing using nanopores.


Conflict of interest statement

Conflicts of interest

There are no conflicts to declare.

Figures

Figure 1.
Figure 1.
The protein biochemical/biophysical information obtained from a nanopore sensor. The information is ranked according to its length scale. For example, the concentration of the bulk solution protein is obtained by measuring the translocation rate. Nanopore sensing enables measurement of an enzyme and protein’s binding kinetics, oligomeric formation,, and aggregation kinetics. Once the pool of events are collected, the information about protein’s diffusion coefficient, overall charge, volume and shapes is estimated., Small nanopores are used to sense protein conformational changes,, unfolding pathway,, domain structures,, post-translational modifications,,, and mutations, as well as to identify peptide sequences. A major advantage of using this single-molecule technique is the collection of data on individual biomacromolecules.
Figure 2.
Figure 2.
A schematic view of single-molecule nanopore sensing techniques. (a) Ions flow freely across the nanopore due to an applied electric field. Physical blockage of a protein of interest obstructs the ion flow, resulting in a drop in the pore’s current. The current is restored once the protein leaves the pore. (b) A representative event as a result of a single protein translocation. (c) Nanopore sensor experimental setup. The nanopore sensor resides in a Faraday cage to prevent external noise. The sensor is connected to a headstage, which transduces the current signal to an amplifier and to a data acquisition (DAQ) card. The data is then processed using a program to extract the nanopore events from the current trace as well as obtain the event characteristics.
Figure 3.
Figure 3.
Cartoon illustrating nanopore operation. Translocating an elephant vs an ant through a door.
Figure 4.
Figure 4.
Basic nanopore signal processing. Example translocations of a model protein. (a) Representative current trace (I) as a function of time (t). Each drop in current is defined as a nanopore event. (b) The time between the start of each event is defined as the inter-event interval (ti), which is fitted by an exponential decay function. (c) The event dwell time (tD) histogram is fitted by either drift-diffusion model or exponential decay function. (d) The ratio between event amplitude (ib) and open pore current (io) is fitted by multimodal distribution. (e) The scatter plot of IB vs tD is used to perform single-molecule protein classification.
Figure 5.
Figure 5.
Probing binding states between DNA and a transcription factor (TF) using a solid-state nanopore. The 1 kbp DNA contains a single binding site for TF zif268. When the TF binds to the DNA specifically (top panel), the DNA backbone leads to a current drop from io to iA and the deeper blockage level at iB represents the tightly bound TF. In the non-specific binding state (bottom panel), the TF slides along the DNA backbone, creating a distinct blockage level at iC. Adapted with permission from A. Squires, E. Atas, and A. Meller, Sci. Rep., 2015, 5(April), 11643, under Creative Commons Attribution 4.0 International license, Nature Publishing.
Figure 6.
Figure 6.
Characterization of protein (a) domains and (b) oligomeric states using nanopores. In the example shown in (a), three variants of Smt3 protein were labelled as i, ii and iii as shown on the left. Their corresponding translocation events revealed multiple ionic current blockage levels on the right. The sub-events were categorized into 7 stages, with stage 4 and stage 7 representing the translocation of the unfolded Smt7 protein. The events shown in (a) are also examples of nanopore-induced protein unfolding discussed in section 4.3. Adapted with permission from J. Nivala, D. B. Marks, and M. Akeson, Nat. Biotechnol., 2013, 31(3), 247–50. Copyright 2013, Nature Publishing. In (b), the monomeric, dimeric and trimeric states of VEGF exhibited moderate (yellow), intermediate (red) and deep (blue) current blockage levels that correspond to their sizes. After the addition of TCEP, a disulfide bonds reducing agent, the dimeric and trimeric VEGF proteins were converted into the monomeric state. Adapted with permission from N. Varongchayakul, D. Huttner, M. W. Grinstaff, and A. Meller, Sci. Rep., 2018, 8(1), 1017, under Creative Commons Attribution 4.0 International license, Nature Publishing.
Figure 7.
Figure 7.
Detecting thioredoxin protein in native and three different phosphorylation states using an α-hemolysin nanopore. (a) Representation event trace shows multistep translocation. (b) The scatter plot of the fractional blockade current (IB) vs. subevent noise (in) at level 3 of the four thioredoxin constructs revealed four unique populations highlighted in blue, green, black and red, which correspond to the native and three different phosphorylation states of thioredoxin. The red circles signify the number and position of phosphorylated residues on the protein. Each protein is also tagged with a 30-mer oligonucleotide to the C-terminus to facilitate translocation. Adapted with permission from C. B. Rosen, D. Rodriguez-Larrea, and H. Bayley, Nat. Biotechnol., 2014, 32(2), 179–181. Copyright 2014, Nature Publishing.
Figure 8.
Figure 8.
Distinguishing endothelin 1 (ET-1) from endothelin 2 (ET-2) using a FraC nanopore. (a) The translocation data of ET-2 and ET-2 revealed distinguishable fractional blockade current (IB) at 0.089 for ET-1 and 0.061 for ET-2. (b) By adding ET-1 and ET-2 consecutively to the same pore, two distinct populations were observed by plotting the event amplitude standard deviation (in) over the corresponding IB. (c) ET-1 and ET-2 are two nearly isomeric polypeptides differing from each other by 1 amino acid out of 21 as well as the position of a leucine residue (leucine 6 in ET-1 and leucine 7 in ET-2). Adapted with permission from G. Huang, K. Willems, M. Soskine, C. Wloka, and G. Maglia, Nat. Commun., 2017, 8, 935, under Creative Commons Attribution 4.0 International license, Nature Publishing.

References

    1. Gooding JJ and Gaus K, Angew. Chemie Int. Ed, 2016, 55, 11354–11366. - PubMed
    1. Jain M, Koren S, Miga KH, Quick J, Rand AC, Sasani TA, Tyson JR, Beggs AD, Dilthey AT, Fiddes IT, Malla S, Marriott H, Nieto T, O’Grady J, Olsen HE, Pedersen BS, Rhie A, Richardson H, Quinlan AR, Snutch TP, Tee L, Paten B, Phillippy AM, Simpson JT, Loman NJ and Loose M, Nat. Biotechnol, 2018, 36, 338–345. - PMC - PubMed
    1. Nir I, Huttner D and Meller A, Biophys. J, 2015, 108, 2340–2349. - PMC - PubMed
    1. Van Meervelt V, Soskine M, Singh S, Schuurman-Wolters GK, Wijma HJ, Poolman B and Maglia G, J. Am. Chem. Soc, 2017, 139, 18640–18646. - PMC - PubMed
    1. Wloka C, Van Meervelt V, van Gelder D, Danda N, Jager N, Williams CP and Maglia G, ACS Nano, 2017, 11, 4387–4394. - PMC - PubMed