. 2018 Dec 1;315(6):F1695-F1707.
doi: 10.1152/ajprenal.00246.2018. Epub 2018 Oct 17.

Periostin overexpression in collecting ducts accelerates renal cyst growth and fibrosis in polycystic kidney disease

Affiliations

Periostin overexpression in collecting ducts accelerates renal cyst growth and fibrosis in polycystic kidney disease

Archana Raman et al. Am J Physiol Renal Physiol. .

Abstract

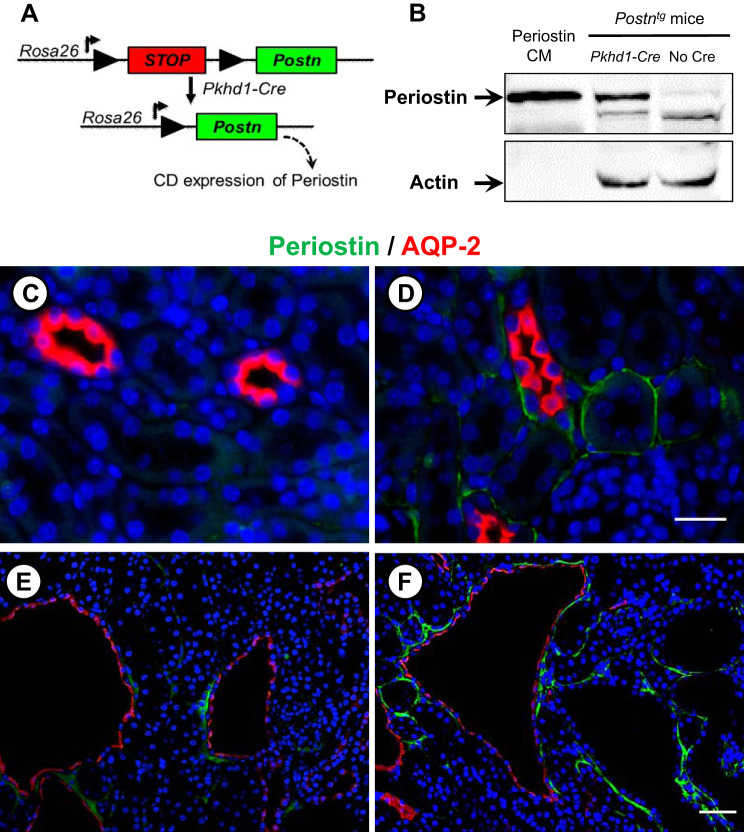
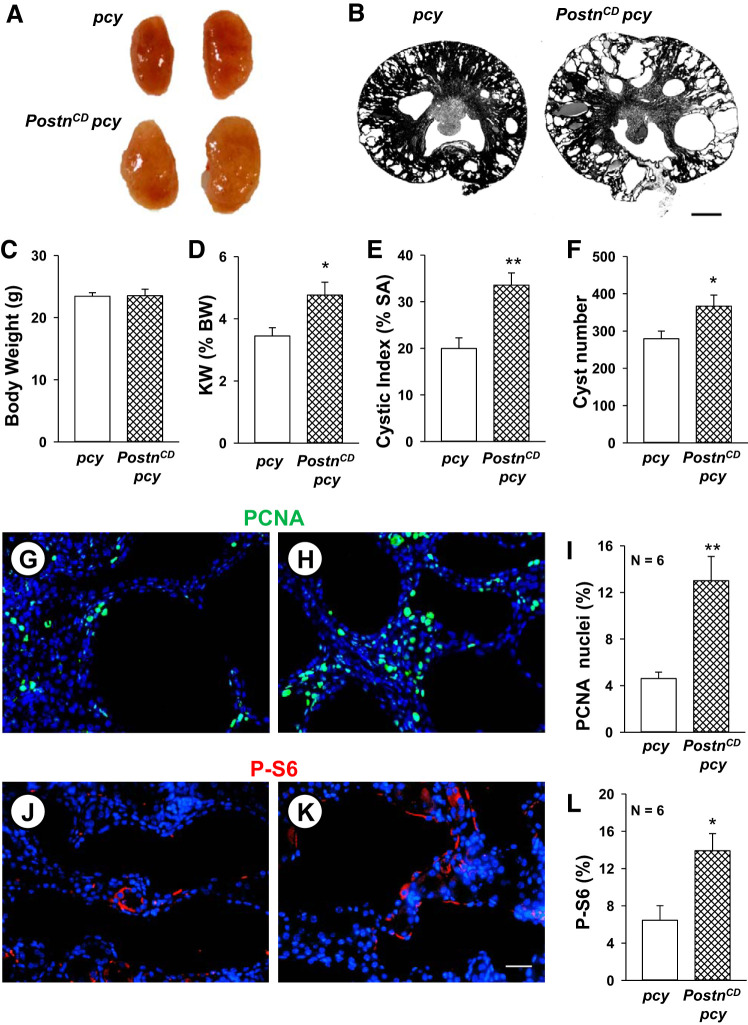
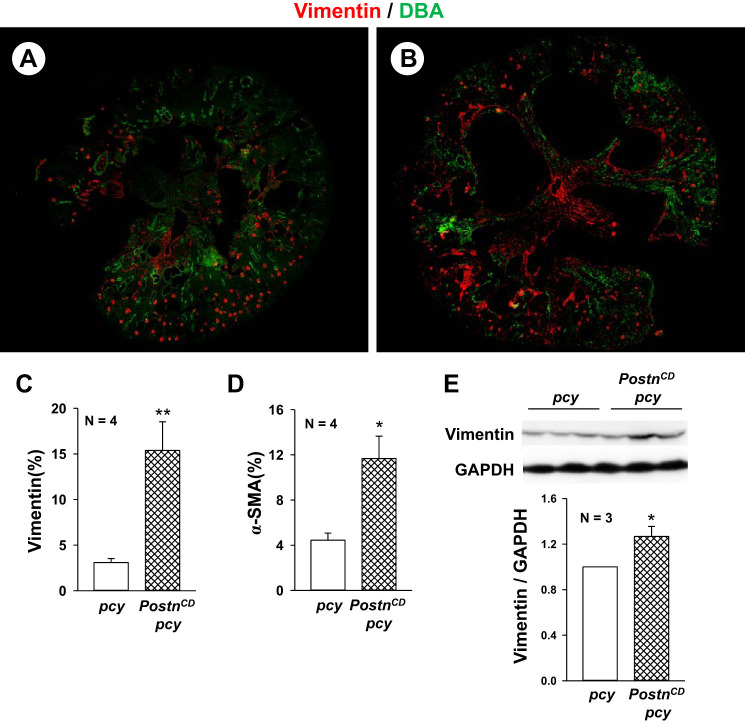
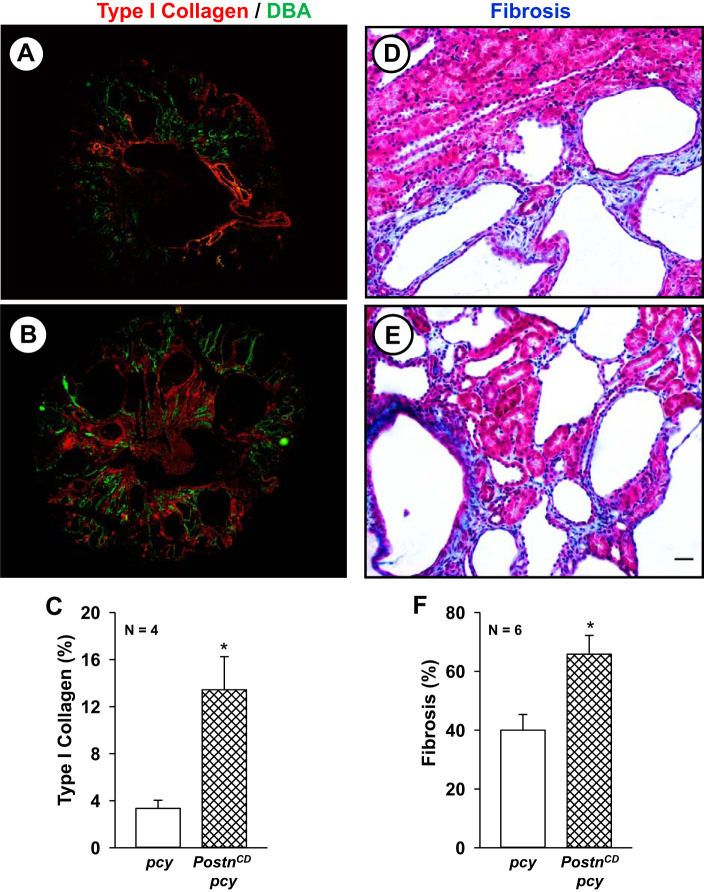
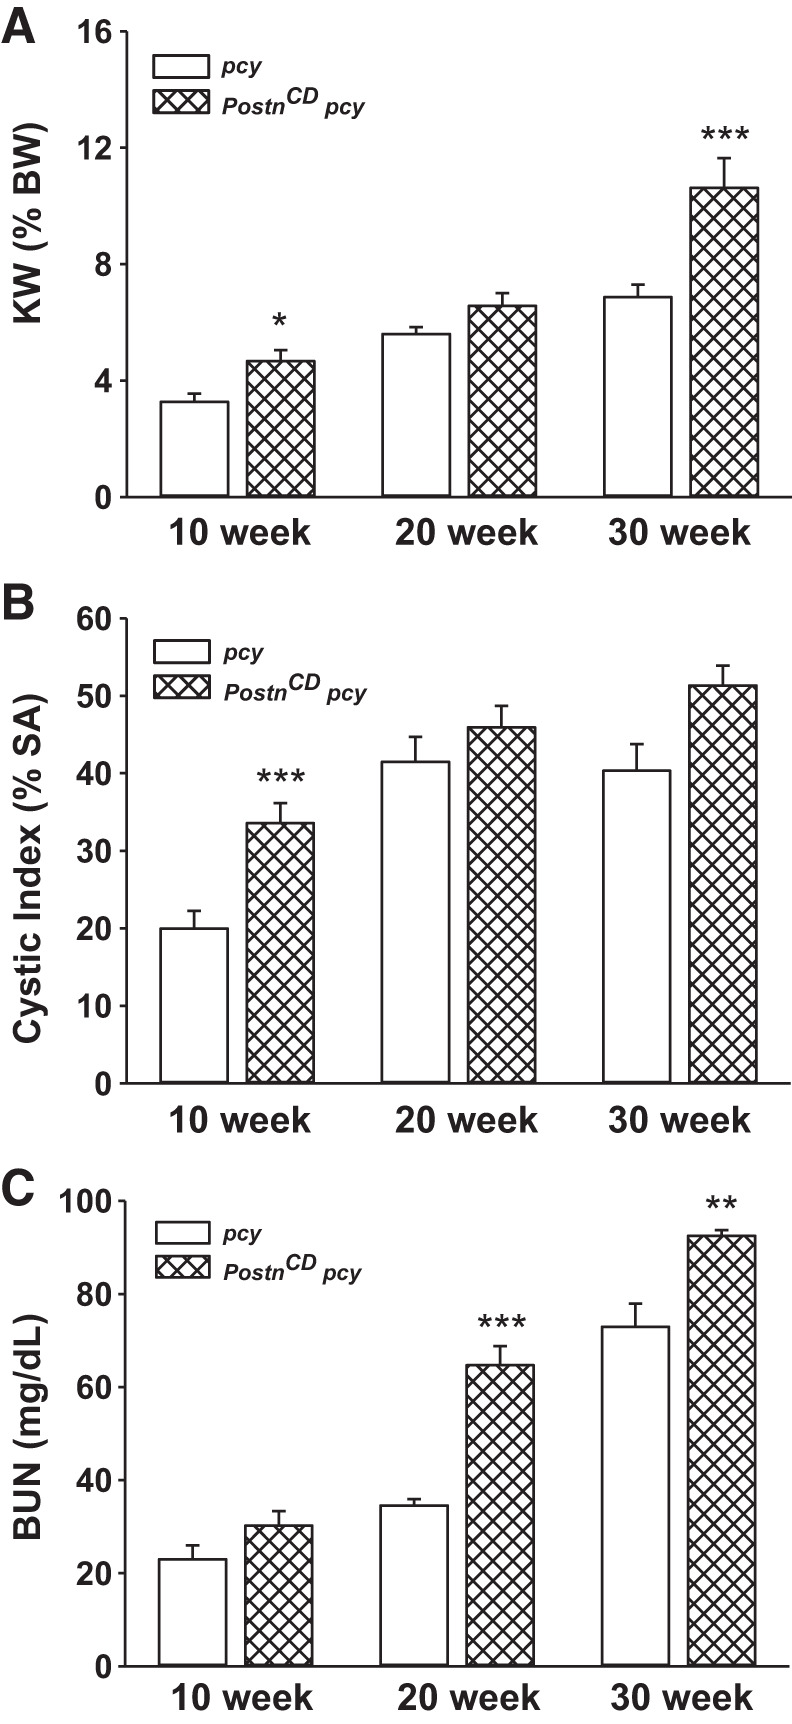
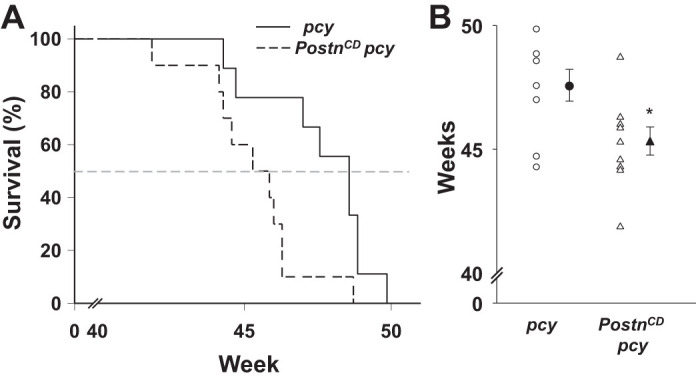
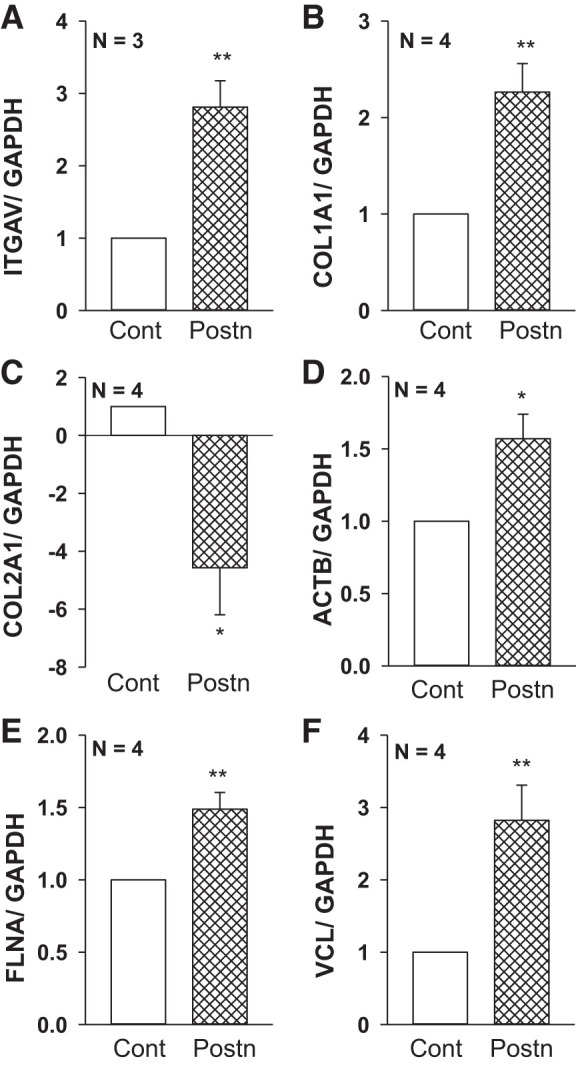
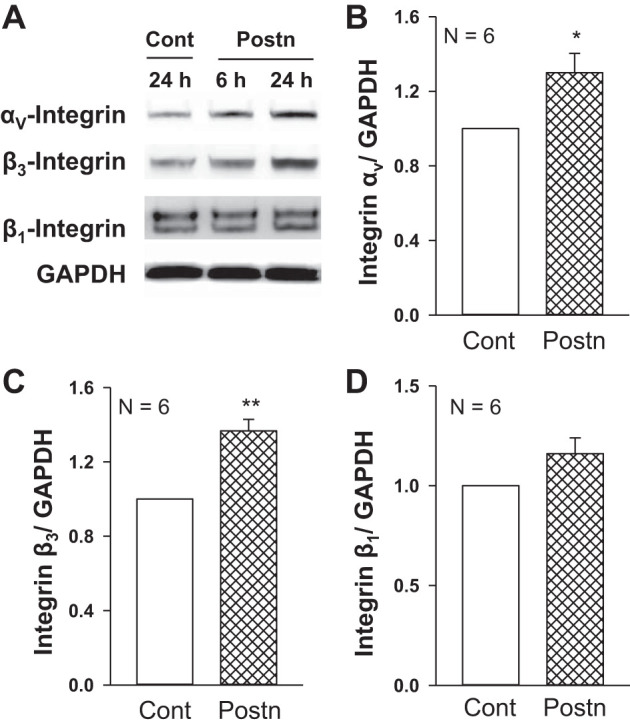
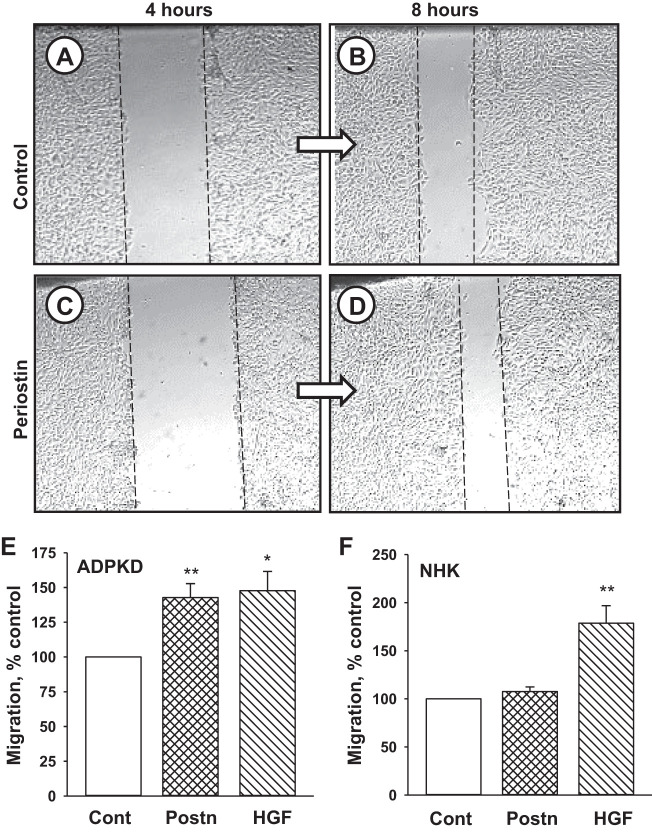
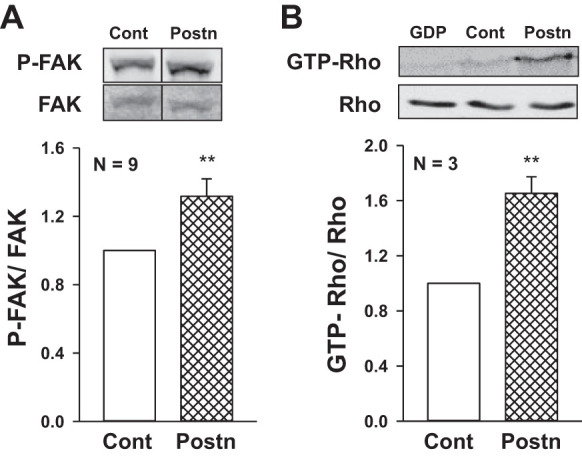
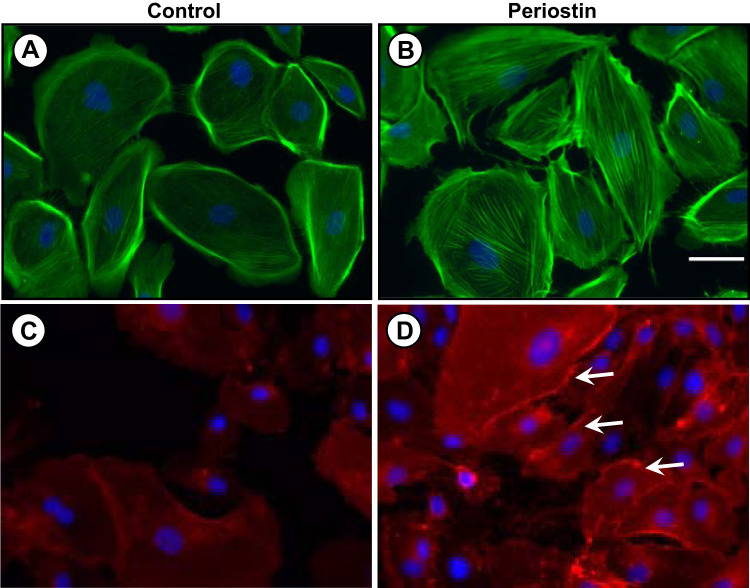
In polycystic kidney disease (PKD), persistent activation of cell proliferation and matrix production contributes to cyst growth and fibrosis, leading to progressive deterioration of renal function. Previously, we showed that periostin, a matricellular protein involved in tissue repair, is overexpressed by cystic epithelial cells of PKD kidneys. Periostin binds αVβ3-integrins and activates integrin-linked kinase (ILK), leading to Akt/mammalian target of rapamycin (mTOR)-mediated proliferation of human PKD cells. By contrast, periostin does not stimulate the proliferation of normal human kidney cells. This difference in the response to periostin is due to elevated expression of αVβ3-integrins by cystic cells. To determine whether periostin accelerates cyst growth and fibrosis, we generated mice with conditional overexpression of periostin in the collecting ducts (CDs). Ectopic CD expression of periostin was not sufficient to induce cyst formation or fibrosis in wild-type mice. However, periostin overexpression in pcy/pcy ( pcy) kidneys significantly increased mTOR activity, cell proliferation, cyst growth, and interstitial fibrosis; and accelerated the decline in renal function. Moreover, CD-specific overexpression of periostin caused a decrease in the survival of pcy mice. These pathological changes were accompanied by increased renal expression of vimentin, α-smooth muscle actin, and type I collagen. We also found that periostin increased gene expression of pathways involved in repair, including integrin and growth factor signaling and ECM production, and it stimulated focal adhesion kinase, Rho GTPase, cytoskeletal reorganization, and migration of PKD cells. These results suggest that periostin stimulates signaling pathways involved in an abnormal tissue repair process that contributes to cyst growth and fibrosis in PKD.

Keywords: autosomal dominant polycystic kidney disease; extracellular matrix; integrin; matricellular protein; proliferation.


Conflict of interest statement

D. P. Wallace is a consultant for Vertex Pharmaceuticals. None of the other authors has any conflicts of interest, financial or otherwise, to disclose.

Figures

Fig. 1.
Fig. 1.
Collecting duct (CD)-specific overexpression of periostin. A: we generated a transgenic mouse (Postntg) carrying a full-length periostin cDNA construct downstream of a floxed mCherry STOP cassette that was inserted in front of the Rosa26 promoter. These mice were bred to Pkhd1-Cre mice to specifically overexpress periostin in the CD. B: to confirm Cre-mediated transgene expression, protein lysates from Postntg mice with or without Pkhd1-Cre were immunoblotted for periostin. Conditioned media (CM) from M1 cells transfected with full-length mouse periostin cDNA was used as a positive control for periostin expression. We crossed Postntg;Pkhd1-Cre (PostnCD) mice to pcy mice to generate Postntg;Pkhd1-Cre;pcy mice (PostnCD pcy). Sections were stained for periostin (green), AQP-2 (CD marker, red), and DAPI (nuclear stain, blue). Wild-type (C), PostnCD (D), pcy (E), and PostnCD pcy (F). C and D are the same magnification. A lower magnification was used of E and F to visualize multiple cysts. Scale bars: 5 µm.
Fig. 2.
Fig. 2.
CD-specific periostin expression accelerates mammalian target of rapamycin (mTOR)-mediated cell proliferation and cyst growth in pcy kidneys. Representative whole kidneys (A) and kidney sections (B) from 10-wk-old pcy and PostnCD pcy mice. Scale bar: 1 mm. Bar graphs show means ± SE for body weight (BW) (C), kidney weight (KW) as a percentage of BW, indicated as KW (%BW) (D), percentage of cystic area per total cross-sectional surface area (% SA) (E) and cyst number per kidney section (F) of pcy (n = 6) and PostnCD pcy (n = 8) mice. pcy (G, J) and PostnCD pcy (H, K) kidney sections were stained for PCNA (green) (G, H) or phosphorylated S6 (P-S6; red) and nuclear stain DAPI (blue) (J, K). Percentage of PCNA-positive nuclei (I) and the percentage of P-S6-positive cells (L) normalized to total nuclei. *P < 0.05 and **P < 0.01, compared with pcy. Scale bars: 5 µm.
Fig. 3.
Fig. 3.
Collecting duct (CD)-specific expression of periostin increases the expression of vimentin and α-smooth muscle actin (α-SMA) in pcy kidneys. Representative kidney sections from pcy (A) and PostnCD pcy (B) mice were stained with antibodies to vimentin (red) and DBA (green). There was vimentin staining of mesangial cells in glomeruli in both pcy and PostnCD pcy sections. Cyst-lining cells and interstitial cells of PostnCD pcy kidneys had visually more vimentin staining compared with the kidneys of pcy littermates. Entire kidney sections were imaged using a Nikon Eclipse Ti microscope, and fluorescence for the section was measured using the threshold function in ImageJ software. Bar graphs (means ± SE) represent percentage of positively stained area in tissue section for vimentin (C) and α-SMA (D). E: immunoblots for vimentin and GAPDH levels from 20-wk old pcy and PostnCD pcy kidneys. Bar graph represents the levels of vimentin/GADPH, normalized to pcy (set to 1.0). *P < 0.05, **P < 0.01, compared with pcy mice.
Fig. 4.
Fig. 4.
Collecting duct (CD)-specific expression of periostin increases renal type I collagen and interstitial fibrosis in pcy mice. Representative sections from pcy (A) and PostnCD pcy (B) mice stained with antibodies to type I collagen (red) and Dolichos biflorus agglutinin (DBA; green). C: bar graph (means ± SE) represents the percentage of entire tissue sections that stained for type I collagen (n = 4), normalized to total surface area (SA). Representative sections from pcy (D) and PostnCD pcy (E) mice were stained with Masson’s trichrome to visualize collagen fibers (blue) and prefibrotic edematous areas characterized by an increase in spacing between tubules (pale blue) (67). F: tissue sections were scored by a naïve observer assigning a percentage of fibrotic/edematous cortical area per total area of the cortex. Bar graph represents fibrosis as a percentage of total sectional area. *P < 0.05, compared with pcy. Scale bar: 5 µm.
Fig. 5.
Fig. 5.
Collecting duct (CD)-specific periostin expression accelerates renal cyst growth and functional decline in pcy mice. pcy and PostnCD pcy mice were killed at 10 (n = 6–9 mice), 20 (n = 4–6 mice), and 30 (n = 3 or 4 mice) weeks of age for measurements of KW (%BW) (A), cystic index as percentage of surface area (SA) (B), and blood urea nitrogen (BUN) (C). *P < 0.05, **P < 0.01, and ***P < 0.001, compared with littermate pcy mice.
Fig. 6.
Fig. 6.
Collecting duct (CD)-specific overexpression of periostin decreases the survival of pcy mice. pcy (n = 9) and PostnCD pcy (n = 10) mice were given standard chow and water ad libitum and monitored regularly until a humane end point was reached (46, 48). A: Gehan-Breslow survival curves indicate that CD-specific overexpression of periostin significantly decreased the survival of pcy mice. B: scatterplot in which the open symbols represent the ages of pcy and PostnCD pcy mice at the time of death. Closed symbols indicate the means ± SE for each group of mice. *P < 0.05, compared with littermate age-matched pcy mice.
Fig. 7.
Fig. 7.
Periostin regulates genes involved in integrin/ECM signaling in autosomal dominant polycystic kidney disease (ADPKD) cells. Human ADPKD cells (n = 3 or 4 kidneys) were grown as polarized monolayers on permeable Transwells and incubated with control media (Cont) or 250 ng/ml recombinant periostin (Postn) for 24 h. Total RNA was isolated and reverse transcribed, and mRNA levels for the genes of interest were detected using quantitative RT-PCR and normalized to GAPDH. Bar graphs are expressed as means ± SE for relative changes in the expression of αV-integrin (ITGAV) (A), type I collagen (COL1A1) (B), type II collagen (COL2A1) (C), β-actin (ACTB) (D), filamin-A (FLNA) (E) and vinculin (VCL) (F). These genes were selected since they were found to be altered by periostin in a Bio-Rad PrimePCR array (Table 1). *P < 0.05 and **P < 0.01, compared with Cont.
Fig. 8.
Fig. 8.
Periostin increased the expression of αV-integrins and β3-integrins in autosomal dominant polycystic kidney disease (ADPKD) cells. ADPKD cells were grown on Transwells and incubated in Cont or Postn for 6 or 24 h. A: representative immunoblots show protein levels of αV-, β3-, and β1- integrins and GAPDH. Graphs (means ± SE) display the relative expression of αV-integrin/GAPDH (B), β3-integrin/GAPDH (C), and β1-integrin/GAPDH (D). *P < 0.05, **P < 0.01, compared with Cont (set to 1.0).
Fig. 9.
Fig. 9.
Periostin promotes the migration of autosomal dominant polycystic kidney disease (ADPKD) cells. A: ADPKD cells were seeded into individual wells of 12-well plates containing media + 1% FBS. Serum was reduced to 0.05% for 24 h, and a scratch in each monolayer was made using a 200-µm pipette tip. Wounded monolayers were incubated in control media (A and B) or media containing 250 ng/ml periostin (C and D), and images of the monolayers were taken at 4 h (A and C) and 8 h (B and D). Bar graphs (means ± SE) represent the quantification of cell migration (wound closure) between 4 and 8 h after wounding for ADPKD (n = 6) (E) and normal human kidney (NHK; n = 3) (F) cells in Cont, periostin (Postn) or 40 ng/ml hepatocyte growth factor (HGF), a positive control for promoting cell migration (50). **P < 0.01, *P < 0.05, compared with Cont.
Fig. 10.
Fig. 10.
Periostin stimulates focal adhesion kinase (FAK) and Rho-mediated cytoskeletal changes in autosomal dominant polycystic kidney disease (ADPKD) cells. A: human ADPKD cells were incubated in media containing 250 ng/ml Postn for 30 to 120 min. Immunoblot analysis was used to measure levels of phosphorylated FAK (P-FAK) and total FAK. In the representative immunoblot, splice marks indicate the removal of extraneous lanes within the same blot. Bar graph (means ± SE) represents P-FAK/FAK. B: Rho was immunoprecipitated from cell lysates using GST-RBD beads with a high affinity for GTP-bound Rho. For a negative control, GDP was added to the lysate to inactivate endogenous Rho before immunoprecipitation (lane 1). GTP-Rho from the immunoprecipitate and total Rho from whole cell lysates were detected by immunoblotting using a Rho antibody. Bar graph represents GTP-bound Rho/total Rho. **P < 0.01, compared with Control (Cont; set to 1.0).
Fig. 11.
Fig. 11.
Periostin stimulates changes in the actin cytoskeleton and αVβ3-integrin clustering in autosomal dominant polycystic kidney disease (ADPKD) cells. Cells were incubated in control (A, C) media or media containing periostin (B, D) for 1 h, and then stained with phalloidin (green) to visualize F-actin fibers (A, B) or αVβ3-integrin antibody to visualize the cellular location of the integrin (C, D). Arrows denote areas of integrin clustering. Scale bar: 5 µm.

Comment in

Similar articles

Cited by

References

    1. Bao S, Ouyang G, Bai X, Huang Z, Ma C, Liu M, Shao R, Anderson RM, Rich JN, Wang XF. Periostin potently promotes metastatic growth of colon cancer by augmenting cell survival via the Akt/PKB pathway. Cancer Cell 5: 329–339, 2004. doi:10.1016/S1535-6108(04)00081-9. - DOI - PubMed
    1. Bell PD, Fitzgibbon W, Sas K, Stenbit AE, Amria M, Houston A, Reichert R, Gilley S, Siegal GP, Bissler J, Bilgen M, Chou PC, Guay-Woodford L, Yoder B, Haycraft CJ, Siroky B. Loss of primary cilia upregulates renal hypertrophic signaling and promotes cystogenesis. J Am Soc Nephrol 22: 839–848, 2011. doi:10.1681/ASN.2010050526. - DOI - PMC - PubMed
    1. Butcher JT, Norris RA, Hoffman S, Mjaatvedt CH, Markwald RR. Periostin promotes atrioventricular mesenchyme matrix invasion and remodeling mediated by integrin signaling through Rho/PI 3-kinase. Dev Biol 302: 256–266, 2007. doi:10.1016/j.ydbio.2006.09.048. - DOI - PMC - PubMed
    1. Calvet JP. Injury and development in polycystic kidney disease. Curr Opin Nephrol Hypertens 3: 340–348, 1994. doi:10.1097/00041552-199405000-00017. - DOI - PubMed
    1. Calvet JP. Polycystic kidney disease: primary extracellular matrix abnormality or defective cellular differentiation? Kidney Int 43: 101–108, 1993. doi:10.1038/ki.1993.17. - DOI - PubMed

Publication types

MeSH terms

LinkOut - more resources