. 2018 Oct 17;16(10):e2005264.
doi: 10.1371/journal.pbio.2005264. eCollection 2018 Oct.

Peripherally derived macrophages modulate microglial function to reduce inflammation after CNS injury

Affiliations

Peripherally derived macrophages modulate microglial function to reduce inflammation after CNS injury

Andrew D Greenhalgh et al. PLoS Biol. .

Abstract

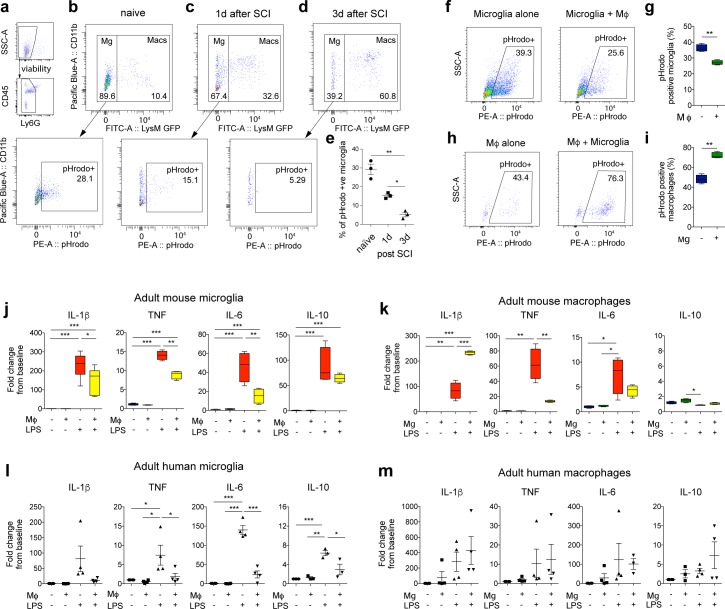
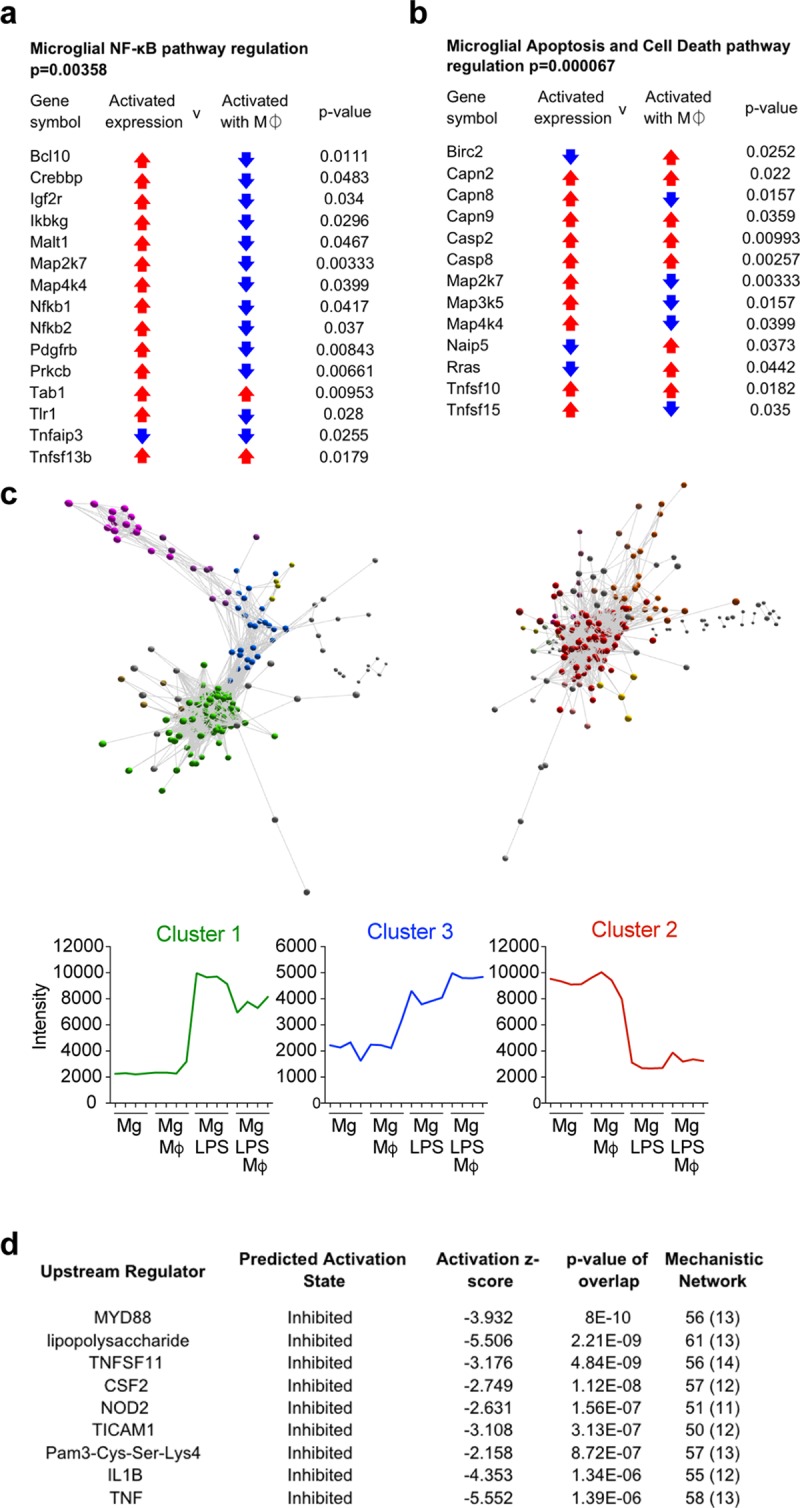
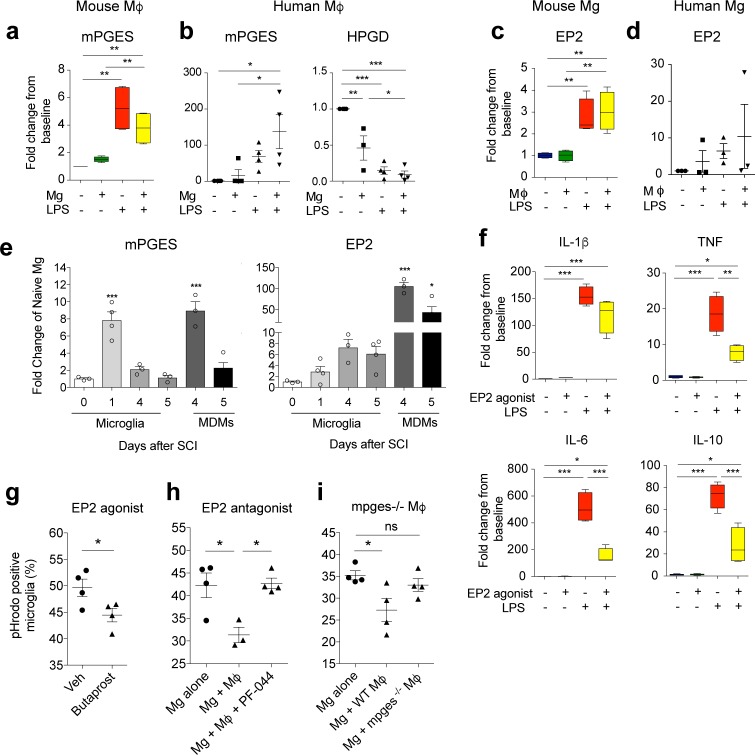
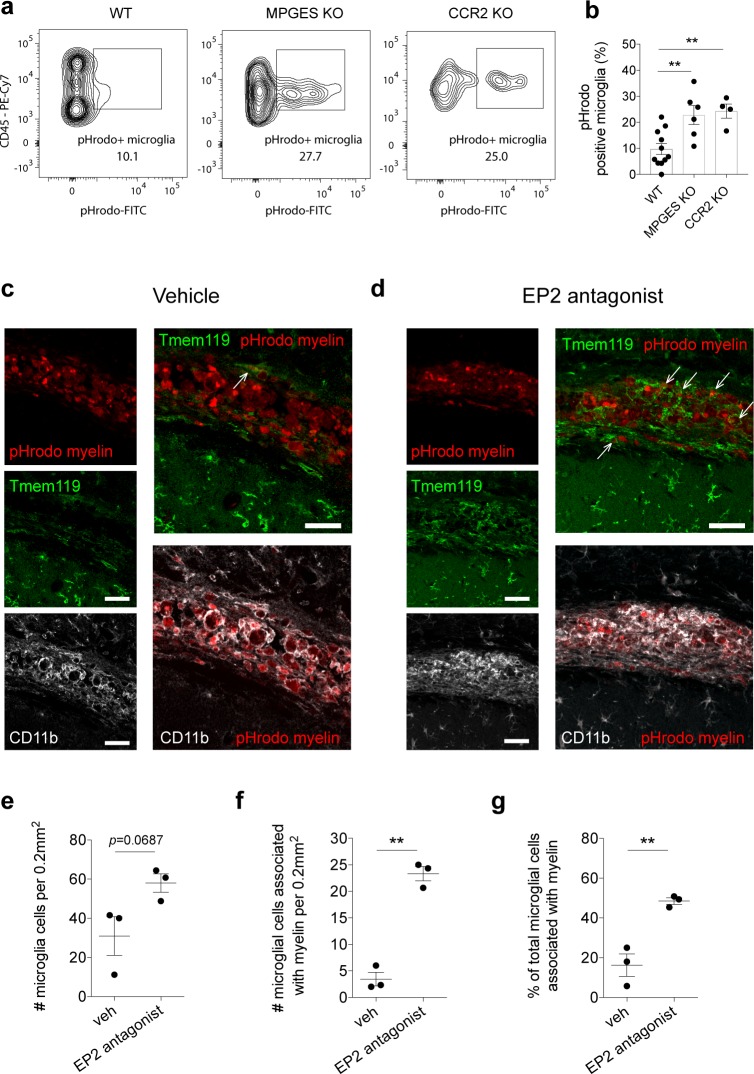
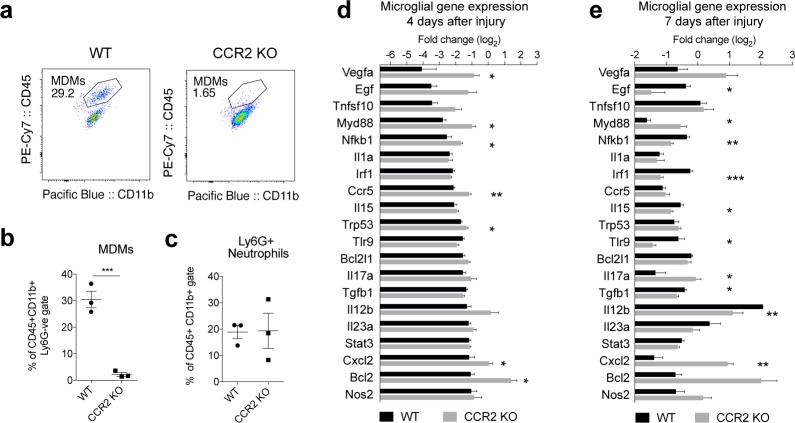
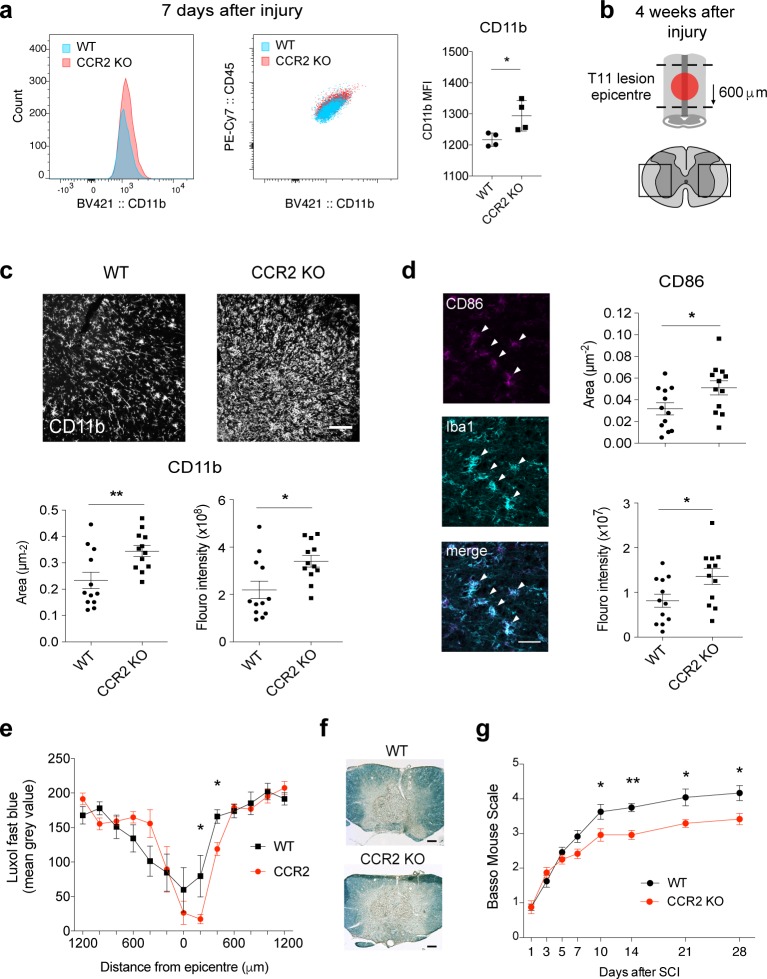
Infiltrating monocyte-derived macrophages (MDMs) and resident microglia dominate central nervous system (CNS) injury sites. Differential roles for these cell populations after injury are beginning to be uncovered. Here, we show evidence that MDMs and microglia directly communicate with one another and differentially modulate each other's functions. Importantly, microglia-mediated phagocytosis and inflammation are suppressed by infiltrating macrophages. In the context of spinal cord injury (SCI), preventing such communication increases microglial activation and worsens functional recovery. We suggest that macrophages entering the CNS provide a regulatory mechanism that controls acute and long-term microglia-mediated inflammation, which may drive damage in a variety of CNS conditions.


Conflict of interest statement

The authors have declared that no competing interests exist.

Figures

Fig 1
Fig 1. Reciprocal signaling between macrophages and microglia produces divergent functions in each cell type.
(a-e) Increasing numbers of MDMs in the injured spinal cord correlates with reduced phagocytosis by microglia. Myeloid cells were isolated from the uninjured or injured spinal cord of LysM-eGFP mice and immediately treated with pHrodo- labeled myelin for four hours. (a) Flow cytometry gates to isolate microglia/macrophage populations exclude Ly6G+ neutrophils. (b-d) Representative flow cytometry dot plots show proportions of CD11b+/LysM-eGFP−ve (microglia) and CD11b+/LysM-eGFP+ve (macrophages) in uninjured or SCI tissue, 1 and 3 d after injury. Bottom panels show representative plots of microglia positive for pHrodo-myelin. (e) Graph shows reduced phagocytosis by microglia, with increasing presence of MDMs post-SCI. (f-i) In vitro bilaminar coculture of adult mouse microglia and macrophages. Representative FACS plots show uptake of pHrodo-labeled myelin in microglia (f) or macrophages (Mϕ) (h) alone (left panels) or cells in coculture (right). Graphs showing that phagocytosis is significantly decreased in microglia in the presence of Mϕ compared to microglia alone (g), and significantly increased in macrophages in the presence of microglia (i). (j-m) The bilaminar culture system was used to assess microglia–macrophage communication on inflammatory gene expression in adult mouse and human cells. (j) Adult mouse microglial gene expression of four key inflammatory cytokines (IL-1β, TNF, IL-6, and IL-10) treated with LPS (100 ng/mL) in the presence or absence of macrophages (Mϕ). (k) Adult mouse macrophage gene expression in the presence or absence of adult mouse microglia. (l) Adult human microglial gene expression in the presence or absence of human macrophages. (m) Adult human macrophage gene expression in the presence or absence of adult human microglia. Statistical analysis for (e), one-way ANOVA with Bonferroni corrections (n = 3); (g, i) Student t test (n = 4). (j-m) Two-way ANOVA with Bonferroni corrections (n = 3–6), mean ± SEM, *p < 0.05; **p < 0.01; ***p < 0.001. Corresponding raw data (S1 Data). FACS, fluorescently activated cell sorting; IL, interleukin; LPS, lipopolysaccharide; MDM, monocyte-derived macrophage; SCI, spinal cord injury; TNF, Tumor necrosis factor.
Fig 2
Fig 2. Transcriptional profiling reveals macrophages suppress key inflammatory pathways and dysregulate apoptotic cell death pathways in adult mouse microglia.
Transcriptional profiling of mouse microglia revealed 1,076 differentially expressed genes between LPS-treated microglia in the presence or absence of macrophages. (a, b) IPA of the top dysregulated pathways within differentially expressed transcripts. NF-κB (a) and apoptosis and cell death (b) were the most significantly dysregulated in terms of number of genes and significance. Arrows in the “Activated expression” column indicate individual gene regulation when the pathway is induced in LPS-stimulated microglia (red = up-regulated, blue = down-regulated). Arrows in “Activated with Mϕ” column indicate individual gene regulation of LPS-stimulated microglia in the presence of macrophages. (c) A transcript-to-transcript correlation network plot of transcripts significantly changed in LPS-stimulated microglia in the presence of macrophages; network plot generated with Miru software (Pearson correlation threshold, r ≥ 0.86). Nodes in panel c represent transcripts (probe sets), and edges (connecting lines) represent the degree of correlation in expression between them. The network plot was clustered using a Markov clustering algorithm, and transcripts were assigned a color according to cluster membership. Graphs shown below are the mean expression profile of all transcripts within clusters 1, 2, and 3 (n = 4 per group). (d) Table shows upstream regulators of transcripts identified as differentially regulated between LPS-treated microglia and LPS-treated microglia in the presence of macrophages. The second column defines the predicted activation state of the upstream regulator when macrophages are present. The numbers in the last column indicate the total number of molecules in the data set that are downstream of the regulators, and the numbers in parenthesis indicate the total number of regulators involved in that particular network. Corresponding raw data (S1 Data). IL, interleukin; IPA, ingenuity pathway analysis; LPS, lipopolysaccharide; Mϕ, macrophage.
Fig 3
Fig 3. PGE2 signaling via the EP2 receptor is responsible for macrophage-mediated suppression of microglia.
(a-d) The bilaminar culture system was used to assess expression of inducible mPGES and EP2 receptor in adult mouse and human microglia and HPGD expression in human macrophages. (e) mPGES and EP2 receptor mRNA expression in FAC-sorted cells 1–5 days after SCI in mice. (f) Adult mouse microglial mRNA expression of four key inflammatory cytokines (IL-1β, TNF, IL-6, and IL-10) treated with LPS (100 ng/mL) in the presence or absence of EP2 agonist, Butaprost (1 μM). (g) Phagocytosis of pHrodo-labeled myelin by adult mouse microglia is reduced by pretreatment with Butaprost (1 μM; one hour). (h) Phagocytosis of pHrodo-labeled myelin by adult mouse microglia, either alone or in the presence of macrophages (Mϕ) treated with vehicle or EP2 receptor antagonist, PF-0441894 (10 μM). (i) Phagocytosis of pHrodo-labeled myelin by adult mouse microglia alone or in the presence of WT macrophages or macrophages from mPGES−/− mice. Statistical analysis for (a-d, f), two-way ANOVA with Bonferroni corrections (n = 3–4), and (e, g-i), one-way ANOVA with Bonferroni corrections (n = 3–4). Mean ± SEM. *p < 0.05; **p < 0.01; ***p < 0.001. Corresponding raw data (S1 Data). FAC, fluorescently activated cell; HPGD, hydroxyprostaglandin dehydrogenase; IL, interleukin; LPS, lipopolysaccharide; mPGES, microsomal prostaglandin E synthase-1; PGE2, prostaglandin E2; SCI, spinal cord injury; TNF, tumor necrosis factor; WT, wild-type.
Fig 4
Fig 4. Lack of macrophages and loss of PGE2 signaling via the EP2 receptor increases microglia phagocytosis in vivo.
(a-b) Myeloid cells were isolated from the injured spinal cord of WT, mpges−/−, and CCR2 KO mice three days after SCI, and immediately treated with pHrodo (green)-labeled myelin for four hours. MDM and neutrophil populations were excluded by gating CD11b+/CD45+/Ly6G−ve/Ly6C−ve cells. (a) Representative FACS plots show proportions of microglia positive for pHrodo (Green)-myelin. (b) Graph shows significantly increased phagocytosis by microglia after SCI in mpges−/− and CCR2 KO mice compared with WT control. (c-g) In vivo injection into the corpus callosum of pHrodo-labeled myelin in conjunction with vehicle (control) or EP2 receptor antagonist (PF-0441894; 1 μM) in WT mice. Association of microglia (Tmem119; green) with pHrodo-myelin (red) was assessed at the site of injection in the two groups, vehicle (c) and EP2 receptor antagonist (d). In the EP2 antagonist–treated group, there is an increase in the number of microglia at the injection site (e), the number of microglia that contact or contain pHrodo-myelin (f), and the percentage of total microglia that are in contact or contain pHrodo-myelin (g), compared with controls. Arrows indicate transmembrane protein (Tmem)119+ microglia containing or in contact with pHrodo-myelin. Statistical analysis for (b), one-way ANOVA with Bonferroni corrections (n = 4–10), and (e-g) Student t test (n = 3). Mean ± SEM. **p < 0.01; scale bars = 50 μm. Corresponding raw data (S1 Data). CCR2, C–C chemokine receptor type 2; FACS, fluorescently activated cell sorting; KO, knock-out; MDM, monocyte-derived macrophage; mpges, microsomal prostaglandin E synthase-1; PGE2, prostaglandin E2; SCI, spinal cord injury; Tmem, transmembrane protein; veh, vehicle; WT, wild-type.
Fig 5
Fig 5. Lack of macrophage infiltration after SCI dysregulates microglial inflammation.
Spinal cord contusion injury was performed in CCR2(rfp/rfp) (CCR2 KO) mice and WT controls. (a) FACS plots show Ly6G−ve/CD45hi/CD11b+ MDMs in WT versus CCR2 KO mice five days after SCI. (b) Graph shows marked reduction in MDMs in the spinal cord lesion five days after SCI. (c) No change in Ly6G+ neutrophils in the injured cord at this time point (five days) post-SCI. (d-e) RT-qPCR gene array analysis of FACS-sorted microglia (CD45low/CD11b+ve/Ly6G−ve/Ly6C−ve) from WT and CCR2 KO SCI lesions four days (d) and seven days (e) after injury (n = 3–4, 4–5 mice pooled per n). (d) Graph shows the top 20 significantly down-regulated genes in WT animals compared with those genes in CCR2 KO mice. Each genotype was normalized to its own baseline control. (e) The same genes were assessed seven days after injury; several genes continue to show dysregulation compared with WT controls. Statistical analysis, Student t tests and one-way ANOVA. Mean ± SEM. *p < 0.05; **p < 0.01; ***p < 0.001. Corresponding raw data (S1 Data). CCR2, C–C chemokine receptor type 2; FAC, fluorescently activated cell sorting; KO, knock-out; MDM, monocyte-derived macrophage; RT-qPCR, quantitative real-time polymerase chain reaction; SCI, spinal cord injury; WT, wild-type.
Fig 6
Fig 6. Blocking infiltration of macrophages to the injured spinal cord increases chronic microglial activation and impairs functional recovery after SCI.
Spinal cord contusion injury was performed in CCR2 KO mice and WT controls. (a) FACS analysis of CD45low/CD11b+ve/Ly6G−ve/Ly6C−ve microglia shows significant increase in CD11b mean fluorescent intensity (MFI) in CCR2 KO mice seven days after SCI. (b) Schematic of spinal cord shows area imaged and quantified in panels c and d, 28 days after injury—600 μm caudal to T11 lesion and boxed regions in left and right lateral white and gray matter. (c) Representative images in WT and CCR2 KO of CD11b immunoreactivity 28 days after SCI. Graphs show CD11b average area (μm−2) and fluorescent intensity (Integrated Density a.u) are significantly increased in CCR2 KO mice (which lack macrophage infiltration) versus WT controls. (d) CD86 expression (magenta) colocalized with Iba1 (cyan) is also significantly increased in CCR2 KO 28 days after SCI. (e, f) Luxol Fast Blue staining revealed that CCR2 KO mice showed greater myelin loss, a marker for secondary tissue damage, caudal to the lesion 28 days after SCI compared with control (g). Locomotor recovery assessed by the BMS shows CCR2 KO mice have impaired functional recovery compared to WT, beginning seven days after SCI. Statistical analysis for (a, c, d, e) Student t tests; a, n = 4; c and d, n = 12; e, n = 6 per group. (g) Two-way repeated measures ANOVA with post hoc Tukey analysis. n = 12 per group, mean ± SEM. *p < 0.05; **p < 0.01. Scale bars in c and f = 100 μm; d = 50 μm. Corresponding raw data (S1 Data). BMS, Basso Mouse Scale; CCR2, C–C chemokine receptor type 2; FACS, fluorescently activated cell sorting; KO, knock-out; MFI, mean fluorescent intensity; SCI, spinal cord injury; WT, wild-type.

References

    1. Wu Y, Dissing-Olesen L, MacVicar BA, Stevens B. Microglia: Dynamic Mediators of Synapse Development and Plasticity. Trends in immunology. 2015;36(10):605–13. 10.1016/j.it.2015.08.008 - DOI - PMC - PubMed
    1. Hong S, Beja-Glasser VF, Nfonoyim BM, Frouin A, Li S, Ramakrishnan S, et al. Complement and microglia mediate early synapse loss in Alzheimer mouse models. Science. 2016;352(6286):712–6. 10.1126/science.aad8373 - DOI - PMC - PubMed
    1. Gadani Sachin P, Walsh James T, Lukens John R, Kipnis J. Dealing with Danger in the CNS: The Response of the Immune System to Injury. Neuron. 2015;87(1):47–62. 10.1016/j.neuron.2015.05.019 - DOI - PMC - PubMed
    1. Shechter R, Schwartz M. Harnessing monocyte-derived macrophages to control central nervous system pathologies: no longer ‘if’ but ‘how’. The Journal of Pathology. 2013;229(2):332–46. 10.1002/path.4106 - DOI - PubMed
    1. Schwab JM, Zhang Y, Kopp MA, Brommer B, Popovich PG. The paradox of chronic neuroinflammation, systemic immune suppression, autoimmunity after traumatic chronic spinal cord injury. Experimental Neurology. 2014;258(0):121–9. - PMC - PubMed

Publication types