. 2018 Oct 16;49(4):754-763.e4.
doi: 10.1016/j.immuni.2018.09.016.

Tumor-Derived cGAMP Triggers a STING-Mediated Interferon Response in Non-tumor Cells to Activate the NK Cell Response

Affiliations

Tumor-Derived cGAMP Triggers a STING-Mediated Interferon Response in Non-tumor Cells to Activate the NK Cell Response

Assaf Marcus et al. Immunity. .

Abstract

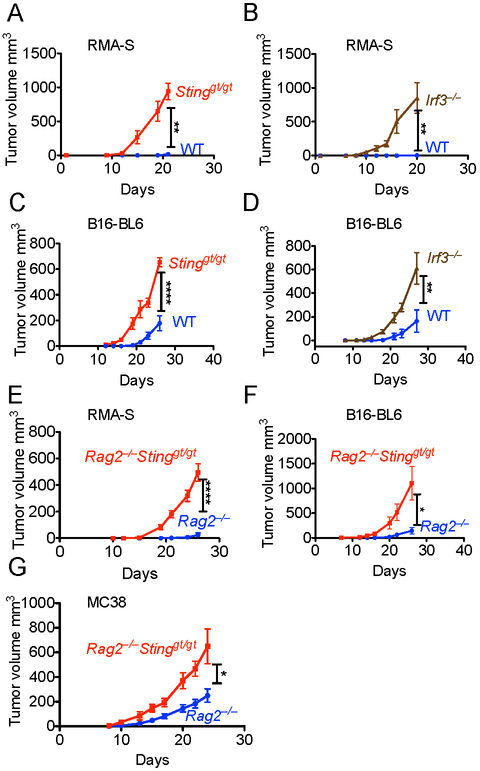
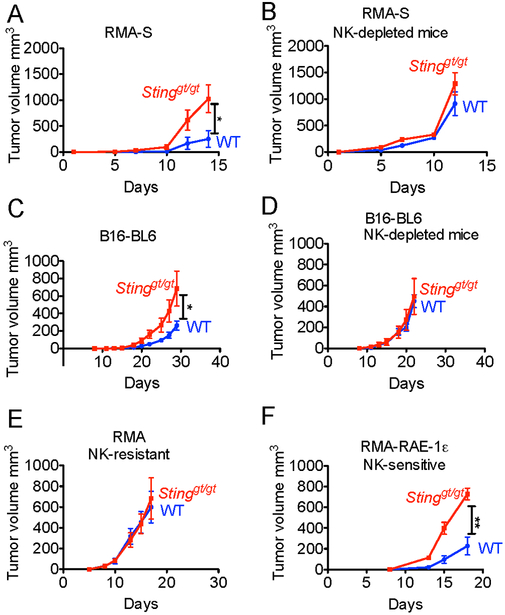
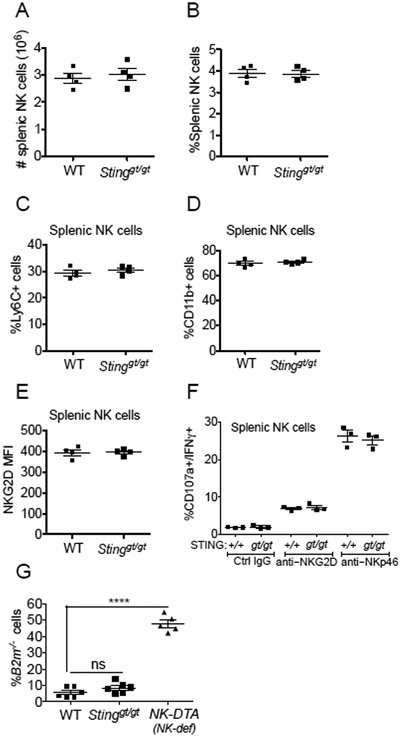
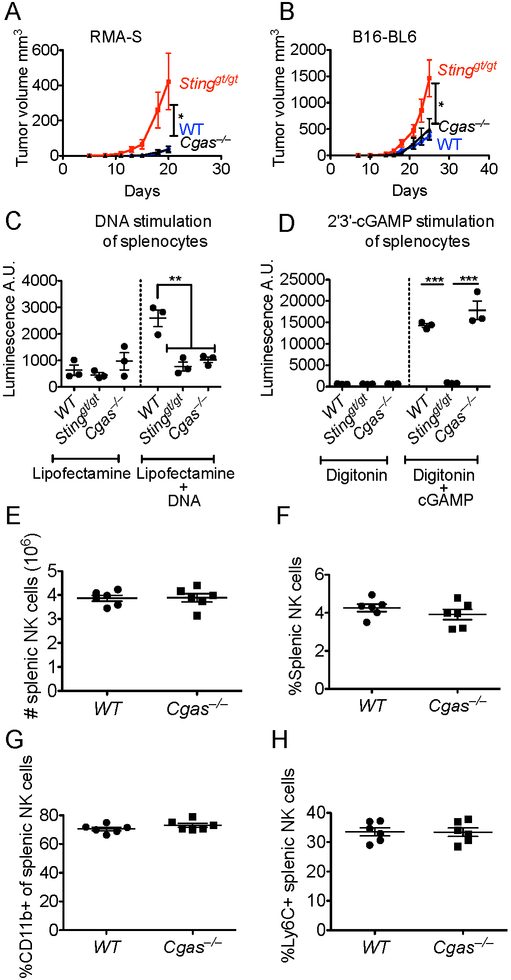
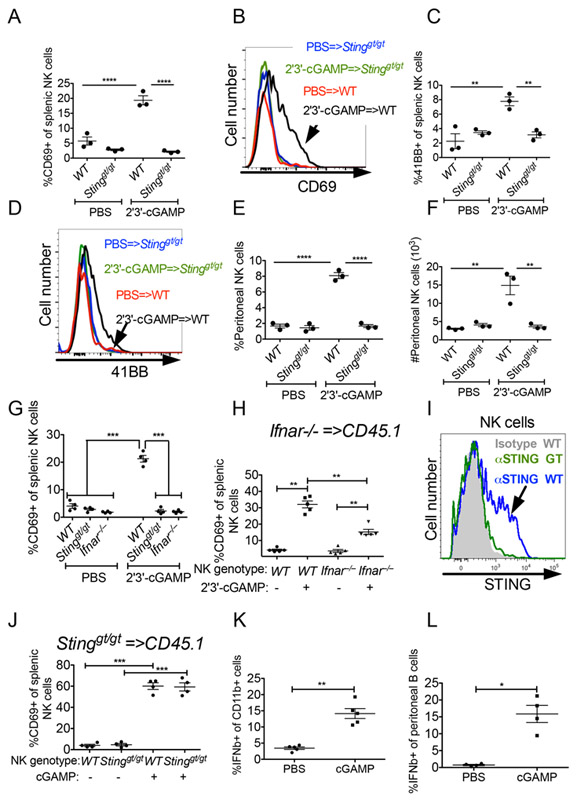
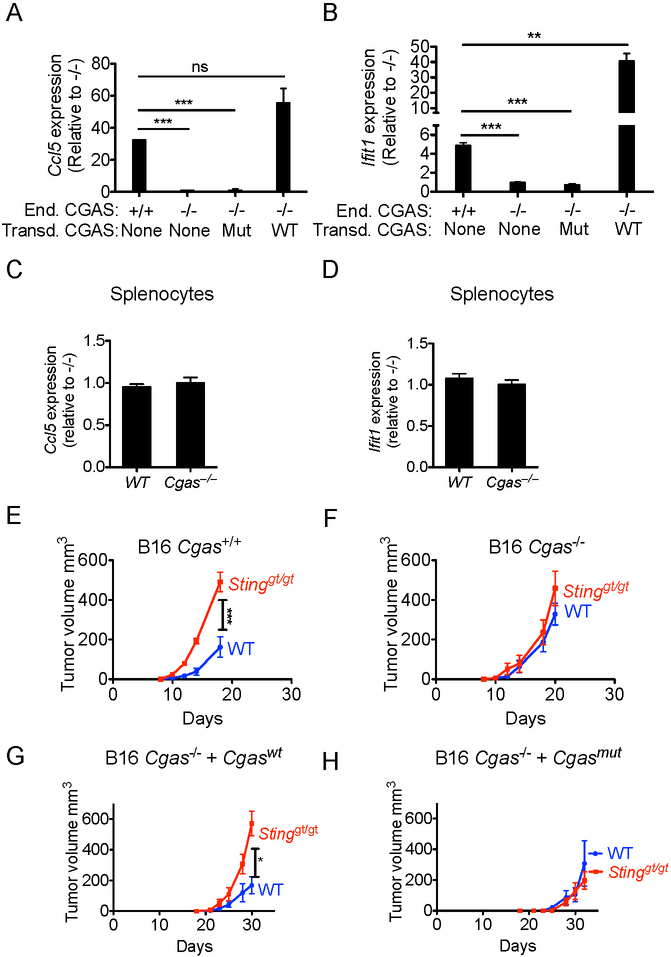
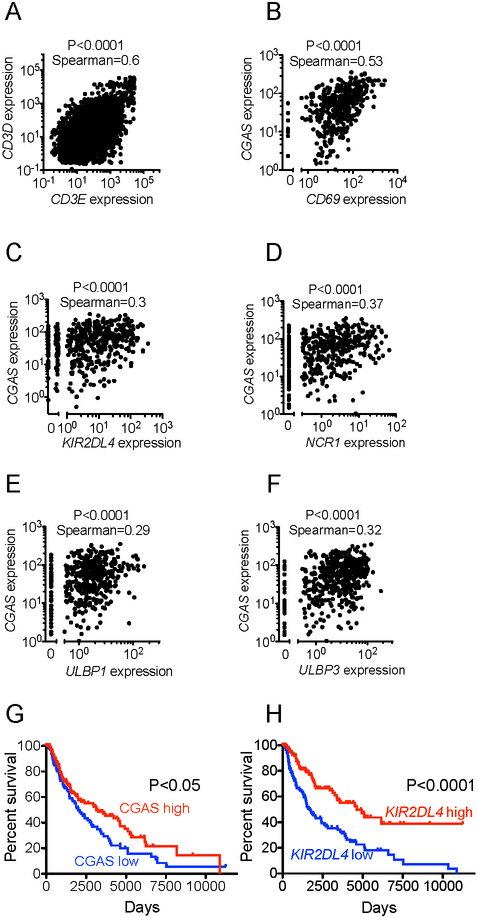
Detection of cytosolic DNA by the enzyme cGAS triggers the production of cGAMP, a second messenger that binds and activates the adaptor protein STING, which leads to interferon (IFN) production. Here, we found that in vivo natural killer (NK) cell killing of tumor cells, but not of normal cells, depends on STING expression in non-tumor cells. Experiments using transplantable tumor models in STING- and cGAS-deficient mice revealed that cGAS expression by tumor cells was critical for tumor rejection by NK cells. In contrast, cGAS expression by host cells was dispensable, suggesting that tumor-derived cGAMP is transferred to non-tumor cells, where it activates STING. cGAMP administration triggered STING activation and IFN-β production in myeloid cells and B cells but not NK cells. Our results reveal that the anti-tumor response of NK cells critically depends on the cytosolic DNA sensing pathway, similar to its role in defense against pathogens, and identify tumor-derived cGAMP as a major determinant of tumor immunogenicity with implications for cancer immunotherapy.

Keywords: -cGAMP; 2ʹ; 3ʹ; DNA sensor; NK cells; STING; cGAS; cancer immunology; cancer immunotherapy; interferon; natural killer cells; tumor immunity.


Figures

Figure 1.
Figure 1.. Stinggt/gt mice are susceptible to tumors independently of effects on T and B cells.
Tumor cells were injected s.c. into mice (n=4-6). Tumor growth was assessed by caliper measurements, and statistical significance was assessed by 2-way ANOVA. Bars represent +/− means SEM. Results are representative of two to four independent experiments. Tumors were injected into WT or Stinggt/gt mice (A, C), into WT or Irf3−/− mice (B, D), or into Rag2−/− or Rag2−/− Stinggt/gt mice (E,F,G). The mice were injected with the following tumor doses: (A, B, E) 2 × 10⁵ RMA-S or RMA cells; (C, D, F) 2 × 10⁴ B16-BL6 cells; (F) 5 × 10⁴ RMA-RAE-1ε cells; (G) 105 MC38 cells
Figure 2.
Figure 2.. STING induces NK cell-mediated anti-tumor responses.
Tumor cells were injected s.c. into mice (n=4-6). Tumor growth was assessed by caliper measurements, and statistical significance was assessed by 2-way ANOVA. Bars represent means +/− SEM. Results are representative of two to four independent experiments. In some groups (B, D), NK cells were depleted with PK136 antibody. Tumor cells were injected into WT or Stinggt/gt mice. The mice were injected with the following tumor doses: (A,B) 2 × 10⁵ RMA-S; (C,D) 2 × 10⁴ B16-BL6 cells; (E) 105 RMA cells; (F) 5 × 10⁴ RMA-RAE-1ε cells.
Figure 3.
Figure 3.. Stinggt/gt mice have functional NK cells, and are capable of rejecting MHC I-deficient cells.
Splenocytes from WT or Stinggt/gt mice (n=4) were analyzed by flow cytometry for (A, B) absolute number (A), or percentage (B), of NK cells; (C, D) percentages of Ly6C+ (C) or CD11b+ (D) NK cells; (E) Mean Fluorescence Intensity (MFI) of NKG2D staining of NK cells. (F) Splenocytes (n=3) were stimulated with plate-bound antibodies (for NKG2D or NKp46, or control IgG). The percentages of CD107a+/IFN-γ+ NK cells were assessed by flow cytometry. (G) Rejection of B2m−/− bone marrow cells by WT and Stinggt/gt mice but not NK cell-deficient NK-DTA mice (n=5-6). A 50:50 mixture of CFSE-labeled B2m−/− and WT bone marrow cells was injected intravenously, and recovery of B2m−/− cells was assessed by flow cytometry three days later. Results are representative of two to four independent experiments.Bars represent means +/− SEM. Statistical significance was assessed using 2-tailed t tests in panels (A-F), where no significant differences were noted, or 1-way-ANOVA with Bonferroni’s correction for multiple comparisons (G).
Figure 4.
Figure 4.. Host cGAS is dispensable tumor rejection.
(A,B) Tumor cells were injected s.c. into WT, Stinggt/gt, or Cgas−/− mice (n=4-6). Analysis was as in Fig. 1 legend. Results are representative of two independent experiments. Mice were injected with 2 × 10⁵ RMA-S cells (A) or 2 × 10⁴ B16-BL6 cells (B). (C,D) Splenocytes from WT, Stinggt/gt or Cgas−/− mice were transfected with either Vaccinia Virus dsDNA 70mer (C), or 2'3'-cGAMP (D), and secreted type I IFN in culture supernatants was measured using an IFN bioassay. Splenocytes from WT or Cgas−/− mice (n=6) were analyzed by flow cytometry for the absolute number (E) or percentage (F) of NK cells, or the percentages of NK cells expressing CD11b (G) or Ly6C (H). Results are representative of two to four independent experiments. Bars represent means +/− SEM. Statistical significance was assessed using 2-tailed t tests (E-H) or 1-way-ANOVA with Bonferroni’s correction for multiple comparisons (C-D).
Figure 5.
Figure 5.. Exogenous 2'3'-cGAMP activates NK cells in a cell extrinsic fashion.
(A-G) 200 ηmol 2'3'-cGAMP was injected i.p. into WT, Stinggt/gt mice or Ifnar−/− mice (n=3-4), and 18 hours later splenocytes were analyzed by flow cytometry. (A,C,G) Percentages of CD69+ or 4-1BB+ splenic NK cells are shown. (B,D) Representative CD69 (B) and 4-1BB (D) staining profiles. (E,F) Analysis of peritoneal wash cells collected from 2'3'-cGAMP-injected mice, showing percentages (E) and absolute numbers (F) of peritoneal NK cells. (H,J) 30 × 106 Ifnar−/− (H) or Stinggt/gt (J) splenocytes were transferred i.v. into CD45.1 mice, and the mice were challenged i.p with 200 ηmol 2'3'-cGAMP. 12 hours later, splenocytes were harvested and donor and host NK cells were analyzed for CD69 expression. (I) Gated NK cells from WT and Stinggt/gt mice were stained intracellularly for STING expression. (K-L) 500 μg (696 ηmol) 2'3'-cGAMP was injected into 7-day established RMA-S tumors (K) or ip in non-tumor bearing mice (L), and one hour later the tumors (K), or peritoneal wash cells (L), were harvested for analysis. Cells were incubated with brefeldin/monesin for five hours prior to intracellular IFN-β staining. Shown are the results for CD11b+ tumor myeloid cells (negative for CD3, CD19, NKp46, Ly6G) (K) and peritoneal B cells (L). Results are representative of two to four independent experiments. Bars represent means +/− SEM. For cGAMP injections, data was analyzed using 1-way ANOVA with Bonferroni’s correction for multiple comparisons.
Figure 6.
Figure 6.. Constitutive cGAS activation in tumor cells leads to tumor rejection dependent on host STING.
(A, B) QRT-PCR analysis of Ccl5 (A) and Ifit1 (B) expression levels in B16-BL6-Cgas+/+, B16-Cgas−/− or B16-Cgas−/− tumor cells, or B16-Cgas−/− cells transduced with either active (Cgaswt) or inactive (Cgasmut) CGAS expression vector. (C,D) QRT-PCR analysis of Ccl5 (C) and Ifit1 (D) expression levels in splenocytes isolated from WT or Cgas−/− mice. Results are representative of three to six independent experiments, and data consists of three technical replicates. Fold expression is shown relative to mutant cells. Statistical significance was assessed using 2-tailed t tests. (E-H) Tumor cells (105) were injected s.c. into WT or Stinggt/gt mice and tumor growth monitored as in Fig. 1 legend. Each group contained 4-6 mice, and results are representative of two independent experiments. Injected tumor cells were: B16-BL6-CGAS+/+ cells (E); B16-BL6-Cgas−/− cells (F); B16-BL6-Cgas−/− cells transduced with active (Cgaswt, G), or inactive (Cgasmut, H) cGAS expression vector. Bars represent means +/− SEM. Statistical significance was assessed as in Fig 1.
Figure 7.
Figure 7.. Clinical correlations with cGAS and NK cells in human melanoma.
All the data were obtained from The Cancer Genome Atlas (TCGA). (A) Plot of expression of CD3E vs. expression of CD3D across all cancers. (B) Plot of expression of cGAS vs. expression of CD69 in melanoma. (C) Plot of expression of cGAS vs. expression of KIR2DL4 in melanoma. (D) Plot of expression of cGAS vs. expression of NCR1 in melanoma. (E) Plot of expression of cGAS vs. expression of ULBP1 in melanoma. (F) Plot of expression of cGAS vs. expression of ULBP3 in melanoma. (G) Kaplan-Meier plot of melanoma patient survival; patients are segmented by cGAS expression (highest and lowest thirds). (H) Kaplan-Meier plot of melanoma patient survival; patients are segmented by KIR2DL4 expression (highest and lowest thirds). For correlations of expression, statistical significance was assessed using the Spearman coefficient. For survival analysis, statistical significance was assessed using the log-rank test.

Comment in

  • Tumor cGAMP Awakens the Natural Killers.
    Sundararaman SK, Barbie DA. Sundararaman SK, et al. Immunity. 2018 Oct 16;49(4):585-587. doi: 10.1016/j.immuni.2018.10.001. Immunity. 2018. PMID: 30332624 Free PMC article.

References

    1. Ablasser A, Goldeck M, Cavlar T, Deimling T, Witte G, Rohl I, Hopfner KP, Ludwig J, and Hornung V (2013a). cGAS produces a 2'-5'-linked cyclic dinucleotide second messenger that activates STING. Nature 498, 380–384. - PMC - PubMed
    1. Ablasser A, Schmid-Burgk JL, Hemmerling I, Horvath GL, Schmidt T, Latz E, and Hornung V (2013b). Cell intrinsic immunity spreads to bystander cells via the intercellular transfer of cGAMP. Nature. - PMC - PubMed
    1. Brzostek-Racine S, Gordon C, Van Scoy S, and Reich NC (2011). The DNA damage response induces IFN. J Immunol 187, 5336–5345. - PMC - PubMed
    1. Cerami E, Gao J, Dogrusoz U, Gross BE, Sumer SO, Aksoy BA, Jacobsen A, Byrne CJ, Heuer ML, Larsson E, et al. (2012). The cBio cancer genomics portal: an open platform for exploring multidimensional cancer genomics data. Cancer discovery 2, 401–404. - PMC - PubMed
    1. Chaix J, Tessmer MS, Hoebe K, Fuseri N, Ryffel B, Dalod M, Alexopoulou L, Beutler B, Brossay L, Vivier E, et al. (2008). Cutting edge: Priming of NK cells by IL-18. J Immunol 181, 1627–1631. - PMC - PubMed

Publication types

MeSH terms