. 2018 Oct 16;49(4):764-779.e9.
doi: 10.1016/j.immuni.2018.09.020.

The Lineage-Defining Transcription Factors SOX2 and NKX2-1 Determine Lung Cancer Cell Fate and Shape the Tumor Immune Microenvironment

Affiliations

The Lineage-Defining Transcription Factors SOX2 and NKX2-1 Determine Lung Cancer Cell Fate and Shape the Tumor Immune Microenvironment

Gurkan Mollaoglu et al. Immunity. .

Abstract

The major types of non-small-cell lung cancer (NSCLC)-squamous cell carcinoma and adenocarcinoma-have distinct immune microenvironments. We developed a genetic model of squamous NSCLC on the basis of overexpression of the transcription factor Sox2, which specifies lung basal cell fate, and loss of the tumor suppressor Lkb1 (SL mice). SL tumors recapitulated gene-expression and immune-infiltrate features of human squamous NSCLC; such features included enrichment of tumor-associated neutrophils (TANs) and decreased expression of NKX2-1, a transcriptional regulator that specifies alveolar cell fate. In Kras-driven adenocarcinomas, mis-expression of Sox2 or loss of Nkx2-1 led to TAN recruitment. TAN recruitment involved SOX2-mediated production of the chemokine CXCL5. Deletion of Nkx2-1 in SL mice (SNL) revealed that NKX2-1 suppresses SOX2-driven squamous tumorigenesis by repressing adeno-to-squamous transdifferentiation. Depletion of TANs in SNL mice reduced squamous tumors, suggesting that TANs foster squamous cell fate. Thus, lineage-defining transcription factors determine the tumor immune microenvironment, which in turn might impact the nature of the tumor.

Keywords: CXCL5; NKX2-1; SOX2; adenocarcinoma; lung cancer; mouse models; squamous; transdifferentiation; tumor immune microenvironment; tumor-associated neutrophils.


Conflict of interest statement

DECLARATION OF INTERESTS

The authors have no competing interests.

Figures

Figure 1.
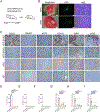
Figure 1.. Murine SOX2-Driven Lung Squamous Tumors Recapitulate Human Pathology
(A) Representative H&E images from indicated GEMM tumors and human LSCC. Scale bars, 200 µm top row, 50 µm bottom row. Boxes on upper panel indicate areas shown in higher magnification on lower panel. (B-D) IHC for KRT5 and DNp63 in indicated mouse and human tumor types (B) and IHC quantification of KRT5 (C) and DNp63 (D). Scale bar, 50 µm. (E-G) IHC for SOX2 and p4EBP1 in indicated mouse and human tumor types (E) and IHC quantification of SOX2 (F) and p4EBP1 (G). Scale bar, 50 µm. (H and I) IHC for SOX2 and p4EBP1 in a panel of 43 human LSCCs (H), and contingency table for binary staining results (I). Scale bar, 50 µm. Error bars indicate mean ± SEM. Two-tailed unpaired t tests, ****p < 0.0001, ***p < 0.001, **p < 0.01, *p < 0.05, ns = not significant. In C, D, F, G, each dot represents one tumor from 3–8 mice per genotype and 6 patient tumors. See also Figure S1.
Figure 2.
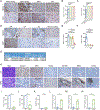
Figure 2.. Mouse Lung Tumors Recapitulate Molecular Phenotype and Tumor Immune Microenvironment of Human Tumors
(A) Heatmap and hierarchical clustering of GEMM lung tumors, normal mouse lung tissue, and human LSCCs based on signature of differentially expressed transcripts from RNA-seq analysis (see Methods). (B) Gene expression heatmap for lung squamous and adenocarcinoma marker genes comparing SL, LP and KP tumors. p < 0.01 Log2FC > 1 as a cutoff. (C) GSEA from mouse (Mm) SL versus KP (top) and KP versus SL (bottom) tumors with normalized enrichment scores (NES) and p values for human (Hs) LSCC versus LADC gene signatures generated from TCGA data. (D) GSEA from mouse SL versus normal lung tissue (top) and SL versus KP tumors (bottom) with NES and p values for T cell and neutrophil gene signatures. (E) IHC for immune cell markers (CD3, T cells; FOXP3, Tregs; CD11B, MPO, LY6G, neutrophils) in indicated GEMM tumors (top), and IHC quantification (bottom). Scale bar, 50 µm. Error bars indicate mean ± SEM. Two-tailed unpaired t tests, ****p < 0.0001, ***p < 0.001, **p < 0.01, *p < 0.05, ns = not significant. Each dot represents one tumor from 3–7 mice per genotype. (F) Heatmap representing selected immune-related genes differentially expressed in SL, LP and KP tumors with p < 0.01 Log2FC > 1 as a cutoff. See also Figure S2 and Table S1.
Figure 3.
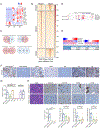
Figure 3.. SOX2 Promotes Tumor-Associated Neutrophil Recruitment in the Absence of Squamous Transdifferentiation
(A) Schematic representation of lentiviral Sox2 or Gfp overexpression in KP mice. (B) Representative whole-mount brightfield (left), fluorescence (middle) and H&E stained histology (right) images from indicated GEMM tumors. Scale bars, 200 µm for brightfield and fluorescence; 50 µm for H&E. (C-I) Representative IHC (C) and IHC quantification for SOX2 (D), DNp63 (E), KRT5 (F), CD11B (G), MPO (H), or LY6G (I) in indicated tumor models. Scale bar, 50 µm. Error bars indicate mean ± SEM. Two-tailed unpaired t tests, ****p < 0.0001, ***p < 0.001, **p < 0.01, ns = not significant. In D-I, each dot represents one tumor from 3–5 mice per genotype.
Figure 4.
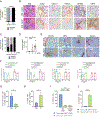
Figure 4.. SOX2 Suppresses NKX2–1 Activity and NKX2–1 Loss Promotes TAN Recruitment in the Absence of Squamous Histotype
(A-C) IHC for NKX2–1 and SPC in indicated mouse tumor genotypes (A) and IHC quantification of NKX2–1 (B) and SPC (C). (D-F) IHC for NKX2–1 and SPC in indicated mouse and human tumors (D) and IHC quantification of NKX2–1 (E) and SPC (F). (G) IPA upstream regulator analysis of RNA-seq data identify SOX2 and NKX2–1 with activation z-scores and p values for SL versus KP tumors. (H-N) Representative IHC (H) and IHC quantification for NKX2–1 (I), SPC (J), SOX2 (K), CD11B (L), MPO (M) and LY6G (N) in indicated tumor models. Scale bars, 50 µm. Error bars indicate mean ± SEM. Two-tailed unpaired t tests, ****p < 0.0001, ***p < 0.001, **p < 0.01, *p < 0.05, ns = not significant. In B, C, E, F, I-N, each dot represents one tumor from 3–8 mice per genotype and 6 patient LSCC tumors. See also Figure S3.
Figure 5.
Figure 5.. SOX2 and NKX2–1 Inversely Regulate Neutrophil Chemoattractant Cxcl5
(A) Gene expression heatmap for genes implicated in neutrophil recruitment in SL, LP and KP tumors. p < 0.01 Log2FC > 1 as a cutoff. (B) ChIP-seq heatmap view of genome-wide binding sites of SOX2 (LP tumors and KPS cells) and NKX2–1 [K tumors (Snyder et al., 2013)]. (C) Venn diagrams indicating the total number of genes that are direct genomic targets of SOX2 and NKX2–1 with the directionality of transcriptional regulation. ChIP-seq data were integrated with RNA-seq data (SL versus KP tumors) and exon array data (KN versus K tumors) to define directionality of transcriptional regulation. p < 0.05 Log2FC > 1 as a cutoff. (D) ChIP analysis of SOX2 and NKX2–1 genomic binding at the Cxcl5 locus in indicated samples. (E) Gene expression heatmaps for SOX2, NKX2–1 and CXCL6 in TCGA Lung Cancer dataset (n = 1,129). Patient samples are sorted based on SOX2 (left) or NKX2–1 (right) expression levels. Pearson correlation coefficient and two-tailed p values for each correlation gene pair is listed as a table (bottom). Data visualized by UCSC Xena Browser. (F and G) IHC for CXCL5 in indicated GEMM lung tumors (F) and IHC quantification (G). (H) Representative H&E images and IHC for CXCL5, CD11B, MPO and LY6G in indicated mouse tumors (top) and IHC quantification (bottom).Scale bars, 50 µm. Error bars indicate mean ± SEM. Two-tailed unpaired t tests, ****p < 0.0001, **p < 0.01, *p < 0.05, ns = not significant. In G and H, each dot represents one tumor from 3–6 mice per genotype. See also Figure S4 and Table S4.
Figure 6.
Figure 6.. Loss of NKX2–1 Dramatically Accelerates Squamous Lung Tumorigenesis
(A) Proportion of SL (n = 25) versus SNL (n = 10) mice with squamous carcinoma at 16 weeks post-infection with Ad5-CMV-Cre. Fisher’s exact test (two-tailed), ****p < 0.0001. (B) Representative images of H&E and IHC for SOX2, NKX2–1, HNF4A, DNp63 and KRT5 in LADC and LSCC tumors in SNL model at 16 weeks post-infection. (C) Percent of mice with DNp63+ tumors in SNL mice at 4 (n = 6 mice), 8 (n = 4), and 12 (n = 4) weeks post-infection. (D) Percent of DNp63+ tumor area over total tumor area in SNL mice at 4 (n = 6 mice), 8 (n = 4), and 12 (n = 4) weeks post-infection. Mann Whitney tests, **p < 0.01, *p < 0.05. Each dot represents one mouse. (E and F) Representative IHC for CD11B, MPO, LY6G and CXCL5 in LADC and LSCC in SNL modeland IHC quantification (F). KP, SL and KPN quantification data is replicated from various other figures for ease of comparison. Each dot represents one tumor from 4 mice per group. (G) Quantification of flow cytometry data for CD11B+LY6G+ neutrophils as percentage of leukocytes (CD45+) in SNL versus KP lungs (n = 4–6 samples per group). (H) Quantification of flow cytometry data for F4/80+ macrophages as percentage of leukocytes (CD45+) in SNL versus KP lungs (n = 6–7 samples per group). (I) Quantification of flow cytometry data for CXCL5+ cancer cells (GFP+CD45-) and leukocytes (GFP-CD45+) in SNL versus normal lungs (n = 4–5 samples per group). (J) Quantification of flow cytometry data for CXCR2+ cancer cells (GFP+CD45-) and TANs (CD45+CD11B+GR1+) in SNL lungs (n = 8 samples per group). Scale bars, 50 µm. Error bars indicate mean ± SEM. Two-tailed unpaired t tests, ****p < 0.0001, ***p < 0.001, **p < 0.01, *p < 0.05, ns = not significant. See also Figure S5.
Figure 7.
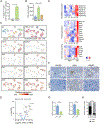
Figure 7.. TANs are Distinct from Peripheral Blood Neutrophils with Pro-tumor Features
(A) Quantification of flow cytometry data for SiglecFhigh cells as percentage of neutrophils (CD45+CD11B+GR1+) in SNL lung tumors (n = 8) versus peripheral blood neutrophils (PBNs) from SNL tumor-bearing mice (n = 2). (B) Quantification of flow cytometry data as geometric mean fluorescence intensity (gMFI) for ROS activity in PBNs, normal lung neutrophils (NNs), and tumor-associated neutrophils (TANs) (n = 4–8 samples per group from n = 2 mice each). Error bars indicate mean ± SEM. Two-tailed unpaired t tests, * p < 0.05. (C) tSNE plots of scRNA-seq data demonstrating all cell clusters (top left), PBN versus TAN cells (top right), and relative expression levels of selected genes (other panels). Flow-sorted samples were derived and pooled from blood or lung tumor of SNL mice (n = 2 each). (D) Volcano plot showing differential gene expression of scRNA-seq data comparing TANs versus PBNs. p < 0.05 Log2FC > 1 as a cutoff (denoted by gray lines parallel to X and Y axes). Selected genes are highlighted (red). (E) Gene expression heatmaps for genes implicated in ROS/RNS production, extracellular matrix (ECM) degradation/cysteine endopeptidase activity, and chemokine signaling based on cell clusters. Gene sets derived from Enrichr analyses. Cell cluster numbers are labeled below each column identified in Figure 7C. p < 0.05 Log2FC > 1 as a cutoff. (F-H) Representative images of IHC for CXCR2, MPO and DNp63 in SNL mice treated with anti-LY6G antibody versus anti-IgG1 control antibody thrice weekly for 3–4 weeks (n = 8 mice per group) (F) and IHC quantification for CXCR2 and MPO (G) and DNp63 (H). Scale bar, 50 µm. In A, B and G, error bars indicate mean ± SEM and two-tailed unpaired t tests, ****p < 0.0001, ** p < 0.005, * p < 0.05. In H, Fisher’s exact test (two-tailed), ****p < 0.0001. See also Figure S6 and Table S5.

Comment in

Similar articles

Cited by

References

    1. Asselin-Labat M-L, and Filby CE (2012). Adult lung stem cells and their contribution to lung tumourigenesis. Open Biol 2, 120094. - PMC - PubMed
    1. Bass AJ, Watanabe H, Mermel CH, Yu S, Perner S, Verhaak RG, Kim SY, Wardwell L, Tamayo P, Gat-Viks I, et al. (2009). SOX2 is an amplified lineage-survival oncogene in lung and esophageal squamous cell carcinomas. Nat. Genet 41, 1238–1242. - PMC - PubMed
    1. Bezzi M, Seitzer N, Ishikawa T, Reschke M, Chen M, Wang G, Mitchell C, Ng C, Katon J, Lunardi A, et al. (2018). Diverse genetic-driven immune landscapes dictate tumor progression through distinct mechanisms. Nat. Med 24, 165–175. - PubMed
    1. Busch SE, Hanke ML, Kargl J, Metz HE, MacPherson D, and Houghton AM (2016). Lung Cancer Subtypes Generate Unique Immune Responses. J. Immunol 197, 4493–4503. - PMC - PubMed
    1. Campbell EL, Bruyninckx WJ, Kelly CJ, Glover LE, McNamee EN, Bowers BE, Bayless AJ, Scully M, Saeedi BJ, Golden-Mason L, et al. (2014). Transmigrating neutrophils shape the mucosal microenvironment through localized oxygen depletion to influence resolution of inflammation. Immunity 40, 66–77. - PMC - PubMed

Publication types

MeSH terms

Substances