. 2018 Oct 16;25(3):677-689.e4.
doi: 10.1016/j.celrep.2018.09.058.

Salt-Responsive Metabolite, β-Hydroxybutyrate, Attenuates Hypertension

Affiliations

Salt-Responsive Metabolite, β-Hydroxybutyrate, Attenuates Hypertension

Saroj Chakraborty et al. Cell Rep. .

Abstract

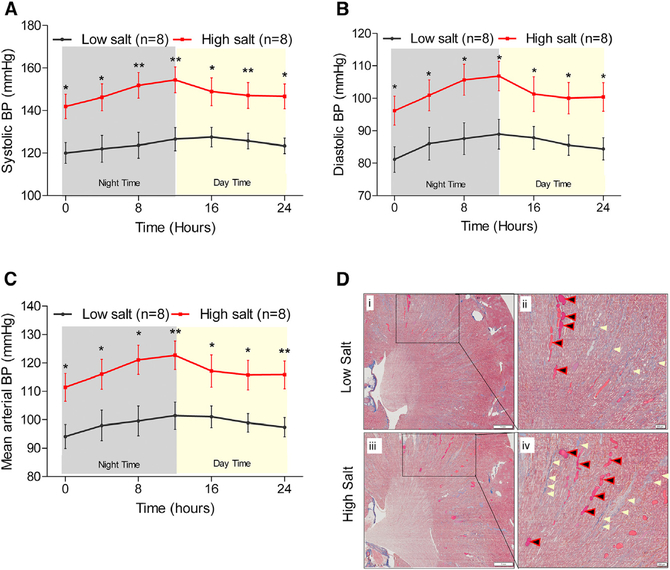
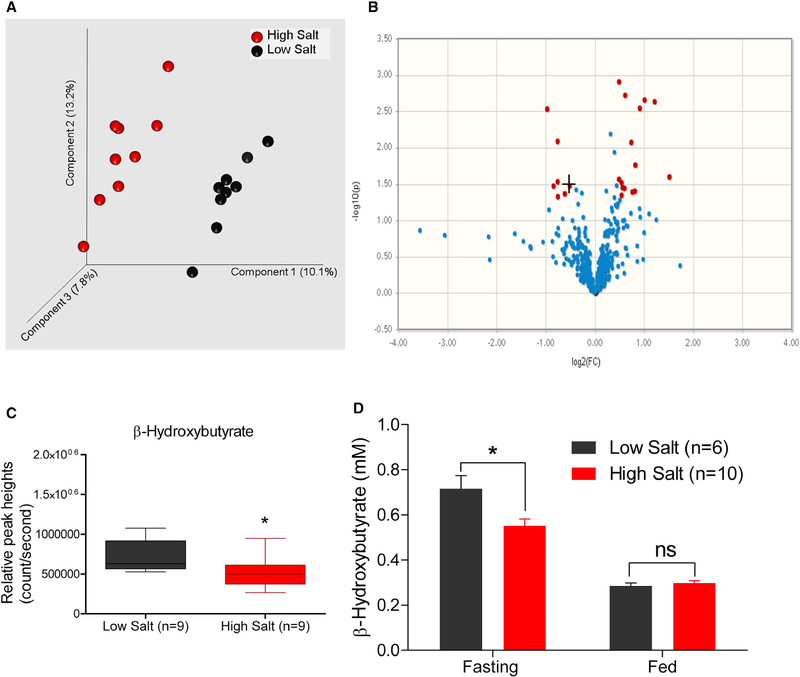
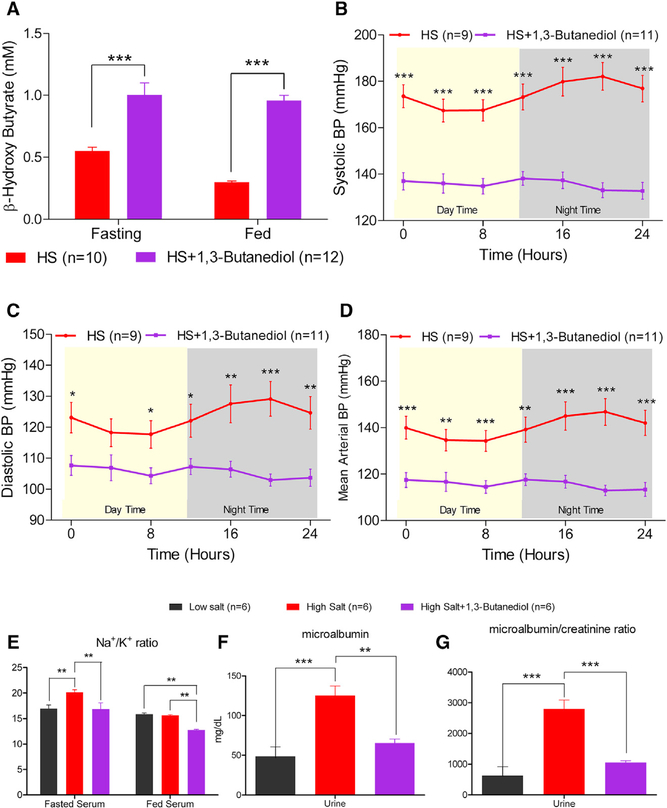
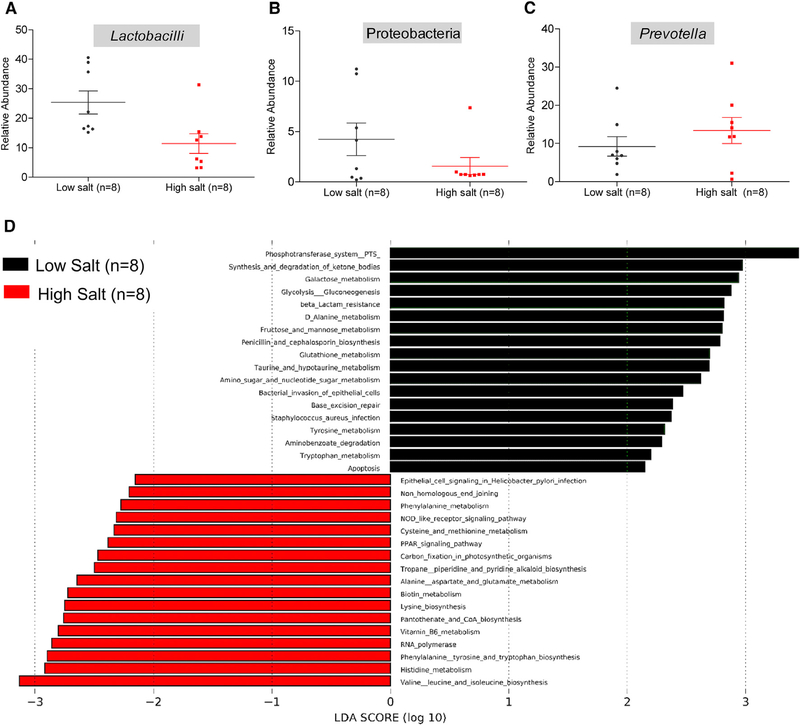
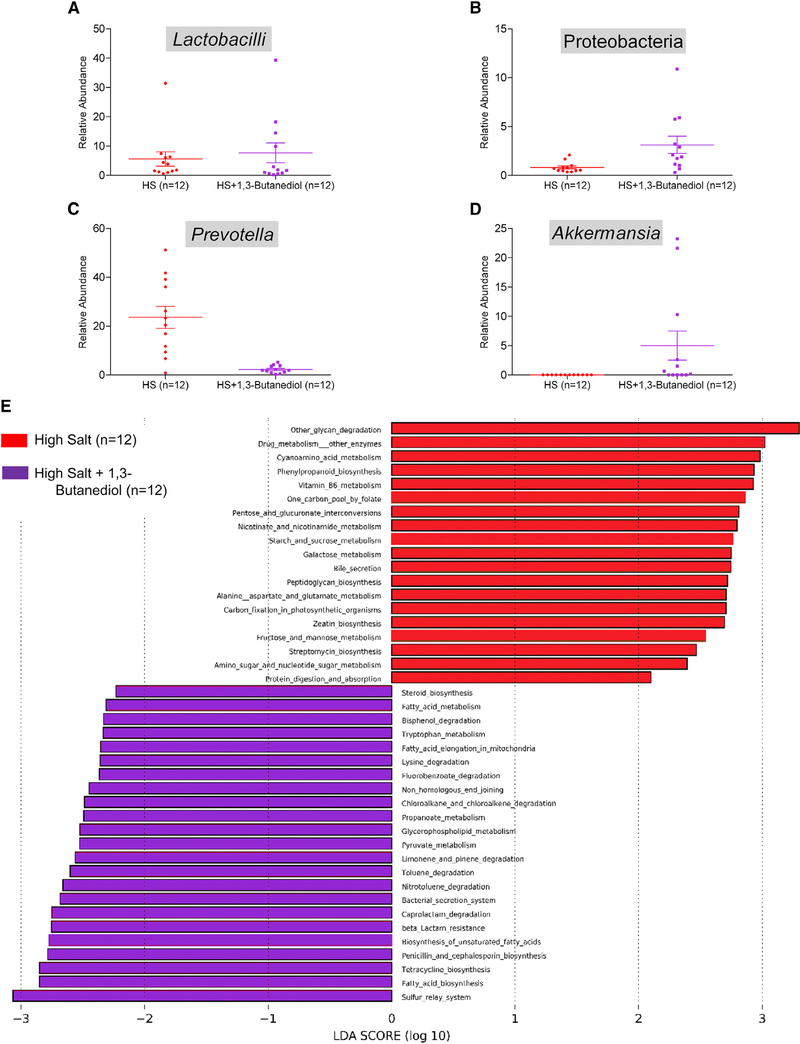
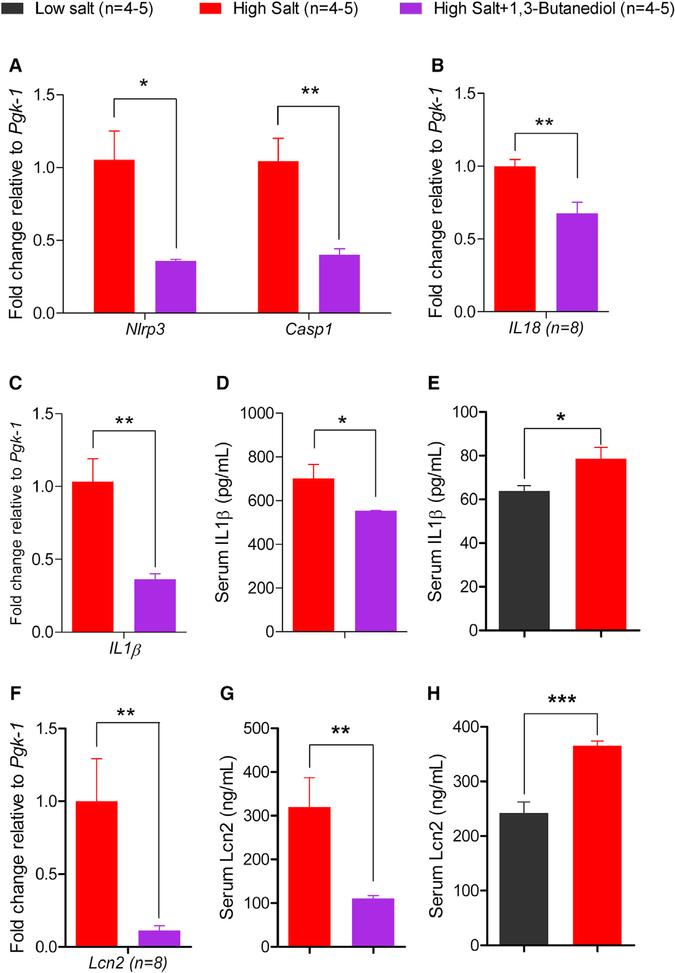
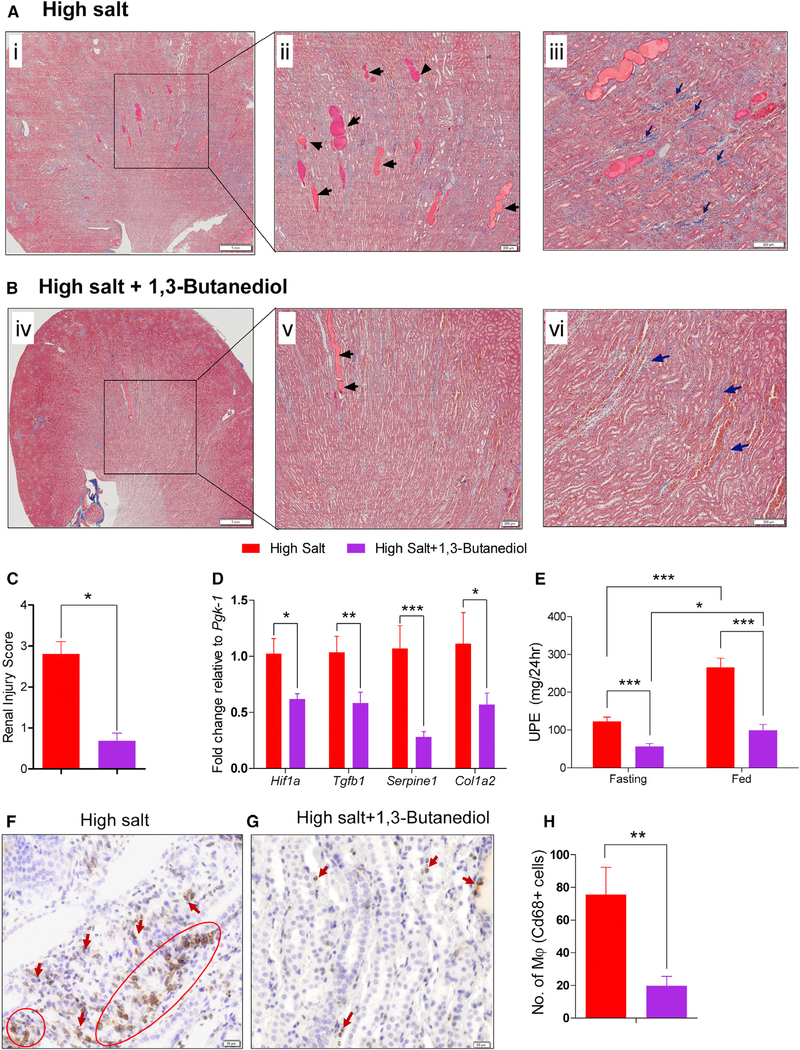
Dietary salt reduction and exercise are lifestyle modifications for salt-sensitive hypertensives. While exercise has prominent metabolic effects, salt has an adverse effect on metabolic syndrome, of which hypertension is a hallmark. We hypothesized that dietary salt impacts metabolism in a salt-sensitive model of hypertension. An untargeted metabolomic approach demonstrates lower circulating levels of the ketone body, beta-hydroxybutyrate (βOHB), in high salt-fed hypertensive rats. Despite the high salt intake, specific rescue of βOHB levels by nutritional supplementation of its precursor, 1,3-butanediol, attenuates hypertension and protects kidney function. This beneficial effect of βOHB was likely independent of gut-microbiotal and Th17-mediated effects of salt and instead facilitated by βOHB inhibiting the renal Nlrp3 inflammasome. The juxtaposed effects of dietary salt and exercise on salt-sensitive hypertension, which decrease and increase βOHB respectively, indicate that nutritional supplementation of a precursor of βOHB provides a similar benefit to salt-sensitive hypertension as exercise.

Keywords: Nlrp3; blood pressure; hypertension; inflammasome; inflammation; ketone body; kidney; metabolomics; salt; β-hydroxybutyrate.


Conflict of interest statement

DECLARATION OF INTERESTS

B.J. and S.C. have an interest in U.S. Patent Application serial no. 62/665,690 filed on May 2, 2018 in this paper regarding nutritional intervention for salt-sensitive hypertension for 1,3-butanediol. All other authors declare no competing interests.

Figures

Figure 1.
Figure 1.. Hemodynamic and Renal Responses to Salt-Loading
(A–C) Systolic (A), diastolic (B), and mean (C) arterial pressure data obtained from BP radio telemetry studies of 50- to 52-day-old rats on low (0.3% NaCl) or on high (2% NaCl) salt containing diets. Black line: data from rats on a low salt diet (n = 8). Red line: data from rats on a high salt diet (n = 8). Data points are 4 hr moving averages. *p < 0.05, **p < 0.01. (D) Representative renal histological images of rats from the low or high salt-fed rats. Left: i and iii display images of low and high salt-fed rat kidney sections stained with Masson’s trichrome (8× magnification). The scale on the left panel (images labeled i and iii) are set at 1 mm. The boxed regions in the left panel were further magnified (40×) into the right panels (ii and iv). The scale on the right panel (images labeled ii and iv) are set at 200 μm (micrometer). Blue areas marked by cream-colored arrows denote staining for collagen, a fibrosis marker. Black/red arrows point to pink-color-filled protein casts.
Figure 2.
Figure 2.. Detection of βOHB as a Metabolite Altered by Dietary Salt
(A) PCA plots of data obtained from untargeted metabolomics analysis of plasma samples. Each sphere represents a single animal. Black spheres: low salt-fed group. Red spheres: high salt-fed group. Distinct clusters of black and red spheres indicate that the groups are dissimilar in their metabolomics profiles. (B) Volcano plot of all detected metabolites by the untargeted GC-TOF-MS. Blue and red dots represent metabolites not significantly and significantly different between low and high salt-fed rats (p < 0.05, fold change [FC] >1.4). +, denotes βOHB. (C) Plasma levels of βOHB. (D) Confirmation of the decreased serum βOHB levels in fasting rats on a high salt diet. *p < 0.05, ns, not significant.
Figure 3.
Figure 3.. Nutritional Intervention with βOHB Lowered Hypertension
Groups of 64- to 65-day-old S rats were administered with (n = 12) or without (n = 10) 20% v/v of 1,3-butanediol in drinking water for 5 weeks. (A–D) Serum levels of βOHB on week 3 post administration of 1,3-butanediol (A), systolic (B), diastolic (C), and mean (D) arterial pressure data recorded by radio telemetry after 3 weeks on 1,3-butanediol. Data points are 4 hr moving averages. (E) Fasted and fed Na+/K+ ratio in serum on week 3 post administration of 1,3-butanediol. (F and G) Microalbumin (F) and microalbumin/creatinine (G) ratio in serum on week 3 post administration of 1,3-butanediol. *p < 0.05, **p < 0.01, ***p < 0.001.
Figure 4.
Figure 4.. Assessment of Microbiotal Profiles and Functional Data from 16S RNA Sequencing of Fecal Samples from S Rats Fed with Low or High Salt
(A–C) Relative abundance of Lactobacilli (A), Proteobacteria (B), and Prevotella (C) in S rats on low or high salt diets. Plotted are dots representing values from each rat along with a mean ± SEM. (D) Functional analysis of microbiotal profiles. Black bars represent functional pathways enriched in the low salt-fed group. Red bars represent functional pathways enriched in the high salt-fed group.
Figure 5.
Figure 5.. Assessment of Microbiotal Profiles and Functional Data from 16S RNA Sequencing of Fecal Samples from S Rats Fed with High Salt or High Salt with 1,3-Butanediol
(A–D) Relative abundance of Lactobacilli (A), Proteobacteria (B), Prevotella (C), and Akkermansia (D) in fecal samples of S rats on a high salt diet either with or without nutritional intervention with 1,3-butanediol. Plotted are dots representing values from each rat along with a mean ± SEM. (E) Bars represent functional pathways. Red color: pathways enriched in the high salt group without 1,3-butanediol. Purple color: pathways enriched in the high salt group administered with 1,3-butanediol.
Figure 6.
Figure 6.. Assessment of Renal Nlrp3 Inflammasome and Related Measures of Inflammation
(A–C) Comparisons of renal quantitative real-time PCR data of Nlrp3 and Casp1 (A), IL18 (B), and IL1β (C) from 1,3-butanediol-treated rats compared to the rats without the 1,3-butanediol treatment. Pgk-1, phosphoglycerokinase-1. (D and E) ELISA data from high salt versus high salt + 1,3-butanediol treated rats (D) and low salt versus high salt fed rats (E), for comparisons of serum IL1β. (F) Same legend as (A)–(C) for Lcn2. (G and H) ELISA data from high salt versus high salt + 1,3-butanediol treated rats (G) and low salt versus high salt fed rats (H) for comparisons of serum Lcn2; *p ≤ 0.05; **p < 0.01, ***p < 0.001.
Figure 7.
Figure 7.. Remission of Kidney Fibrosis, Protein Casts, and Urinary Proteinuria in Rats Treated with βOHB
(A and B) Kidney sections of high salt-fed rats treated without (A) or with (B) 20% v/v of 1,3-butanediol were stained with Masson’s trichrome. Left: i and iv displays the images at low magnification (8×). The boxed regions in the left panel were further magnified (40×) into the right panel (ii and v). Black arrows in (ii) and (v) indicate protein casts; dark blue arrows in (iii) and (vi) denote blue staining for collagen. (C–E) Bar graphs show quantitation of renal injury (n = 4/group) (C), mRNA level of genes encoding for cellular stress and tissue fibrosis (n = 8/group) (D), and UPE (urinary protein excretion) (E). (F and G) Representative images (200× magnification) of kidney sections of high salt fed rats (F) and high salt + 1,3-butanediol fed rats (G) display immunostaining for macrophages (Cd68, brown color). Arrows indicate the infiltration of macrophages in kidney sections. (H) Quantitation of macrophage numbers. Numbers are counts of macrophages; n = 10. 10× magnification fields/group. Values are expressed as mean ± SEM (*p < 0.05, **p < 0.01, ***p < 0.001).

Similar articles

Cited by

References

    1. Abubucker S, Segata N, Goll J, Schubert AM, Izard J, Cantarel BL, Rodriguez-Mueller B, Zucker J, Thiagarajan M, Henrissat B, et al. (2012). Metabolic reconstruction for metagenomic data and its application to the human microbiome. PLoS Comput. Biol 8, e1002358. - PMC - PubMed
    1. Anders HJ, Suarez-Alvarez B, Grigorescu M, Foresto-Neto O, Steiger S, Desai J, Marschner JA, Honarpisheh M, Shi C, Jordan J, et al. (2018). The macrophage phenotype and inflammasome component NLRP3 contributes to nephrocalcinosis-related chronic kidney disease independent from IL-1-mediated tissue injury. Kidney Int. 93, 656–669. - PubMed
    1. Arima S, Uto H, Ibusuki R, Kumamoto R, Tanoue S, Mawatari S, Oda K, Numata M, Fujita H, Oketani M, et al. (2014). Hypertension exacerbates liver injury and hepatic fibrosis induced by a choline-deficient L-amino aciddefined diet in rats. Int. J. Mol. Med 33, 68–76. - PubMed
    1. Bai M, Chen Y, Zhao M, Zhang Y, He JC, Huang S, Jia Z, and Zhang A (2017). NLRP3 inflammasome activation contributes to aldosteroneinduced podocyte injury. Am. J. Physiol. Renal Physiol 312, F556–F564. - PubMed
    1. Barbato JC, Koch LG, Darvish A, Cicila GT, Metting PJ, and Britton SL (1998). Spectrum of aerobic endurance running performance in eleven inbred strains of rats. J. Appl. Physiol. (1985) 85, 530–536. - PubMed

Publication types

MeSH terms