. 2018 Oct 16;25(3):749-760.e6.
doi: 10.1016/j.celrep.2018.09.060.

The p38α Stress Kinase Suppresses Aneuploidy Tolerance by Inhibiting Hif-1α

Affiliations

The p38α Stress Kinase Suppresses Aneuploidy Tolerance by Inhibiting Hif-1α

Susana Simões-Sousa et al. Cell Rep. .

Abstract

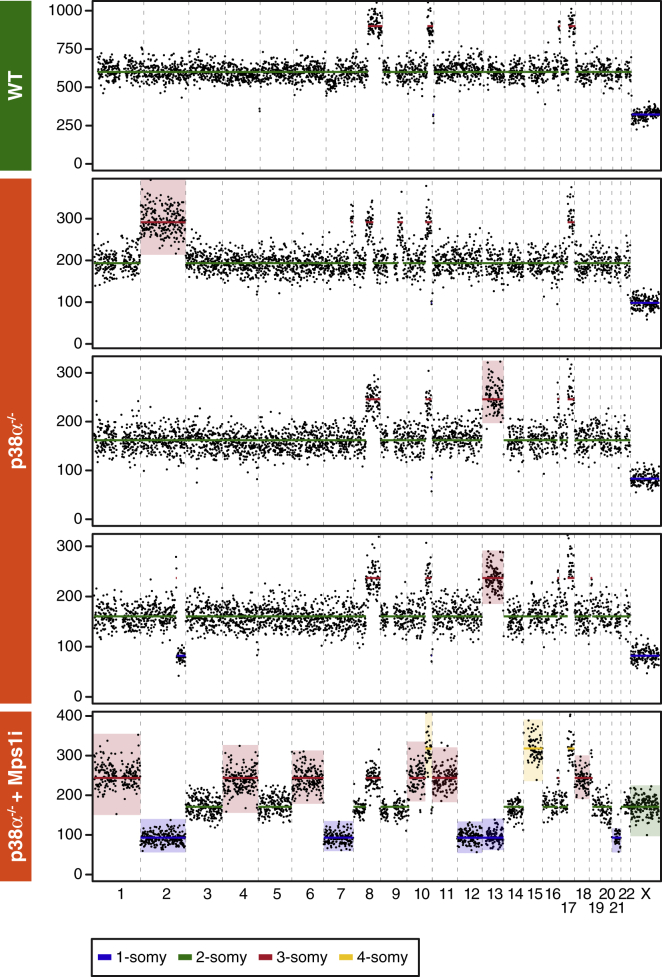
Deviating from the normal karyotype dramatically changes gene dosage, in turn decreasing the robustness of biological networks. Consequently, aneuploidy is poorly tolerated by normal somatic cells and acts as a barrier to transformation. Paradoxically, however, karyotype heterogeneity drives tumor evolution and the emergence of therapeutic drug resistance. To better understand how cancer cells tolerate aneuploidy, we focused on the p38 stress response kinase. We show here that p38-deficient cells upregulate glycolysis and avoid post-mitotic apoptosis, leading to the emergence of aneuploid subclones. We also show that p38 deficiency upregulates the hypoxia-inducible transcription factor Hif-1α and that inhibiting Hif-1α restores apoptosis in p38-deficent cells. Because hypoxia and aneuploidy are both barriers to tumor progression, the ability of Hif-1α to promote cell survival following chromosome missegregation raises the possibility that aneuploidy tolerance coevolves with adaptation to hypoxia.

Keywords: aneuploidy; chromosome instability; mitosis.


Figures

None
Graphical abstract
Figure 1
Figure 1
SB203580 Suppresses Apoptosis following Chromosome Missegregation (A) Immunoblots showing p53 loss following CRISPR/Cas9-mediated mutation of TP53. (B and C) Line graphs (B) and cell fate profiles (C) showing that p53 mutation and exposure to the p38 inhibitor SB203580 suppress apoptosis induced by the Mps1 inhibitor AZ3146. In (B), values show mean ± SD from three technical replicates and are representative of three independent experiments. In (C), numbers in bars indicate the percentage of cells exhibiting the fate indicated by bar color. See also Figure S1.
Figure 2
Figure 2
p38 Is Activated following Induction of Whole-Chromosome Aneuploidy (A) Time-lapse image sequences of HCT116 cells expressing GFP-H2B exposed to the Cenp-E inhibitor GSK923295 then AZ3146 to induce missegregation of polar chromosomes. Numbers represent minutes after imaging started; AZ3146 was added at t = 9 min. Scale bar, 10 μm. (B) Canonical p38 MAPK pathway showing upstream regulators and downstream targets. (C) Immunoblots of post-mitotic cells harvested at the time points indicated following exposure to GSK923295 then AZ3146. See also Figure S2.
Figure 3
Figure 3
p38α Promotes Apoptosis following Chromosome Missegregation (A) Immunoblot showing p38α loss following CRISPR/Cas9-mediated mutation of MAPK14. (B) Immunoblots of parental and p38α null cells exposed to H2O2 for 30 min (left) or AZ3146 for 24 hr (right). Arrow highlights a background band. (C–E) Line graphs (C), cell fate profiles (D), and colony formation assay (E) showing suppression of AZ3146-induced apoptosis in p38α null cells. In (C), values show mean ± SD from three technical replicates and are representative of three independent experiments. Quantitation in (E) shows the mean ± SD derived from two independent experiments. See also Figure S3.
Figure 4
Figure 4
p38α Promotes p53 Stabilization following Chromosome Missegregation (A) Immunoblot showing expression of a GFP-p53 fusion protein following CRISPR/Cas9-mediated targeting of TP53. (B) Immunofluorescence images and quantitation showing nuclear GFP-p53 following exposure to Nutlin-3 and AZ3146. Scale bar, 10 μm. Box and whisker plot shows median, interquartile range, and full range from 431 cells per condition from one biological replicate. ∗∗∗∗p < 0.0001. (C) Line graph showing accumulation of green fluorescence in GFP-p53 cells following exposure to Nutlin-3 and AZ3146. (D) Line graphs showing reduced accumulation of green fluorescence in p38α null cells exposed to AZ3146 and restoration following p38α rescue. In (C) and (D) values show mean ± SD from three technical replicates and is representative of three independent experiments. (E) Cell fate profiles of GFP-p53 cells showing suppression of AZ3146-induced apoptosis in p38α null cells and restoration in p38α rescue cells. See also Figure S4.
Figure 5
Figure 5
p38α Promotes Post-mitotic Apoptosis by Suppressing Hif-1α (A) Line graphs showing the extracellular acidification rate (ECAR) and oxygen consumption rate (OCR) in parental and p38α null cells after exposure to AZ3146 for 24 hr. Values show mean ± SEM from three independent experiments (see Table S1), normalized to the maximal value observed in untreated parental cells. (B) Immunoblot showing elevated Hif-1α in p38α null cells. (C) Immunoblot showing RNAi-mediated repression of Hif-1α; note also elevated Hif-1α in control p38α null cells. (D and E) Line graphs (D) and fate profiles (E) showing restoration of AZ3146-mediated apoptosis in p38α null cells following siHif-1α. In (D), values show mean ± SD from two technical replicates and is representative of three independent experiments. See also Figure S5.
Figure 6
Figure 6
p38α-Deficient Cells Accumulate Whole-Chromosome Αneuploidies Genome-wide chromosome copy-number profile of parental and p38α null cells as determined by single-cell sequencing, with colored boxes highlighting whole-chromosome aneuploidies not observed in parental cells. See also Figure S6.
Figure 7
Figure 7
Pharmacological Inhibition of p38 Facilitates Expansion of Aneuploid Clones (A) Experimental design generating clones in the presence or absence of the p38 inhibitor SB203580 following exposure to AZ3146. (B) Chromosome counts showing the deviation from the modal number of 45, analyzing 25 spreads from at least 10 independent clones for each condition. (C) Box and whisker plot showing the average deviation from 45 for clones exposed to AZ3146 ± SB203580. ∗∗p < 0.01. (D) Representative M-FISH karyotypes from clones 5A and 5C, both generated in the continuous presence of SB203580. Boxes highlight whole-chromosome aneuploidies. (E) Quantitation of M-FISH karyotypes showing recurrent trisomies for chromosome 2, 9, and 19 (clone 5A) and chromosome 18 (clone 5C). See also Figure S7.

References

    1. Abdel-Rahman W.M., Katsura K., Rens W., Gorman P.A., Sheer D., Bicknell D., Bodmer W.F., Arends M.J., Wyllie A.H., Edwards P.A. Spectral karyotyping suggests additional subsets of colorectal cancers characterized by pattern of chromosome rearrangement. Proc. Natl. Acad. Sci. USA. 2001;98:2538–2543. - PMC - PubMed
    1. Baker D.J., Jeganathan K.B., Cameron J.D., Thompson M., Juneja S., Kopecka A., Kumar R., Jenkins R.B., de Groen P.C., Roche P., van Deursen J.M. BubR1 insufficiency causes early onset of aging-associated phenotypes and infertility in mice. Nat. Genet. 2004;36:744–749. - PubMed
    1. Bakker B., Taudt A., Belderbos M.E., Porubsky D., Spierings D.C., de Jong T.V., Halsema N., Kazemier H.G., Hoekstra-Wakker K., Bradley A. Single-cell sequencing reveals karyotype heterogeneity in murine and human malignancies. Genome Biol. 2016;17:115. - PMC - PubMed
    1. Beach R.R., Ricci-Tam C., Brennan C.M., Moomau C.A., Hsu P.H., Hua B., Silberman R.E., Springer M., Amon A. Aneuploidy causes non-genetic individuality. Cell. 2017;169:229–242.e21. - PMC - PubMed
    1. Bennett A., Bechi B., Tighe A., Thompson S., Procter D.J., Taylor S.S. Cenp-E inhibitor GSK923295: Novel synthetic route and use as a tool to generate aneuploidy. Oncotarget. 2015;6:20921–20932. - PMC - PubMed

Publication types

MeSH terms

Substances

LinkOut - more resources