. 2018 Oct 16;25(3):798-810.e6.
doi: 10.1016/j.celrep.2018.09.048.

Genetic Architecture of Adaptive Immune System Identifies Key Immune Regulators

Affiliations

Genetic Architecture of Adaptive Immune System Identifies Key Immune Regulators

Vasiliki Lagou et al. Cell Rep. .

Abstract

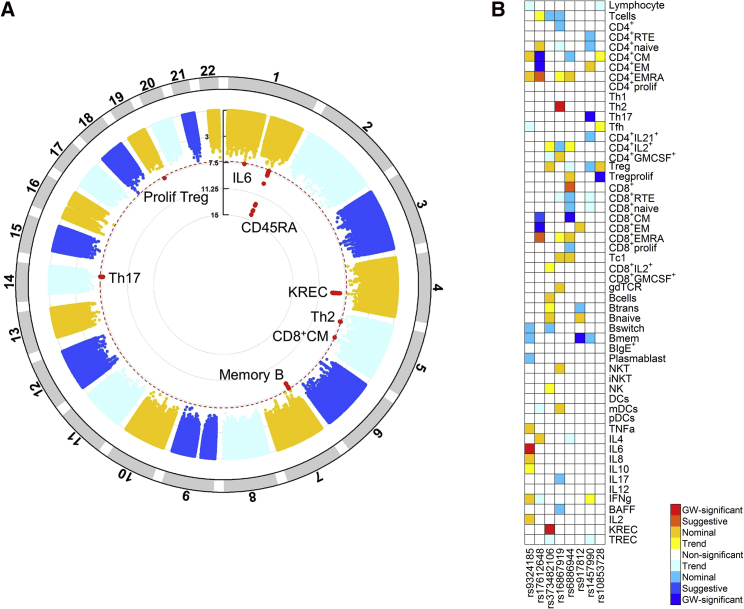
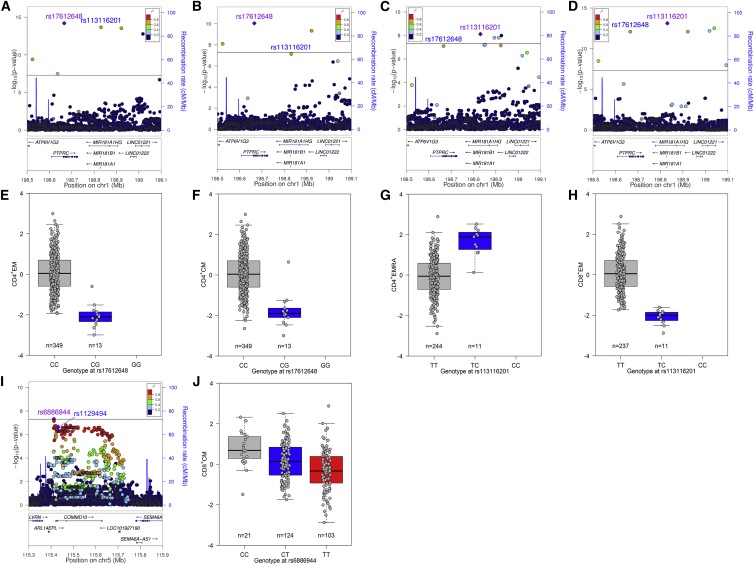
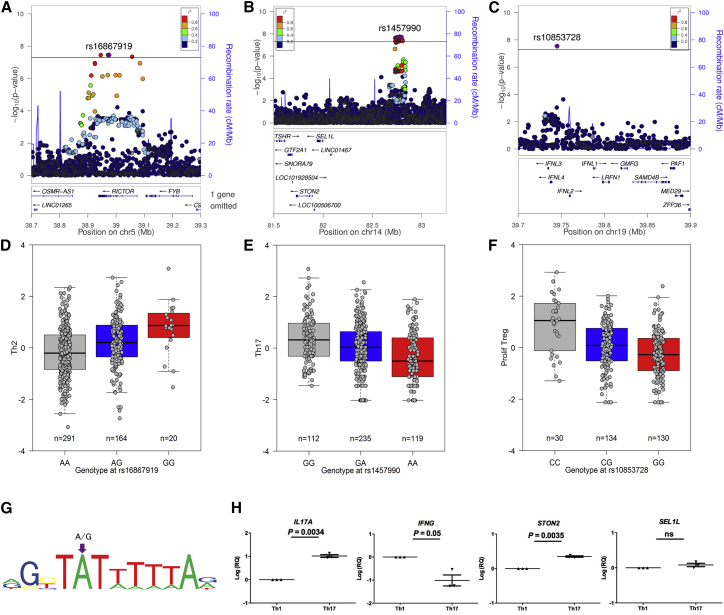
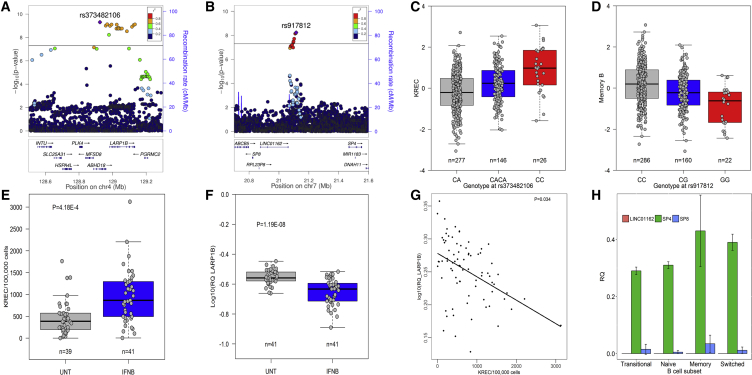
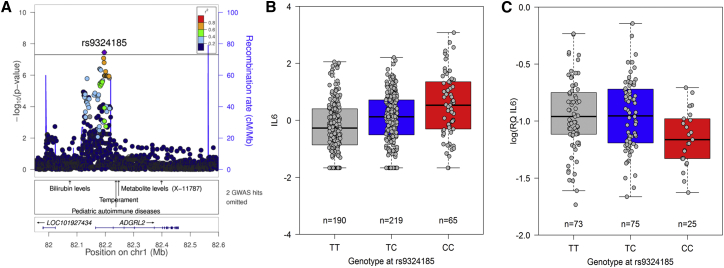
The immune system is highly diverse, but characterization of its genetic architecture has lagged behind the vast progress made by genome-wide association studies (GWASs) of emergent diseases. Our GWAS for 54 functionally relevant phenotypes of the adaptive immune system in 489 healthy individuals identifies eight genome-wide significant associations explaining 6%-20% of variance. Coding and splicing variants in PTPRC and COMMD10 are involved in memory T cell differentiation. Genetic variation controlling disease-relevant T helper cell subsets includes RICTOR and STON2 associated with Th2 and Th17, respectively, and the interferon-lambda locus controlling regulatory T cell proliferation. Early and memory B cell differentiation stages are associated with variation in LARP1B and SP4. Finally, the latrophilin family member ADGRL2 correlates with baseline pro-inflammatory interleukin-6 levels. Suggestive associations reveal mechanisms of autoimmune disease associations, in particular related to pro-inflammatory cytokine production. Pinpointing these key human immune regulators offers attractive therapeutic perspectives.

Keywords: adaptive immune system; association; autoimmunity; genetics; genome-wide association; immune phenotype; susceptibility.


Figures

None
Graphical abstract
Figure 1
Figure 1
Genome-wide Significant Genotype-Immune Phenotype Associations (A) Circos plot demonstrating eight regions reaching genome-wide significant association with immune phenotypes. The y axis displays the negative logarithm of the p value. Variants reaching genome-wide significance (p < 5 × 10−8, dotted red line) are depicted in red, and the corresponding trait with which the variant is associated is indicated. (B) Overview of the association of eight independent lead variants reaching genome-wide significance to at least one immune phenotype with all 54 immune phenotypes (see also Table S1 for definitions of immune phenotypes). Darkest colors indicate genome-wide significant associations, whereas red and blue colors distinguish a positive or negative direction of effect, respectively. Genome-wide (GW) significant, suggestive, nominal, and trend correspond to p values < 5 × 10−8, < 1 × 10−4, < 0.05, and < 0.10, respectively.
Figure 2
Figure 2
Coding and Splicing Variants Involved in T Cell Memory Differentiation (A–H) Regional association plots (A–D) and boxplots (E–H) for PTPRC variants with CD4+ effector memory (EM) T cells (A and E), CD4+ central memory (CM) T cells (B and F), CD4+ terminally differentiated (EMRA) T cells (C and G), and CD8+ EM cells (D and H). Variant rs17612648 disrupts an exonic splicing silencer for PTPRC exon 4 (CD45RA splice form) and is in LD with rs113116201 (see also Table S3). (I and J) Regional association plot (I) and boxplot (J) for the COMMD10 region with CD8+ CM cells. The lead variant rs6886944 is in high LD with synonymous coding variant rs1129494. In regional association plots, the x axis depicts the position on the chromosome and RefSeq genes, the left y axis indicates the negative logarithm of the p value for each variant (with the horizontal line corresponding to genome-wide significance or p < 5 × 10−8), and the right y axis shows recombination rates. The lead variant is indicated with a purple diamond and text, other variants of interest are indicated in blue text, and LD of other variants with the lead variant is color-coded based on r2 in the 1000 Genomes November 2014 European (EUR) database. In boxplots, boxes indicate median and interquartile range, with whiskers extending to 1.5× the interquartile range.
Figure 3
Figure 3
Genetic Variants Associated with T Helper Subset Differentiation and Proliferation (A–G) Regional association (A–C) and boxplots (D–F) for T helper 2 (Th2) (A and D), T helper 17 (Th17) (B and E), and proliferating regulatory T cells (Tregs) (C and F). Legends as in Figure 2. (G) Lead associated variant in RICTOR is predicted to disrupt the T cell transcription factor MEF2-binding site. (H) Among three candidate genes (STON2, SEL1L, and LINC01467) within a 1-Mb interval in the chromosome 14 region, STON2 was the only gene differentially expressed in Th17 versus Th1 cells differentiated from naive CD4+ T cells. Expression of LINC01467 was undetectable and not shown. IL17A and IFNG were included as positive controls for Th17 and Th1 cells, respectively. Mean and SEM for triplicate measurements from three donors are shown; relative quantity (RQ) was normalized using a T cell housekeeping gene (RPL13A) and was log-transformed for analysis.
Figure 4
Figure 4
Genetic Variants Associated with B Cell Differentiation (A–G) Regional association plots (A and B) and boxplots (C and D) for sjKREC levels (A and C) and memory B cells (B and D). Treatments known to increase early B cells such as interferon-beta (IFNB) compared to untreated multiple sclerosis patients (UNT) increased KREC levels (E) and decreased LARP1B gene expression (F), with an inverse correlation between LARP1B and KREC levels (G) (simplex measurements in PBMCs from 82 individuals). (H) Among genes in the chromosome 7 region (LINC01162, SP4, and SP8), only SP4 is highly expressed in B cell subsets. Mean and SD of gene expression levels (triplicate measurements from four donors) is depicted. Additional legend as in Figure 2.
Figure 5
Figure 5
Genetic Control of Pro-inflammatory Cytokine Production (A) Regional association plot for ex vivo plasma interleukin-6 levels additionally depicting known GWAS hits in this region, including a variant associated with pediatric autoimmune diseases but in weak LD (r2 = 0.055). (B and C) Boxplot for ex vivo plasma interleukin-6 levels (B) and interleukin-6 gene expression (C) in RNA extracted from PBMCs (simplex measurements from 173 individuals) (p = 0.16). Additional legend as in Figure 2.

Similar articles

Cited by

References

    1. Abecasis G.R., Auton A., Brooks L.D., DePristo M.A., Durbin R.M., Handsaker R.E., Kang H.M., Marth G.T., McVean G.A., 1000 Genomes Project Consortium An integrated map of genetic variation from 1,092 human genomes. Nature. 2012;491:56–65. - PMC - PubMed
    1. Aguirre-Gamboa R., Joosten I., Urbano P.C.M., van der Molen R.G., van Rijssen E., van Cranenbroek B., Oosting M., Smeekens S., Jaeger M., Zorro M. Differential effects of environmental and genetic factors on T and B cell immune traits. Cell Rep. 2016;17:2474–2487. - PMC - PubMed
    1. Baurecht H., Hotze M., Brand S., Büning C., Cormican P., Corvin A., Ellinghaus D., Ellinghaus E., Esparza-Gordillo J., Fölster-Holst R., Psoriasis Association Genetics Extension Genome-wide comparative analysis of atopic dermatitis and psoriasis gives insight into opposing genetic mechanisms. Am. J. Hum. Genet. 2015;96:104–120. - PMC - PubMed
    1. Blaeser F., Ho N., Prywes R., Chatila T.A. Ca(2+)-dependent gene expression mediated by MEF2 transcription factors. J. Biol. Chem. 2000;275:197–209. - PubMed
    1. Boyle A.P., Hong E.L., Hariharan M., Cheng Y., Schaub M.A., Kasowski M., Karczewski K.J., Park J., Hitz B.C., Weng S. Annotation of functional variation in personal genomes using RegulomeDB. Genome Res. 2012;22:1790–1797. - PMC - PubMed

Publication types

MeSH terms

Substances