. 2018 Oct 17;13(10):e0205322.
doi: 10.1371/journal.pone.0205322. eCollection 2018.

Personalized expression of bitter 'taste' receptors in human skin

Affiliations

Personalized expression of bitter 'taste' receptors in human skin

Lauren Shaw et al. PLoS One. .

Abstract

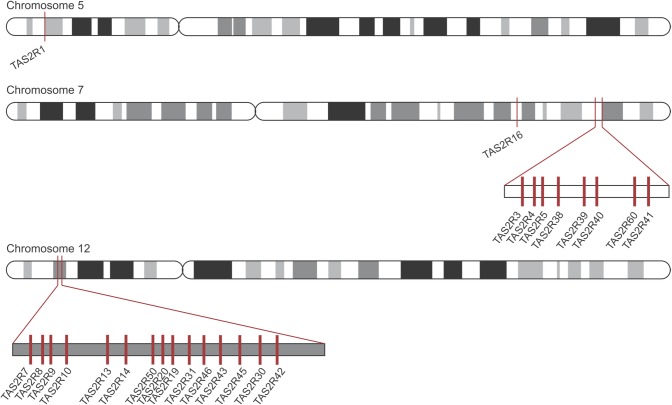
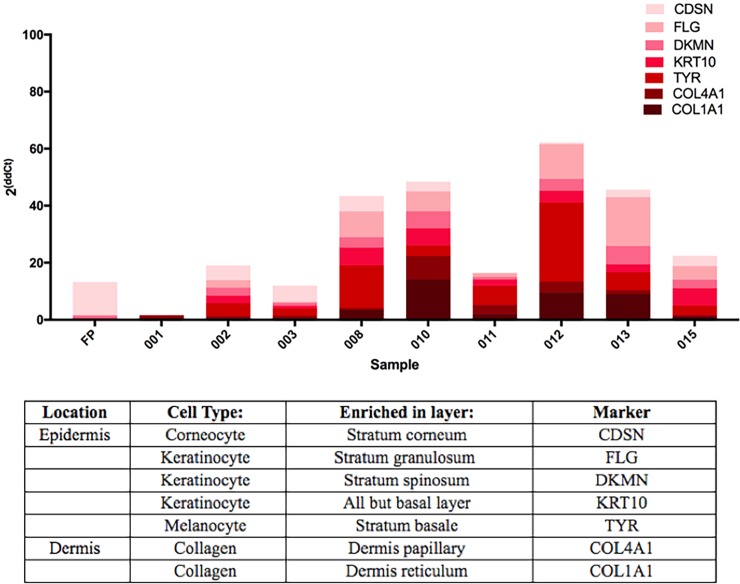
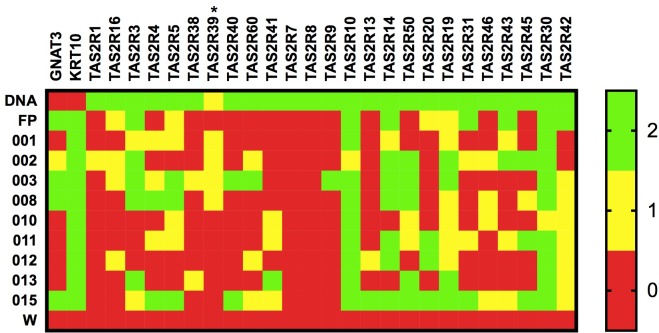
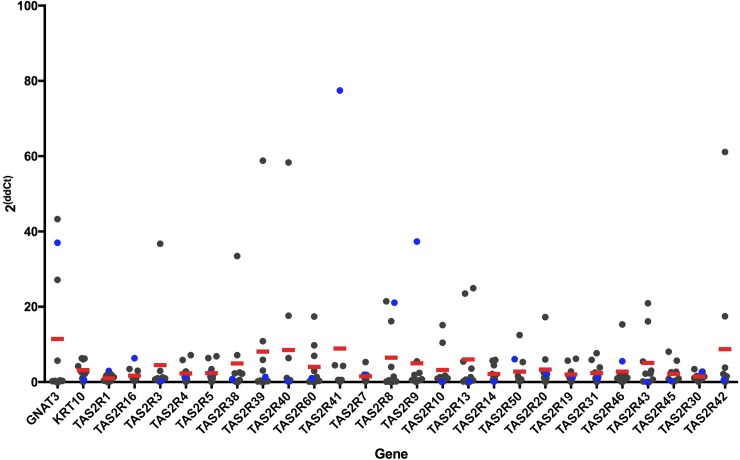
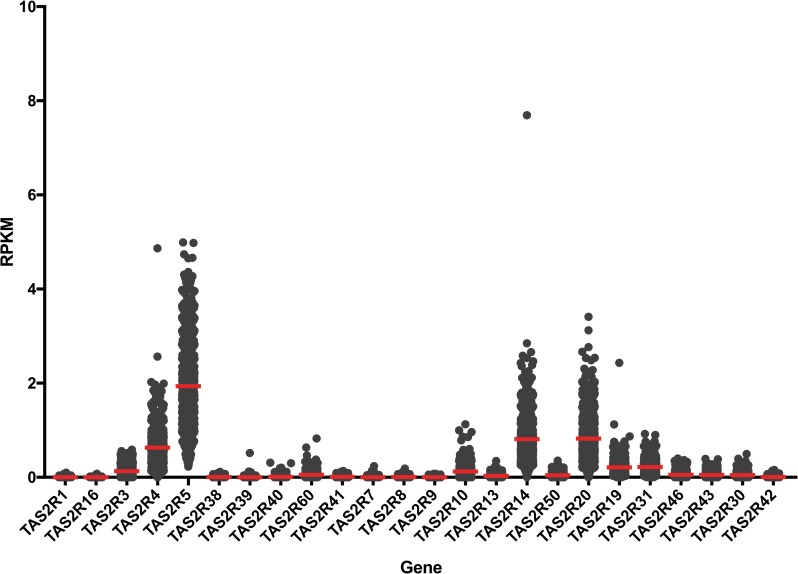
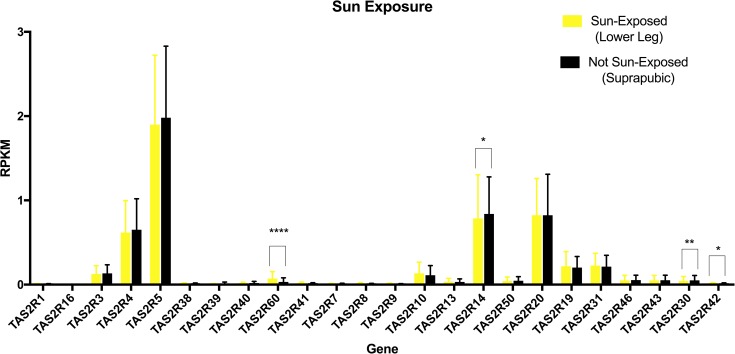
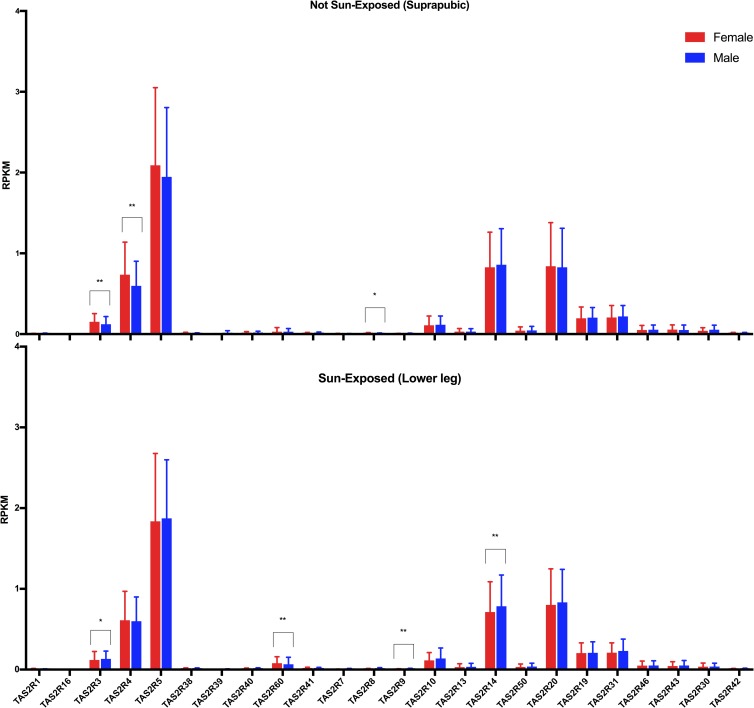
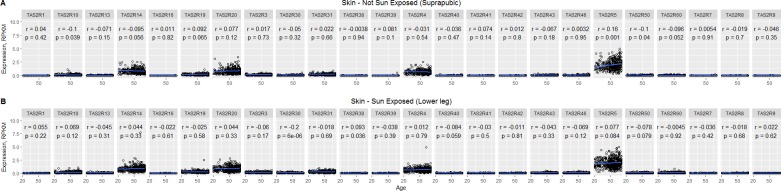
The integumentary (i.e., skin) and gustatory systems both function to protect the human body and are a first point of contact with poisons and pathogens. These systems may share a similar protective mechanism because, as we show here, both human taste and skin cells express mRNA for bitter 'taste' receptors (TAS2Rs). We used gene-specific methods to measure mRNA from all known bitter receptor genes in adult human skin from freshly biopsied samples and from samples collected at autopsy from the Genotype-Tissue Expression project. Human skin expressed some but not all TAS2Rs, and for those that were expressed, the relative amounts differed markedly among individuals. For some TAS2Rs, mRNA abundance was related to presumed sun exposure based on the location from which the skin sample was collected (TAS2R14, TAS2R30, TAS2R42, and TAS2R60), sex (TAS2R3, TAS2R4, TAS2R8, TAS2R9, TAS2R14, and TAS2R60), and age (TAS2R5), although these effects were not large. These findings contribute to our understanding of extraoral expression of chemosensory receptors.


Conflict of interest statement

The nature of our funding source, in this case, Esteé Lauder, does not alter our adherence to PLOS ONE policies on sharing data and materials.

Figures

Fig 1
Fig 1. Bitter receptor locations in the human genome.
The location of TAS2R genes on human chromosomes 5, 7, and 12 marked by red bars.
Fig 2
Fig 2. Quantification of skin-specific gene expression—qPCR results from cDNA of FP and skin samples.
Data are from amplification of skin-specific markers characterized in the table [14, 15]. Data from all markers are represented in order of skin layer for each individual biopsy, with the top of the epidermis (CDSN) as the lightest bar section and the bottom of the dermis (COL1A1) as the darkest bar section. Results were standardized to the housekeeping gene GAPDH and expressed as 2ΔΔCt.
Fig 3
Fig 3. Results from two rounds of PCR.
Each column is labeled by a gene, with members of the TAS2R family in the order of location on human chromosomes. Each row is labeled by a sample ID, where ‘gDNA’ represents genomic DNA (positive control), 'FP' represents taste tissue, and 'W' represents water (a negative control). Green box, bands in both experiments; yellow box, bands in one experiment; red box, no bands. * indicates that there was only one PCR experiment for that gene.
Fig 4
Fig 4. Quantification of bitter taste-related gene expression—qPCR results from cDNA of skin samples after amplification for genes of interest.
cDNA was amplified with primers for GNAT3, KRT10, and the 25 TAS2R genes. Data were standardized to the housekeeping gene GAPDH, and 2ΔΔCt was calculated. Results were plotted with individual values in gray and mean across all subjects in red (n = 9). Data points for the FP sample are in blue.
Fig 5
Fig 5. Expression levels of TAS2R genes from RNA-seq obtained from the GTEx database.
Data are plotted with individual RPKM values in gray points and mean across all samples in red lines (N = 914).
Fig 6
Fig 6. Effect of sun exposure on TAS2R expression from the GTEx data.
Expression levels of bitter receptor genes from RNA-seq obtained from the GTEx database are separated based on sun exposure. Data are plotted as mean and SD across subjects that donated both skin sample types (N = 299 for each sample type). *p<0.05, **p<0.01, ***p < 0.001; ****p < 0.0001.
Fig 7
Fig 7. Effect of sex on TAS2R expression from the GTEx data.
Expression levels of bitter receptor genes from RNA-seq obtained from the GTEx database are separated based on sex and presumed sun exposure. Data are plotted as mean and SD across males (N = 603) and females (N = 311) that donated both skin sample types. *p<0.05, **p<0.01, ***p < 0.001; ****p < 0.0001.
Fig 8
Fig 8. Correlation plots of TAS2R expression against age from the GTEx data.
Individual RPKM data are plotted separated by sun exposure and in order of increasing age of the subject for each receptor. R values and p values are given on the corresponding plot.

References

    1. Reed DR, Knaapila A. Genetics of taste and smell: poisons and pleasures. Prog Mol Biol Transl Sci. 2010;94:213–40. Epub 2010/11/03. B978-0-12-375003-7.00008-X [pii] 10.1016/S1877-1173(10)94008-8 ; PubMed Central PMCID: PMCPMC3342754. - DOI - PMC - PubMed
    1. Lee RJ, Cohen NA. Taste receptors in innate immunity. Cell Mol Life Sci. 2015;72(2):217–36. 10.1007/s00018-014-1736-7 ; PubMed Central PMCID: PMCPMC4286424. - DOI - PMC - PubMed
    1. Zheng K, Lu P, Delpapa E, Bellve K, Deng R, Condon JC, et al. Bitter taste receptors as targets for tocolytics in preterm labor therapy. FASEB J. 2017;31(9):4037–52. 10.1096/fj.201601323RR ; PubMed Central PMCID: PMCPMC5572693. - DOI - PMC - PubMed
    1. Shah AS, Ben-Shahar Y, Moninger TO, Kline JN, Welsh MJ. Motile cilia of human airway epithelia are chemosensory. Science. 2009;325:1131–4. 10.1126/science.1173869 . - DOI - PMC - PubMed
    1. Janssen S, Laermans J, Verhulst PJ, Thijs T, Tack J, Depoortere I. Bitter taste receptors and -gustducin regulate the secretion of ghrelin with functional effects on food intake and gastric emptying. Proc Natl Acad Sci USA. 2011. 10.1073/pnas.1011508108 - DOI - PMC - PubMed

Publication types