

Transcriptome Profiling of Two Ornamental and Medicinal Papaver Herbs
- PMID: 30332811
- PMCID: PMC6213990
- DOI: 10.3390/ijms19103192
Transcriptome Profiling of Two Ornamental and Medicinal Papaver Herbs
Abstract
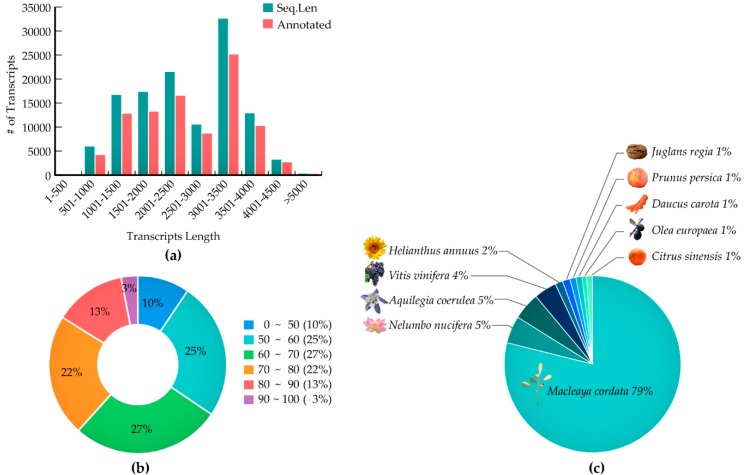
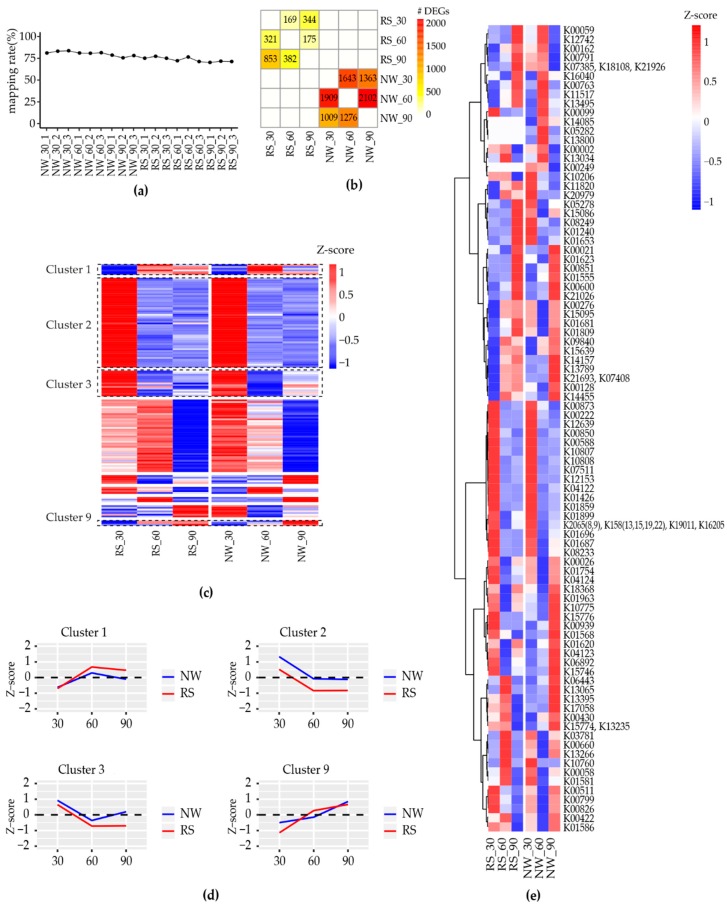
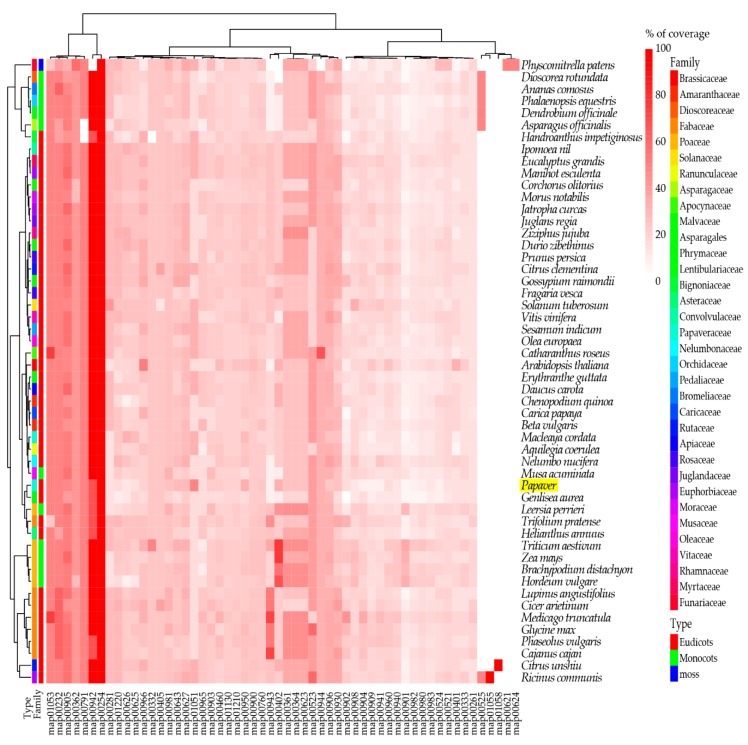
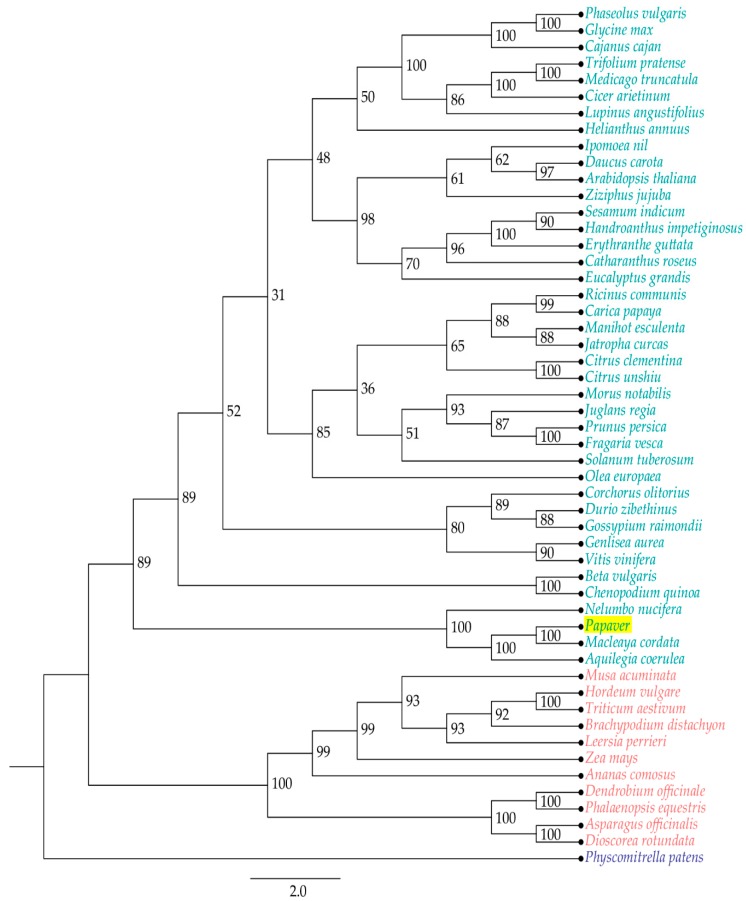
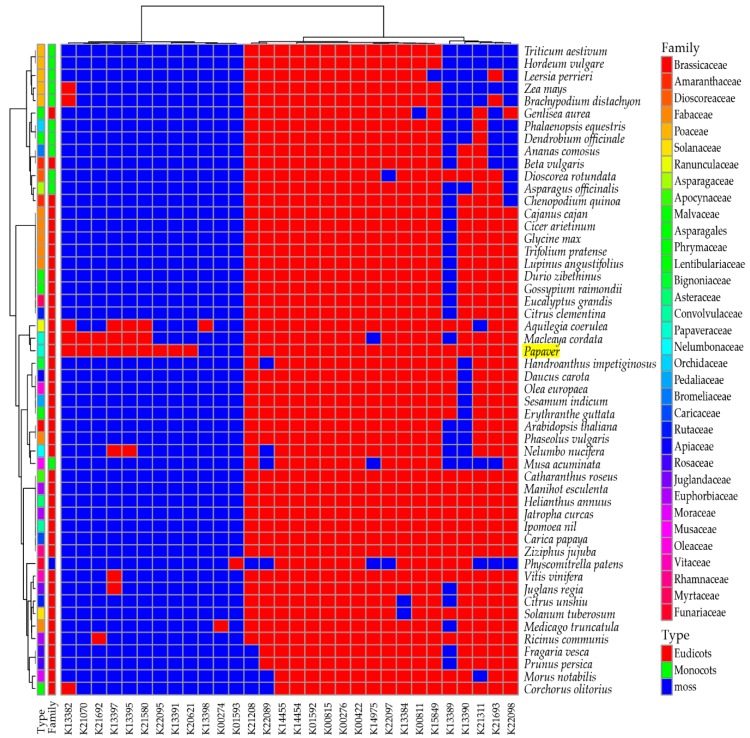
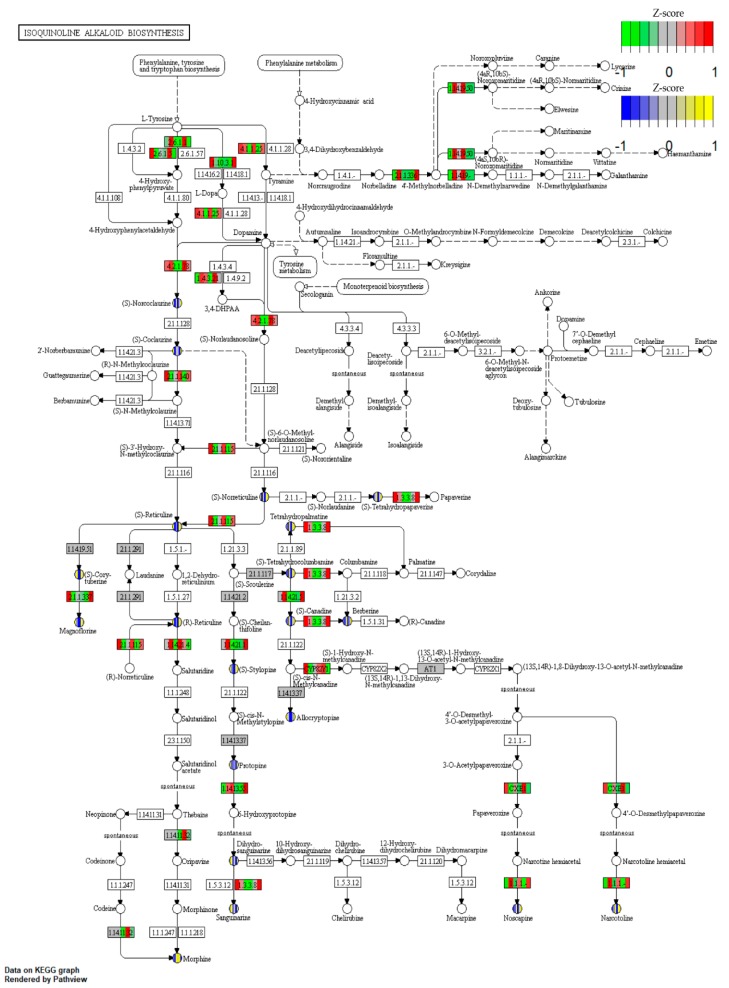
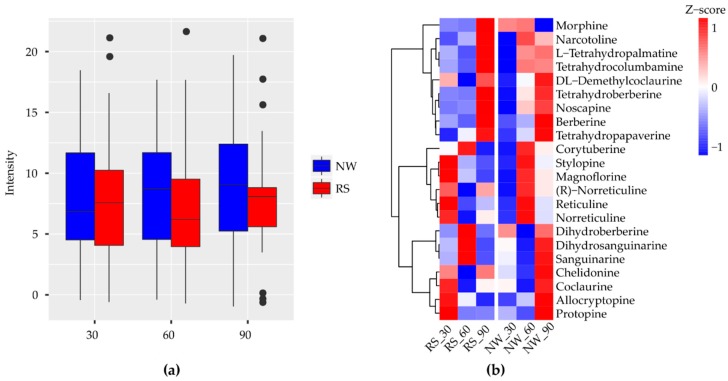
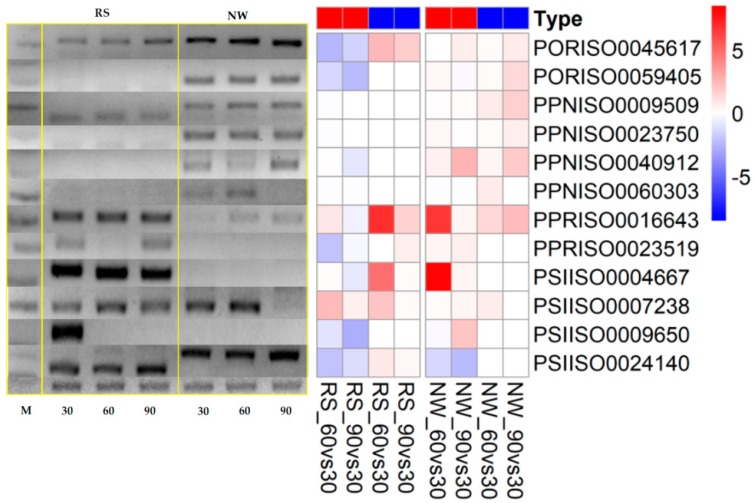
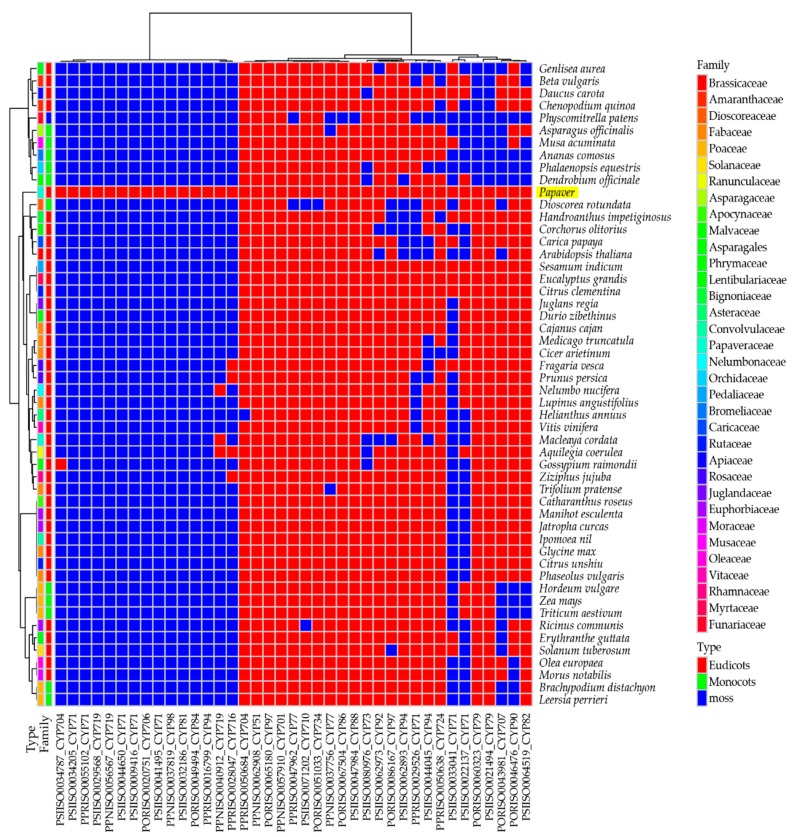
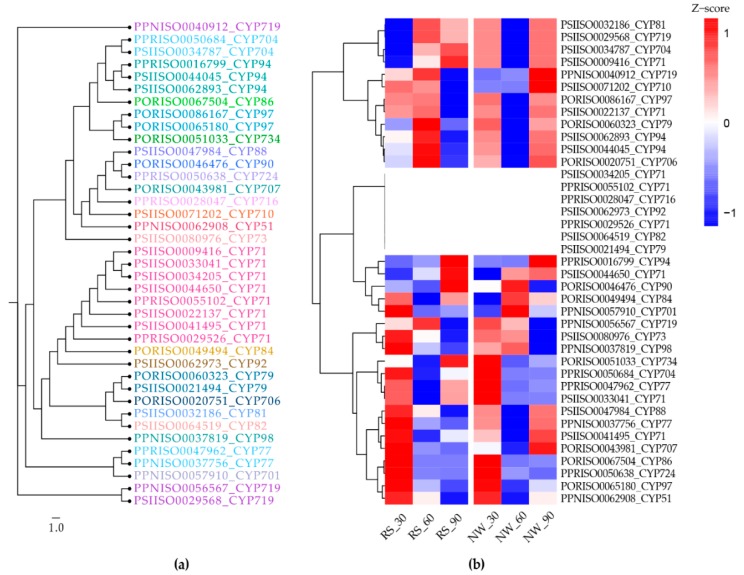
The Papaver spp. (Papaver rhoeas (Corn poppy) and Papaver nudicaule (Iceland poppy)) genera are ornamental and medicinal plants that are used for the isolation of alkaloid drugs. In this study, we generated 700 Mb of transcriptome sequences with the PacBio platform. They were assembled into 120,926 contigs, and 1185 (82.2%) of the benchmarking universal single-copy orthologs (BUSCO) core genes were completely present in our assembled transcriptome. Furthermore, using 128 Gb of Illumina sequences, the transcript expression was assessed at three stages of Papaver plant development (30, 60, and 90 days), from which we identified 137 differentially expressed transcripts. Furthermore, three co-occurrence heat maps are generated from 51 different plant genomes along with the Papaver transcriptome, i.e., secondary metabolite biosynthesis, isoquinoline alkaloid biosynthesis (BIA) pathway, and cytochrome. Sixty-nine transcripts in the BIA pathway along with 22 different alkaloids (quantified with LC-QTOF-MS/MS) were mapped into the BIA KEGG map (map00950). Finally, we identified 39 full-length cytochrome transcripts and compared them with other genomes. Collectively, this transcriptome data, along with the expression and quantitative metabolite profiles, provides an initial recording of secondary metabolites and their expression related to Papaver plant development. Moreover, these profiles could help to further detail the functional characterization of the various secondary metabolite biosynthesis and Papaver plant development associated problems.
Keywords: Papaver nudicaule; Papaver rhoeas; alkaloid biosynthesis; poppy; target metabolome; transcriptome.
Conflict of interest statement
The authors have declared no conflict of interest.
Figures
Similar articles
-
Andrographis paniculata transcriptome provides molecular insights into tissue-specific accumulation of medicinal diterpenes.BMC Genomics. 2015 Sep 2;16(1):659. doi: 10.1186/s12864-015-1864-y. BMC Genomics. 2015. PMID: 26328761 Free PMC article.
-
Integration of deep transcriptome and proteome analyses reveals the components of alkaloid metabolism in opium poppy cell cultures.BMC Plant Biol. 2010 Nov 18;10:252. doi: 10.1186/1471-2229-10-252. BMC Plant Biol. 2010. PMID: 21083930 Free PMC article.
-
Next-generation sequencing (NGS) transcriptomes reveal association of multiple genes and pathways contributing to secondary metabolites accumulation in tuberous roots of Aconitum heterophyllum Wall.Planta. 2015 Jul;242(1):239-58. doi: 10.1007/s00425-015-2304-6. Epub 2015 Apr 24. Planta. 2015. PMID: 25904478
-
Evolution of morphine biosynthesis in opium poppy.Phytochemistry. 2009 Oct-Nov;70(15-16):1696-707. doi: 10.1016/j.phytochem.2009.07.006. Epub 2009 Aug 6. Phytochemistry. 2009. PMID: 19665152 Review.
-
De Novo Deep Transcriptome Analysis of Medicinal Plants for Gene Discovery in Biosynthesis of Plant Natural Products.Methods Enzymol. 2016;576:19-45. doi: 10.1016/bs.mie.2016.03.001. Epub 2016 Apr 4. Methods Enzymol. 2016. PMID: 27480681 Review.
Cited by
-
Papaver Plants: Current Insights on Phytochemical and Nutritional Composition Along with Biotechnological Applications.Oxid Med Cell Longev. 2022 Feb 3;2022:2041769. doi: 10.1155/2022/2041769. eCollection 2022. Oxid Med Cell Longev. 2022. PMID: 36824615 Free PMC article. Review.
-
Systematic review of exosomes derived from various stem cell sources: function and therapeutic potential in disease modulation.Mol Biol Rep. 2025 Aug 23;52(1):842. doi: 10.1007/s11033-025-10943-z. Mol Biol Rep. 2025. PMID: 40848177
-
Applications of some advanced sequencing, analytical, and computational approaches in medicinal plant research: a review.Mol Biol Rep. 2023 Dec 20;51(1):23. doi: 10.1007/s11033-023-09057-1. Mol Biol Rep. 2023. PMID: 38117315 Review.
-
Comparative chloroplast genomics and phylogenetic analysis of Oreomecon nudicaulis (Papaveraceae).BMC Genom Data. 2024 May 30;25(1):49. doi: 10.1186/s12863-024-01236-8. BMC Genom Data. 2024. PMID: 38816818 Free PMC article.
-
Advances in the biosynthesis of naturally occurring benzylisoquinoline alkaloids.Front Plant Sci. 2025 Jan 30;16:1548471. doi: 10.3389/fpls.2025.1548471. eCollection 2025. Front Plant Sci. 2025. PMID: 39949415 Free PMC article. Review.
References
-
- Barceloux D.G. Medical Toxicology of Drug Abuse. John Wiley & Sons, Inc.; Hoboken, NJ, USA: 2012. Heroin and the Opium Poppy Plant (Papaver somniferum L.) pp. 546–578.
-
- Bernath J. Poppy: The Genus Papaver. Volume 3. Harwood Academic Publishers; London, UK: 1999. p. 390.
-
- United Nations Office on Drugs and Crime . World Drug Report 2017. United Nations Publications; New York, NY, USA: 2017.
MeSH terms
Substances
Grants and funding
LinkOut - more resources
Full Text Sources
Miscellaneous
