. 2018 Oct 18;16(1):177.
doi: 10.1186/s12916-018-1171-y.

The hidden burden of measles in Ethiopia: how distance to hospital shapes the disease mortality rate

Affiliations

The hidden burden of measles in Ethiopia: how distance to hospital shapes the disease mortality rate

Piero Poletti et al. BMC Med. .

Abstract

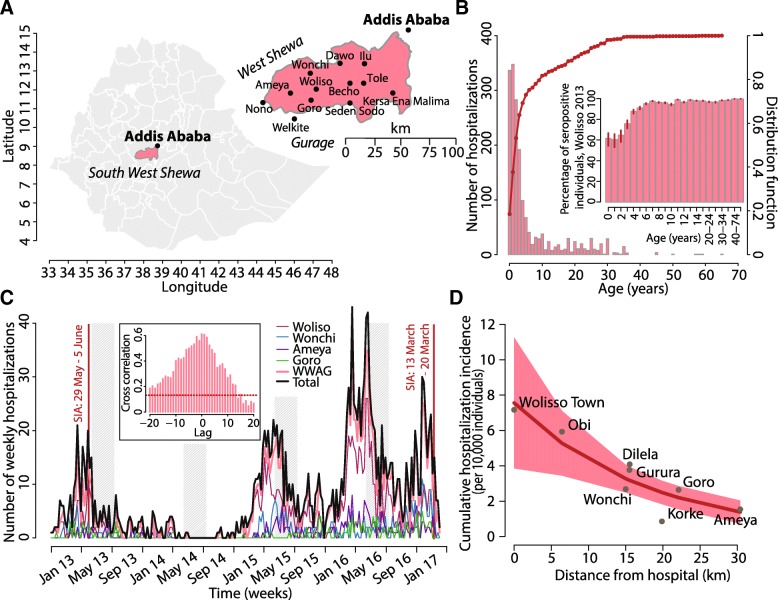
Background: A sequence of annual measles epidemics has been observed from January 2013 to April 2017 in the South West Shoa Zone of the Oromia Region, Ethiopia. We aimed at estimating the burden of disease in the affected area, taking into account inequalities in access to health care due to travel distances from the nearest hospital.

Methods: We developed a dynamic transmission model calibrated on the time series of hospitalized measles cases. The model provided estimates of disease transmissibility and incidence at a population level. Model estimates were combined with a spatial analysis to quantify the hidden burden of disease and to identify spatial heterogeneities characterizing the effectiveness of the public health system in detecting severe measles infections and preventing deaths.

Results: A total of 1819 case patients and 36 deaths were recorded at the hospital. The mean age was 6.0 years (range, 0-65). The estimated reproduction number was 16.5 (95% credible interval (CI) 14.5-18.3) with a cumulative disease incidence of 2.34% (95% CI 2.06-2.66). Three thousand eight hundred twenty-one (95% CI 1969-5671) severe cases, including 2337 (95% CI 716-4009) measles-related deaths, were estimated in the Woliso hospital's catchment area (521,771 inhabitants). The case fatality rate was found to remarkably increase with travel distance from the nearest hospital: ranging from 0.6% to more than 19% at 20 km. Accordingly, hospital treatment prevented 1049 (95% CI 757-1342) deaths in the area.

Conclusions: Spatial heterogeneity in the access to health care can dramatically affect the burden of measles disease in low-income settings. In sub-Saharan Africa, passive surveillance based on hospital admitted cases might miss up to 60% of severe cases and 98% of related deaths.

Keywords: Access to health care; Case fatality rate; Infectious diseases; Mathematical model; Measles epidemic; Sub-Saharan Africa.


Conflict of interest statement

Ethics approval and consent to participate

The study did not require informed consent as collected data consisted of routine health data and medical records were encrypted and anonymous and did not contain any information that might be used to identify individual patients.

Consent for publication

Not applicable

Competing interests

The authors declare that they have no competing interests.

Publisher’s Note

Springer Nature remains neutral with regard to jurisdictional claims in published maps and institutional affiliations.

Figures

Fig. 1
Fig. 1
Epidemiological evidences: a Study area and spatial distribution of woredas. b Age distribution of measles patients hospitalized at the Woliso hospital between January 2013 and April 2017. The inset shows the estimated measles seroprevalence by age, as obtained on the basis of model estimates. c Time series of case patients recorded during the study period, overall, and in most affected woredas. The inset shows the cross correlation in the timing of epidemics in Woliso and most rural areas. d Cumulative incidence of hospitalizations per 10,000 individuals (h) by woreda/kebele and distance from Woliso hospital (d). The solid line represents estimates obtained by the negative binomial regression model; the shaded area represents 95% CI
Fig. 2
Fig. 2
The hidden burden of measles disease. a Point estimates of the hospitalization rate at different distances from the Woliso hospital (in gray) and results from the negative binomial regression (mean in dark red and 95% CI in light red); estimates of the average hospitalization rate in the area as obtained with the transmission model are shown in blue (solid line represents the mean, shaded area represents 95% CI). b average CFR among hospital admitted cases across different sites (red diamonds); vertical bars represent 95% CI as obtained by exact binomial test. c Estimates of the proportion of untreated and missed severe cases over distance (diamonds represent the mean estimates; vertical bars represent 95% CI). d Estimates of the overall measles case fatality rate at different distances from the hospital; CFR is obtained as the fraction of estimated deaths over the estimated number of measles infections across different sites (diamonds represent the mean estimates; vertical bars represent 95% CI). e Estimated percentage of averted deaths due to hospital treatment as obtained by considering all severe cases as counterfactual deaths that would have occurred in the absence of adequate treatment (diamonds represent the mean estimates; vertical bars represent 95% CI). f Cumulative number of cases between 2013 and 2017 stratified in observed hospital admissions, estimated severe cases, missed untreated cases, overall potential deaths computed by assuming that all severe untreated cases died, and averted deaths due to hospital treatment (vertical bars represent 95% CI)
Fig. 3
Fig. 3
Sensitivity analysis. Total number of measles deaths (scaled on the left) and overall measles case fatality rate (scaled on the right) in the main hospital catchment area as estimated for different values of the fatality rate among severe cases that were not hospitalized. Estimates obtained with the baseline assumption are shown in orange. Vertical bars represent 95% of credible intervals. Percentages shown on top of the figure represent the estimated average proportions of deaths that were not reported at the hospital obtained with different values of the fatality rate among missed/untreated severe cases

Similar articles

Cited by

References

    1. Goodson JL, Masresha BG, Wannemuehler K, Uzicanin A, Cochi S. Changing epidemiology of measles in Africa. J Infect Dis. 2011;204(suppl 1):S205–S214. doi: 10.1093/infdis/jir129. - DOI - PubMed
    1. Otten M, Kezaala R, Fall A, Masresha B, Martin R, Cairns L, et al. Public-health impact of accelerated measles control in the WHO African Region 2000–03. Lancet. 2005;366:9488. doi: 10.1016/S0140-6736(05)67216-9. - DOI - PubMed
    1. Mitiku K, Bedada T, Masresha BG, Kegne W, Nafo-Traoré F, Tesfaye N, Yigzaw A. Progress in measles mortality reduction in Ethiopia, 2002–2009. J Infect Dis. 2011;204(suppl 1):S232–S238. doi: 10.1093/infdis/jir109. - DOI - PubMed
    1. Beyene BB, Tegegne AA, Wayessa DJ, Enqueselassie F. National measles surveillance data analysis, 2005 to 2009, Ethiopia. J Public Health Epidemiol. 2016;8:3.
    1. Lessler J, Moss WJ, Lowther SA, Cummings DAT. Maintaining high rates of measles immunization in Africa. Epidemiol Infect. 2011;139(07):1039–1049. doi: 10.1017/S0950268810002232. - DOI - PubMed

Publication types

MeSH terms