. 2018 Oct 17;19(1):166.
doi: 10.1186/s13059-018-1559-1.

Chromosome evolution at the origin of the ancestral vertebrate genome

Affiliations

Chromosome evolution at the origin of the ancestral vertebrate genome

Christine Sacerdot et al. Genome Biol. .

Abstract

Background: It has been proposed that more than 450 million years ago, two successive whole genome duplications took place in a marine chordate lineage before leading to the common ancestor of vertebrates. A precise reconstruction of these founding events would provide a framework to better understand the impact of these early whole genome duplications on extant vertebrates.

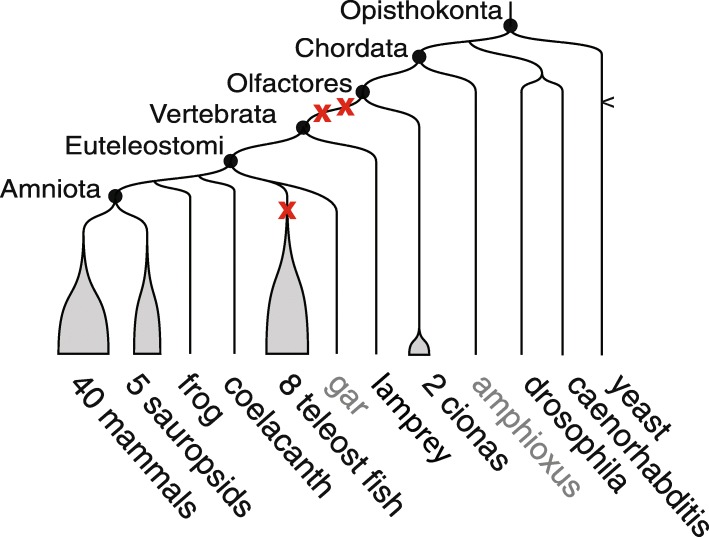
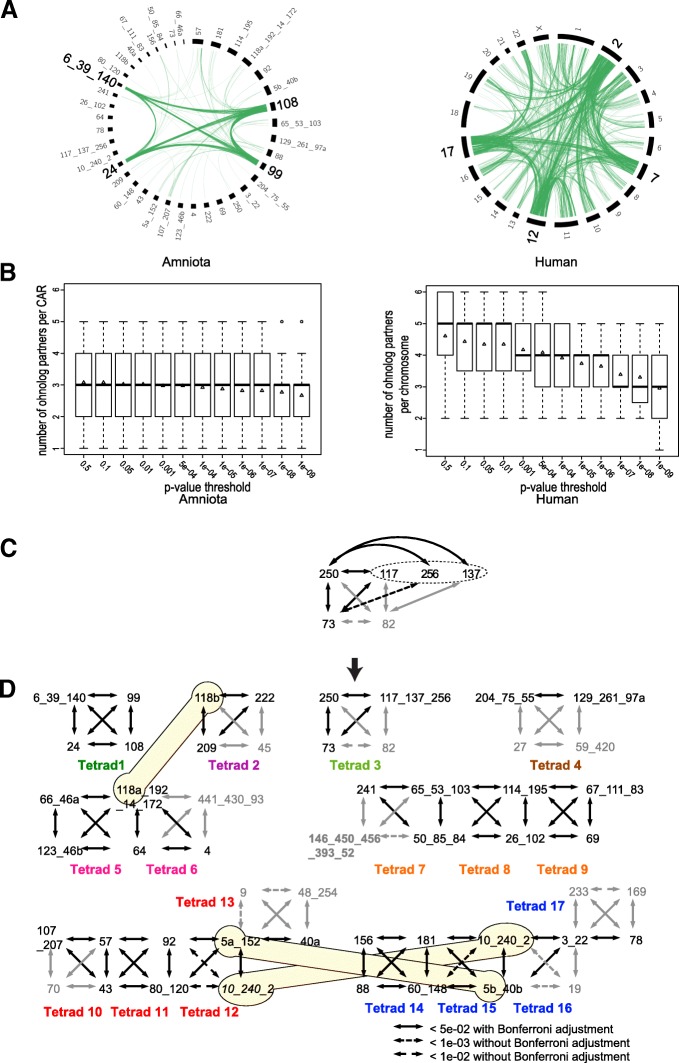
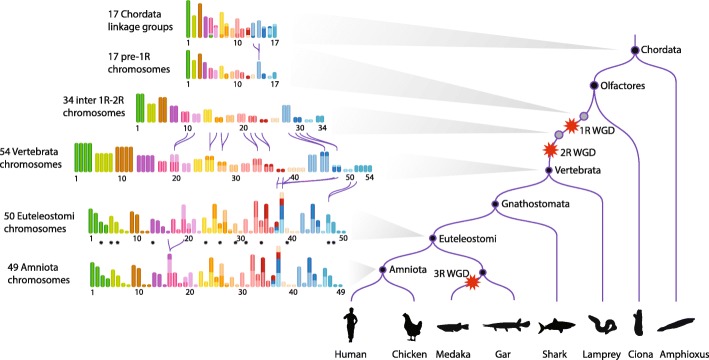
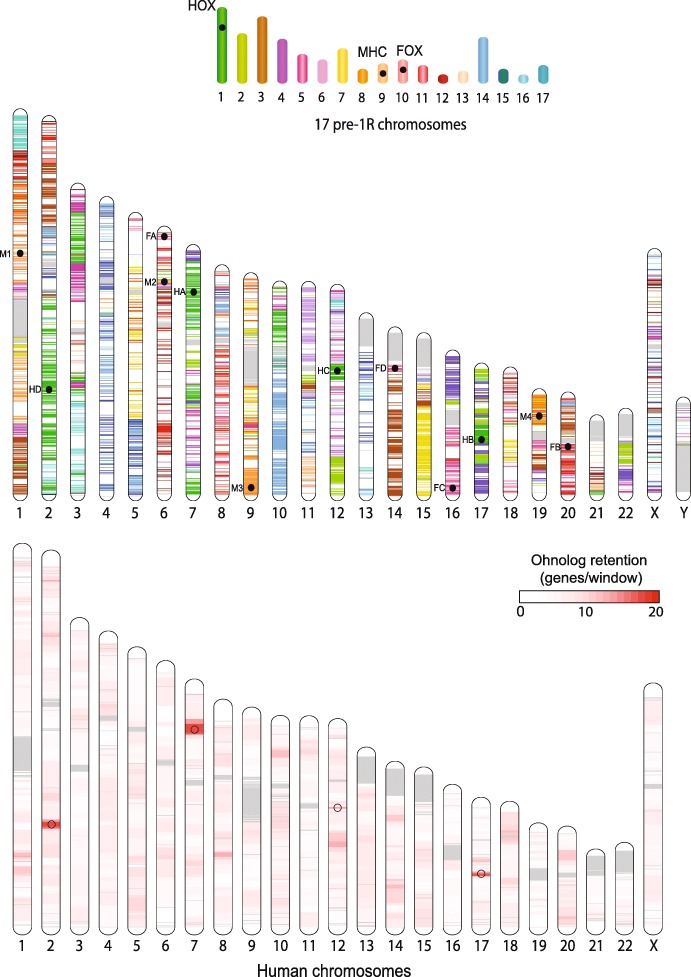
Results: We reconstruct the evolution of chromosomes at the beginning of vertebrate evolution. We first compare 61 extant animal genomes to reconstruct the highly contiguous order of genes in a 326-million-year-old ancestral Amniota genome. In this genome, we establish a well-supported list of duplicated genes originating from the two whole genome duplications to identify tetrads of duplicated chromosomes. From this, we reconstruct a chronology in which a pre-vertebrate genome composed of 17 chromosomes duplicated to 34 chromosomes and was subject to seven chromosome fusions before duplicating again into 54 chromosomes. After the separation of the lineage of Gnathostomata (jawed vertebrates) from Cyclostomata (extant jawless fish), four more fusions took place to form the ancestral Euteleostomi (bony vertebrates) genome of 50 chromosomes.

Conclusions: These results firmly establish the occurrence of two whole genome duplications in the lineage that precedes the ancestor of vertebrates, resolving in particular the ambiguity raised by the analysis of the lamprey genome. This work provides a foundation for studying the evolution of vertebrate chromosomes from the standpoint of a common ancestor and particularly the pattern of duplicate gene retention and loss that resulted in the gene composition of extant vertebrate genomes.


Conflict of interest statement

Ethics approval and consent to participate

Not applicable

Consent for publication

Not applicable

Competing interests

The authors declare that they have no competing interests.

Publisher’s Note

Springer Nature remains neutral with regard to jurisdictional claims in published maps and institutional affiliations.

Figures

Fig. 1
Fig. 1
Schematic phylogenetic relationships between species used in this study. Species or groups of species shown in black at the end of branches are the 61 species included in Ensembl release 69, and were used to reconstruct the ancestral Amniota genome. Sauropsids include birds and reptiles. Species shown in grey were used at other stages in the analysis. Black circles materialize ancestral genomes relevant to this study. Red crosses indicate the relative positions of WGDs: two before the vertebrate radiation and one before the teleost fish radiation. Branches are not to scale
Fig. 2
Fig. 2
Identification of ohnolog pairs in the ancestral Amniota genome. (a) Comparison between five lists of ohnolog pairs in Amniota. Left: a Venn diagram of the sets of ohnolog pairs from five lists: list A (this study), list B [8] and the three lists C [9]. The numbers of pairs at the intersections of the lists are indicated. Right: a Venn diagram of the sets of ohnolog genes from the same lists as above. The overlap between the lists of ohnolog genes is higher than between the lists of pairs because the latter contain different pairs between the same genes. For example, two pairs G1-G2 and G1-G4 are in different lists (no overlap between lists) but gene G1 is common to both lists (1 gene overlap; see (b) for a graphical illustration). The surface of the circles and their intersection are roughly proportional to the number of genes pairs or genes of each list. (b) Schematic example of ohnolog pair selection. Step 1: from the initial list of 1273 gene pairs (black area in Venn diagram), 2 pairs involve 3 genes G1, G2, and G3, each on a different CAR. Step 2: pairs from a new sub-list are considered, a new gene pair G1-G4 is added to the network. Gene G4 is on a fourth CAR. Step 3: A new list is considered, a new pair is identified (G4-G5) but G5 is on a fifth CAR so pair G4-G5 is discarded. Step 4: a new list is considered, a pair G4-G3 supporting the network is identified
Fig. 3
Fig. 3
Organization of ancestral Amniota CARs in tetrads (a) Circos plot [45] showing the pairs of ohnologs involving each of the four chromosomes (Homo sapiens) or CARs (Amniota) of the tetrad carrying the Hox genes (Tetrad 1 in D). The pairs of ohnologs in the human genome were the descendants of those of Amniota (6121 pairs of human ohnologs vs. 7441 pairs of amniote ohnologs). The human Hox cluster tetrad is mainly composed of human chromosomes 2, 7, 12, and 17. The Amniota Hox cluster tetrad is composed of CARs 108, 24, 99, and 6_39_140. An ohnolog pair is represented (green lines) between two Amniota CARs or two human chromosomes if at least one of the two genes of the pair falls on a chromosome/CAR of the tetrad. The Amniota Hox CARs are involved in 634 pairs, while the human Hox chromosomes are involved in 2171 pairs of ohnologs. This figure shows that the reconstruction of Amniota ancestor displays a clearer picture of the 1R-2R than the human genome. (b) Ohnolog partners per CAR/chromosome in the Amniota (left) and human (right) genomes. Each boxplot shows the distribution of the number of CARs (Amniota) or chromosomes (Human) found to be ohnologous to a given CAR/chromosome by the proportionality test. The x-axis shows the Bonferroni adjusted p value thresholds used to select ohnologous chromosome/CARs. Triangles indicate the average number of partners. The Amniota genome shows a clear and stable distribution of three partners per CAR across a wide range of p values, as expected after two WGDs where chromosomes are grouped in tetrads. In contrast, the distribution in Homo sapiens shows that extremely low p value thresholds must be used to reach the expected average of three partners, justifying the fragmentation of the human genome as described in [6]. (c) Example of how a group of significantly ohnologous CARs was analyzed to form tetrad 3. Black double-headed arrows (p value < 5.10−2 after Bonferroni adjustment) represent the raw output of the proportion test, showing CARs with significant ohnology relationships. CARs 73, 117, and 250 form a triad of mutually ohnologous CARs. Dotted lines are additional ohnologous relationships that are supported without the Bonferroni adjustment. Numbers in black indicate CARs of at least 50 genes, while smaller CARs (< 50 genes) are in grey. Additional evidence (see text) was used to complete the tetrad. (d) Seventeen tetrads composed of 51 CARs. CARs are numbered arbitrarily and are joined by underscores in an arbitrary order when assembled. The letters “a” or “b” indicate that the CAR has been split in two segments (CARs 5 and 118) as part of the conversion to a post-2R karyotype (see text) and one CAR is present twice in two different tetrads (CAR 10_240_2) to facilitate the representation (pale yellow shapes)
Fig. 4
Fig. 4
Evolutionary scenario models. (a) A single evolutionary scenario explains the formation of a single disjoint tetrad of ohnologous CARs. (b) Two equally possible evolutionary scenarios can explain how ohnologous CARs can form two adjacent tetrads: a fission or a fusion of chromosomes could have occurred between the 2 WGDs. In each case, the B and D chromosomes each possess two distinct parts (dark and light grey) homologous to distinct chromosome sets. B and D are therefore common to two tetrads. (c) A chromosome fusion after the two WGDs explains how two tetrads can be joined via a single CAR
Fig. 5
Fig. 5
Reconstructed evolutionary history of karyotypes from Chordata to Amniota. On the right, a simplified species tree of the Chordata is shown, with WGD events depicted by red stars. The eight lineages represented from left to right are mammals, birds, teleost fish, holostocean fish (gar), cartilaginous fish, cyclostomes (lamprey, hagfish), tunicates (ciona), and cephalochordates (amphioxus). On the left, successive reconstructed karyotypes are shown, with one color for each of the 17 pre-1R chromosomes. The length of each pre-1R chromosome is proportional to its number of genes. For the 17 Chordate Linkage Groups (CLGs) of [7], the size of the colored segment is proportional to the number of genes that are found in the intersection of the CLG with a pre-1R chromosome, although segments corresponding to < 10% of the number of genes of the CLG were omitted for clarity (Additional file 1: Table S7). The karyotype between 1R and 2R was deduced from the pre-1R karyotype and the seven chromosome fusions are shown with purple curvy lines joining the fused chromosomes. The Euteleostomi karyotype was deduced from the Vertebrata karyotype after four chromosome fusions (Additional file 1). The lengths of the Euteleostomi chromosomes are proportional to the number of genes in the homologous Amniota CARs. Finally, the Amniota karyotype differs from that of Euteleostomi by only one chromosome fusion. The Amniota chromosomes were numbered from 1 to 49 (Additional file 1: Table S11 for correspondence with the CARs and number of genes). Black stars under 12 Euteleostomi chromosomes denote predicted ancestral micro-chromosomes
Fig. 6
Fig. 6
Comparison between the pre-1R karyotype (top) composed of 17 chromosomes and the human karyotype (middle). The 8282 known human descendent genes of pre-1R genes are drawn at their position in the human genome with the color of their pre-1R ancestral chromosome. The position of 12 extant clusters (4 HOX, 4 FOX and 4 MHC) descending from a single clusters in pre-1R chromosomes are indicated by a black circle and a 2-character identifier (M1, M2, M3, M4 for MHC clusters, F1, F2, F3, F4 for FOX clusters, HA, HB, HC, HD for HOX clusters). A second human karyotype (bottom) shows, in a white-to-red scale, the number of ohnologs in windows of 50 genes positioned every 10 genes. Open circles denote the position of HOX clusters. Human chromosomes are drawn to scale, in Mb. Pre-1R chromosomes are drawn as in Fig. 5, in proportion to the number of genes assigned to each. The order of genes in pre-1R chromosomes being unknown, the positions of the 3 pre-1R gene clusters within their chromosome are arbitrary
Fig. 7
Fig. 7
Comparison of ancestral Amniota CARs with super-scaffolds of the lamprey (Petromyzon marinus) germline genome assembly [17]. Along the X-axis, Amniota CARs are grouped in the 17 tetrads (colored boxes) as shown in Fig. 3d. The order of the lamprey scaffolds on the Y-axis was designed as to cluster them according to orthology pattern against Amniota CARs. The size of each black circle is proportional to the number of orthologs between a given Amniota CAR (X-axis) and the corresponding lamprey scaffold (Y-axis)

Comment in

References

    1. Innan H, Kondrashov F. The evolution of gene duplications: classifying and distinguishing between models. Nat Rev Genet. 2010;11:97–108. doi: 10.1038/nrg2689. - DOI - PubMed
    1. Conrad B, Antonorakis SE. Gene duplication: a drive for phenotypic diversity and cause of human disease. Annu Rev Genomics Hum Genet. 2007;8:17–35. doi: 10.1146/annurev.genom.8.021307.110233. - DOI - PubMed
    1. Van de Peer Y, Maere S, Meyer A. The evolutionary significance of ancient genome duplications. Nat Rev Genet. 2009;10:725–732. doi: 10.1038/nrg2600. - DOI - PubMed
    1. Ohno S. Evolution by gene duplication. London: Allen and Unwin; 1970.
    1. Dehal P, Boore JL. Two rounds of whole genome duplication in the ancestral vertebrate. PLoS Biol. 2005;3:e314. doi: 10.1371/journal.pbio.0030314. - DOI - PMC - PubMed

Publication types

LinkOut - more resources