

Impact of Engineered Expression of Mitochondrial Association Factor 1b on Toxoplasma gondii Infection and the Host Response in a Mouse Model
- PMID: 30333181
- PMCID: PMC6193605
- DOI: 10.1128/mSphere.00471-18
Impact of Engineered Expression of Mitochondrial Association Factor 1b on Toxoplasma gondii Infection and the Host Response in a Mouse Model
Abstract
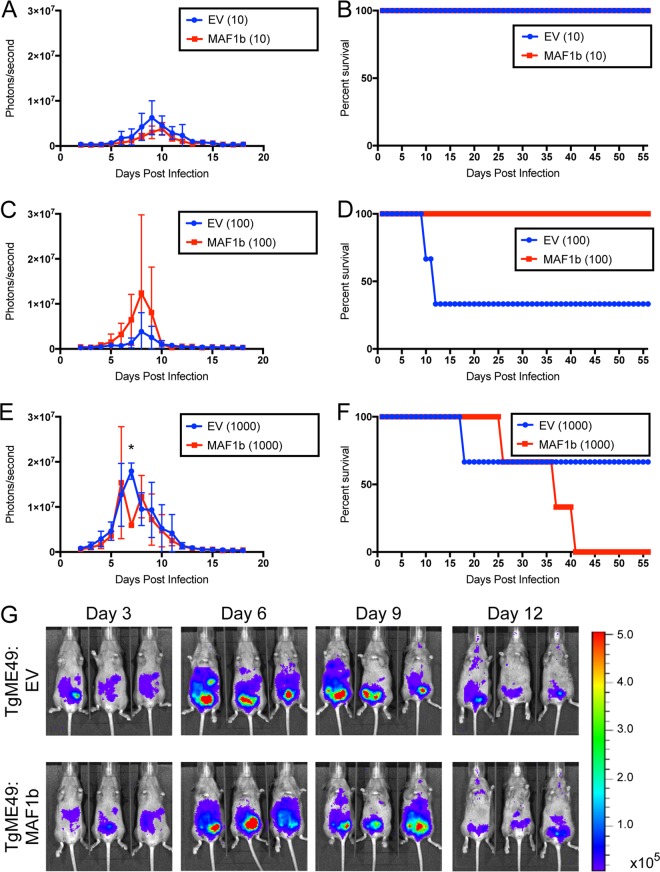
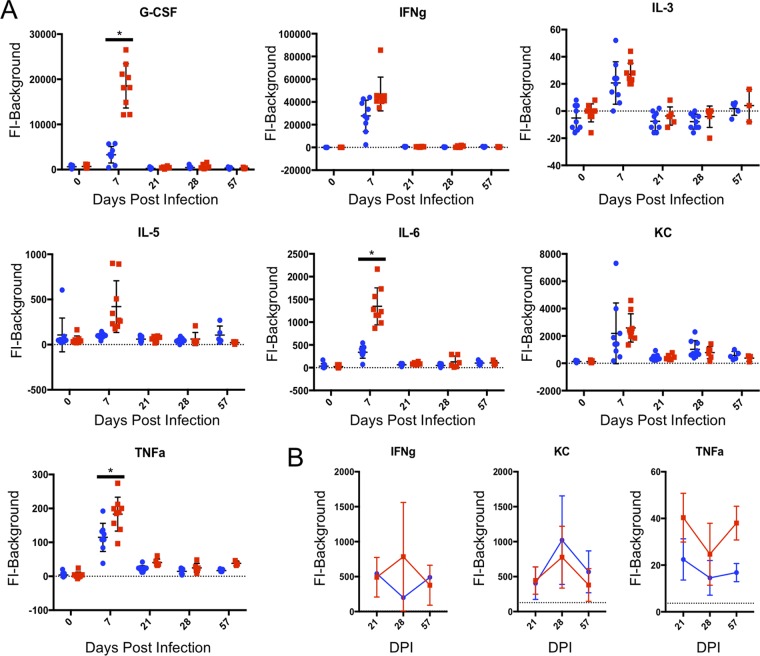
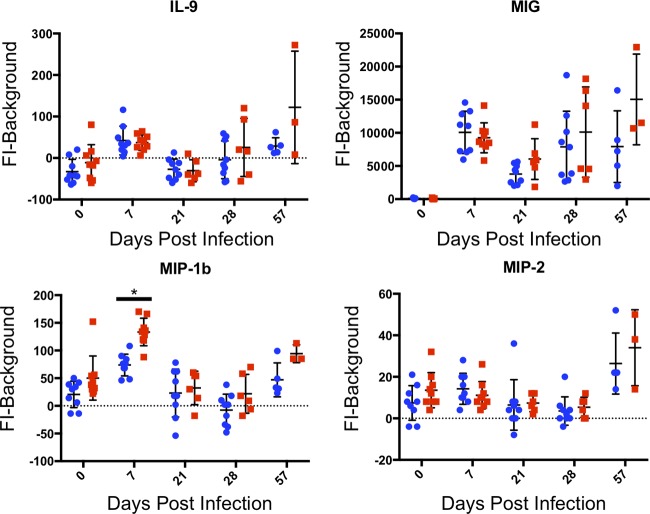
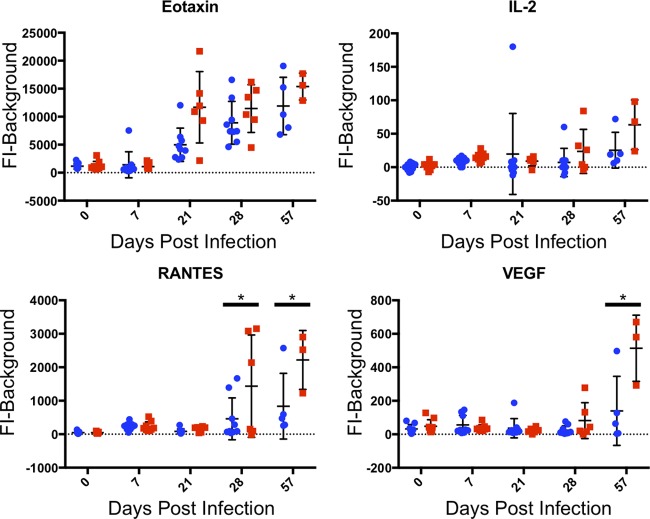
The opportunistic intracellular parasite Toxoplasma gondii causes a lifelong chronic infection capable of reactivating in immunocompromised individuals, which can lead to life-threatening complications. Following invasion of the host cell, host mitochondria associate with the parasitophorous vacuole membrane. This phenotype is T. gondii strain specific and is mediated by expression of a host mitochondrial association-competent (HMA+) paralog of the parasite protein mitochondrial association factor 1 (MAF1b). Previous work demonstrated that expression of MAF1b in strains that do not normally associate with host mitochondria increases their fitness during acute infection in vivo However, the impact of MAF1b expression during chronic T. gondii infection is unclear. In this study, we assess the impact of MAF1b expression on cyst formation and cytokine production in mice. Despite generally low numbers of cysts generated by the in vitro culture-adapted strains used in this study, we find that parasites expressing MAF1b have higher numbers of cysts in the brains of chronically infected mice and that MAF1b+ cyst burden significantly increases during the course of chronic infection. Consistent with this, mice infected with MAF1b+ parasites have higher levels of the serum cytokines RANTES and VEGF (vascular endothelial growth factor) at day 57 postinfection, although this could be due to higher parasite burden at this time point rather than direct manipulation of these cytokines by MAF1b. Overall these data indicate that MAF1b expression may also be important in determining infection outcome during the chronic phase, either by directly altering the cytokine/signaling environment or by increasing proliferation during the acute and/or chronic phase.IMPORTANCE The parasite Toxoplasma gondii currently infects approximately one-third of the world's population and causes life-threatening toxoplasmosis in individuals with undeveloped or weakened immune systems. Current treatments are unable to cure T. gondii infection, leaving infected individuals with slow-growing tissue cysts for the remainder of their lives. Previous work has shown that expression of the parasite protein mitochondrial association factor 1 (MAF1b) is responsible for the association of T. gondii parasites with host mitochondria and provides a selective advantage during acute infection. Here we examine the impact of MAF1b expression during chronic T. gondii infection. We find that mice infected with MAF1b-expressing parasites have higher cyst burden and cytokine levels than their wild-type counterparts. A better understanding of the genes involved in establishing and maintaining chronic infection will aid in discovering effective therapeutics for chronically infected individuals.
Keywords: Toxoplasma gondii; chronic infection; cytokines; host-pathogen interactions; mitochondrial association.
Copyright © 2018 English and Boyle.
Figures

Similar articles
-
Toxoplasma gondii association with host mitochondria requires key mitochondrial protein import machinery.Proc Natl Acad Sci U S A. 2021 Mar 23;118(12):e2013336118. doi: 10.1073/pnas.2013336118. Proc Natl Acad Sci U S A. 2021. PMID: 33723040 Free PMC article.
-
Toxoplasma gondii MAF1b Binds the Host Cell MIB Complex To Mediate Mitochondrial Association.mSphere. 2017 May 24;2(3):e00183-17. doi: 10.1128/mSphere.00183-17. eCollection 2017 May-Jun. mSphere. 2017. PMID: 28567444 Free PMC article.
-
The Toxoplasma gondii Rhoptry Kinome Is Essential for Chronic Infection.mBio. 2016 May 10;7(3):e00193-16. doi: 10.1128/mBio.00193-16. mBio. 2016. PMID: 27165797 Free PMC article.
-
Long-Term Relationships: the Complicated Interplay between the Host and the Developmental Stages of Toxoplasma gondii during Acute and Chronic Infections.Microbiol Mol Biol Rev. 2015 Dec;79(4):387-401. doi: 10.1128/MMBR.00027-15. Microbiol Mol Biol Rev. 2015. PMID: 26335719 Free PMC article. Review.
-
Toxoplasmosis and Neuropsychological Effects.Turkiye Parazitol Derg. 2021 Mar 2;45(1):49-55. doi: 10.4274/tpd.galenos.2020.6973. Turkiye Parazitol Derg. 2021. PMID: 33685069 Review. English.
Cited by
-
Seizing control: How dense granule effector proteins enable Toxoplasma to take charge.Mol Microbiol. 2021 Mar;115(3):466-477. doi: 10.1111/mmi.14679. Epub 2021 Feb 6. Mol Microbiol. 2021. PMID: 33400323 Free PMC article. Review.
-
The GRA17 Parasitophorous Vacuole Membrane Permeability Pore Contributes to Bradyzoite Viability.Front Cell Infect Microbiol. 2019 Sep 12;9:321. doi: 10.3389/fcimb.2019.00321. eCollection 2019. Front Cell Infect Microbiol. 2019. PMID: 31572690 Free PMC article.
-
ROP16-Mediated Activation of STAT6 Suppresses Host Cell Reactive Oxygen Species Production, Facilitating Type III Toxoplasma gondii Growth and Survival.mBio. 2021 Mar 2;12(2):e03305-20. doi: 10.1128/mBio.03305-20. mBio. 2021. PMID: 33653884 Free PMC article.
-
A transcriptional network required for bradyzoite development in Toxoplasma gondii is dispensable for recrudescent disease.Nat Commun. 2023 Sep 28;14(1):6078. doi: 10.1038/s41467-023-40948-w. Nat Commun. 2023. PMID: 37770433 Free PMC article.
-
Contact sites between host organelles and pathogens: boon or bane?mSphere. 2023 Dec 20;8(6):e0044823. doi: 10.1128/msphere.00448-23. Epub 2023 Oct 18. mSphere. 2023. PMID: 37850752 Free PMC article. Review.
References
-
- Garin JP, Eyles DE. 1958. Spiramycin therapy of experimental toxoplasmosis in mice. Presse Med 66:957–958. (In French.) - PubMed
Publication types
MeSH terms
Substances
Grants and funding
LinkOut - more resources
Full Text Sources
