. 2018 Nov;28(11):1621-1635.
doi: 10.1101/gr.233304.117. Epub 2018 Oct 17.

Cell-type-specific eQTL of primary melanocytes facilitates identification of melanoma susceptibility genes

Collaborators, Affiliations

Cell-type-specific eQTL of primary melanocytes facilitates identification of melanoma susceptibility genes

Tongwu Zhang et al. Genome Res. 2018 Nov.

Abstract

Most expression quantitative trait locus (eQTL) studies to date have been performed in heterogeneous tissues as opposed to specific cell types. To better understand the cell-type-specific regulatory landscape of human melanocytes, which give rise to melanoma but account for <5% of typical human skin biopsies, we performed an eQTL analysis in primary melanocyte cultures from 106 newborn males. We identified 597,335 cis-eQTL SNPs prior to linkage disequilibrium (LD) pruning and 4997 eGenes (FDR < 0.05). Melanocyte eQTLs differed considerably from those identified in the 44 GTEx tissue types, including skin. Over a third of melanocyte eGenes, including key genes in melanin synthesis pathways, were unique to melanocytes compared to those of GTEx skin tissues or TCGA melanomas. The melanocyte data set also identified trans-eQTLs, including those connecting a pigmentation-associated functional SNP with four genes, likely through cis-regulation of IRF4 Melanocyte eQTLs are enriched in cis-regulatory signatures found in melanocytes as well as in melanoma-associated variants identified through genome-wide association studies. Melanocyte eQTLs also colocalized with melanoma GWAS variants in five known loci. Finally, a transcriptome-wide association study using melanocyte eQTLs uncovered four novel susceptibility loci, where imputed expression levels of five genes (ZFP90, HEBP1, MSC, CBWD1, and RP11-383H13.1) were associated with melanoma at genome-wide significant P-values. Our data highlight the utility of lineage-specific eQTL resources for annotating GWAS findings, and present a robust database for genomic research of melanoma risk and melanocyte biology.


Figures

Figure 1.
Figure 1.
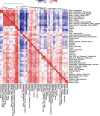
Melanocyte eQTLs display a distinct pattern from those of 44 GTEx tissue types. Dendrogram and heat map presenting the sharing of eQTLs between human primary melanocytes and 44 other GTEx tissue types. Pairwise π1 statistics were calculated from single-tissue eQTL discoveries in each tissue using all the genome-wide significant eQTL SNP-gene pairs. π1 is only calculated when the gene is expressed and testable both in discovery (columns) and replication (rows) tissues. Higher π1 values indicate an increased replication of eQTLs between two tissue types. π1 values range between ∼0.41 and 1 and are color-coded from blue (low sharing) to red (high sharing). Tissues are clustered using the Spearman's correlation of π1 values. Note that π1 values are not symmetrical, since each entry in row i (replication tissue) and column j (discovery tissue) is an estimate of π1 = Pr (eQTL in tissue i given an eQTL in tissue j). Discovery tissue names are shown in parentheses on the bottom. The position of the skin melanocyte eQTL data set from the discovery tissues is shown in pink.
Figure 2.
Figure 2.
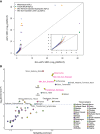
Melanoma GWAS signal is enriched in melanocyte-specific genes and eQTLs. (A) QQ plot presents melanoma GWAS LD-pruned P-values of significant eQTL SNPs versus non-eQTL SNPs for the melanocyte data set compared to those for sun-exposed skin, non-sun-exposed skin, and melanoma tumors. SNPs were classified as eQTL SNPs if they were significant eQTLs or in strong LD (r2 > 0.8) with an eQTL SNP (eQTL SNPs threshold: FDR < 0.05) in each data set. The inset displays a zoomed-in view of a lower −log10 GWAS P-value range (0–5 range for x- and y-axes). (B) Melanoma heritability enrichment levels and P-values in top 4000 tissue-specific genes from LD score regression analysis are displayed. The dashed horizontal line marks FDR = 0.05 on the y-axis. Names of significantly enriched individual tissue types are shown next to the data points, and the others are color-coded based on GTEx tissue category. Tissue types from the “Skin” category including melanocytes are highlighted in pink.
Figure 3.
Figure 3.
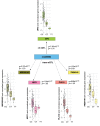
The pigmentation trait-associated variant, rs12203592, in IRF4 is a trans-eQTL for four genes in melanocytes. Cis- or trans-eQTL P-values and effect sizes (β) are shown between rs12203592 and IRF4 or rs12203592 and four genome-wide significant trans-eQTL genes (TMEM140, MIR3681HG, PLA1A, and NEO1). β values are shown relative to alternative alleles (T). Boxplots display gene expression levels based on rs12203592 genotypes (CC, CT, and TT).
Figure 4.
Figure 4.
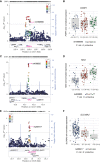
Melanoma GWAS signals colocalizing with melanocyte eQTLs. (A,C,E) LocusZoom plots present the nominal eQTL P-values of all tested local SNPs in 300- to 400-kb windows for three significant eQTL genes from three melanoma GWAS loci: (A) PARP1; (C) MX2; and (E) SLC45A2. The gene being measured is highlighted in pink, the index melanoma risk SNP is labeled and highlighted in purple, and r2 (based on 1000G EUR) of all other SNPs to the index SNP is color-coded. SNPs with missing LD information with the index SNP are shown in gray. Horizontal lines are shown for nominal P-value cutoffs for significant eQTLs. Genomic coordinates are based on hg19. (B,D,F) Boxplots present melanocyte expression differences of each gene in relation to the genotypes of the index SNP. Melanoma risk and protective alleles are shown for each locus.
Figure 5.
Figure 5.
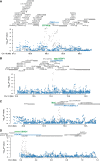
TWAS using melanocyte eQTL data as a reference set identified five new melanoma-associated genes in four new loci. (A) The new melanoma TWAS gene, ZFP90 on Chromosome 16 (TWAS P = 1.95 × 10⁻⁷, TWAS Z = 5.2) is shown in green, along with a second marginally significant gene, CDH1 (P = 5.27 × 10⁻⁴, Z = 3.47) in blue, and other annotated genes at the locus (coordinates are hg19). The Manhattan plot presents the melanoma GWAS P-values before (gray) and after (blue) conditioning on imputed melanocyte-specific gene expression of the gene in green (ZFP90 in this locus). (B) A similar plot for the melanoma TWAS gene HEBP1 (TWAS P = 4.65 × 10⁻⁷, TWAS Z = −5.04) and a second marginally significant gene, GPRC5A (TWAS P = 2.8 × 10⁻⁵, TWAS Z = −4.19) on chromosome band 12p13.1. (C) A similar plot for two new melanoma TWAS genes, MSC (P = 4.27 × 10⁻⁶, Z = 4.6) and RP11-383H13.1 (P = 6.68 × 10⁻⁶, Z = 4.5) on chromosome band 8q13.3. The Manhattan plot shows the melanoma GWAS P-values before (gray) and after (blue) conditioning on imputed melanocyte-specific gene expression of MSC. (D) A similar plot of new melanoma TWAS gene, CBWD1 (P = 5.52 × 10⁻⁶, Z = −4.54) and a marginally significant gene, DOCK8 (P = 2.7 × 10⁻³, Z = 2.99) on chromosome band 9p24.3.

References

    1. The 1000 Genomes Project Consortium. 2015. A global reference for human genetic variation. Nature 526: 68–74. - PMC - PubMed
    1. Alexander DH, Novembre J, Lange K. 2009. Fast model-based estimation of ancestry in unrelated individuals. Genome Res 19: 1655–1664. - PMC - PubMed
    1. Amos CI, Wang LE, Lee JE, Gershenwald JE, Chen WV, Fang S, Kosoy R, Zhang M, Qureshi AA, Vattathil S, et al. 2011. Genome-wide association study identifies novel loci predisposing to cutaneous melanoma. Hum Mol Genet 20: 5012–5023. - PMC - PubMed
    1. Bailey TL, Boden M, Buske FA, Frith M, Grant CE, Clementi L, Ren J, Li WW, Noble WS. 2009. MEME SUITE: tools for motif discovery and searching. Nucleic Acids Res 37: W202–W208. - PMC - PubMed
    1. Barrett JH, Iles MM, Harland M, Taylor JC, Aitken JF, Andresen PA, Akslen LA, Armstrong BK, Avril MF, Azizi E, et al. 2011. Genome-wide association study identifies three new melanoma susceptibility loci. Nat Genet 43: 1108–1113. - PMC - PubMed

Publication types