. 2018 Nov 9;145(21):dev166728.
doi: 10.1242/dev.166728.

Neuromesodermal progenitors are a conserved source of spinal cord with divergent growth dynamics

Affiliations

Neuromesodermal progenitors are a conserved source of spinal cord with divergent growth dynamics

Andrea Attardi et al. Development. .

Erratum in

Abstract

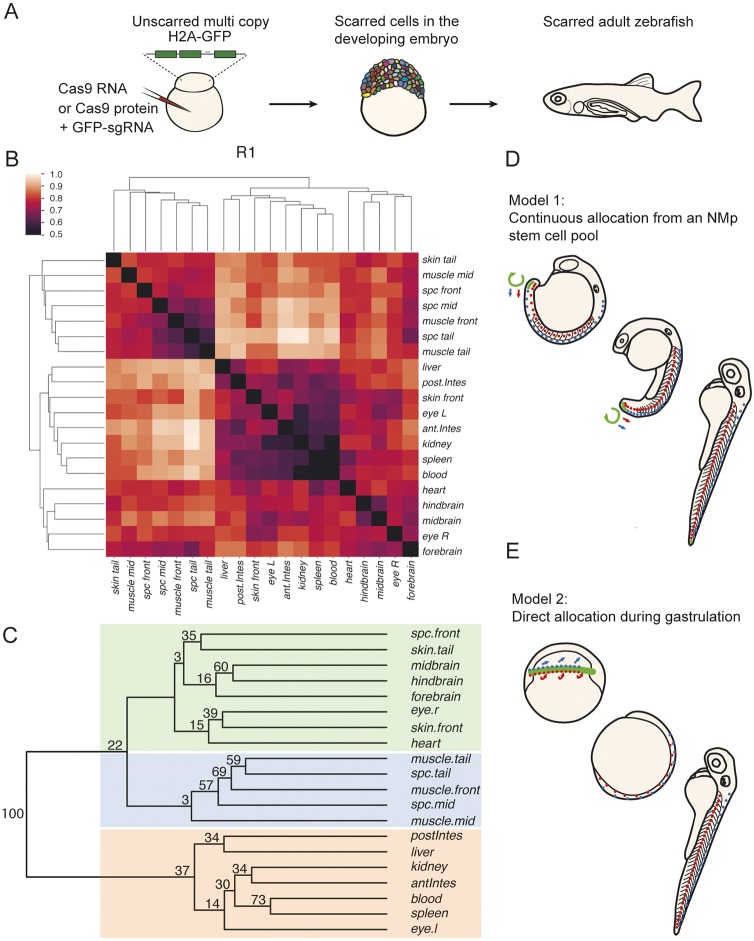
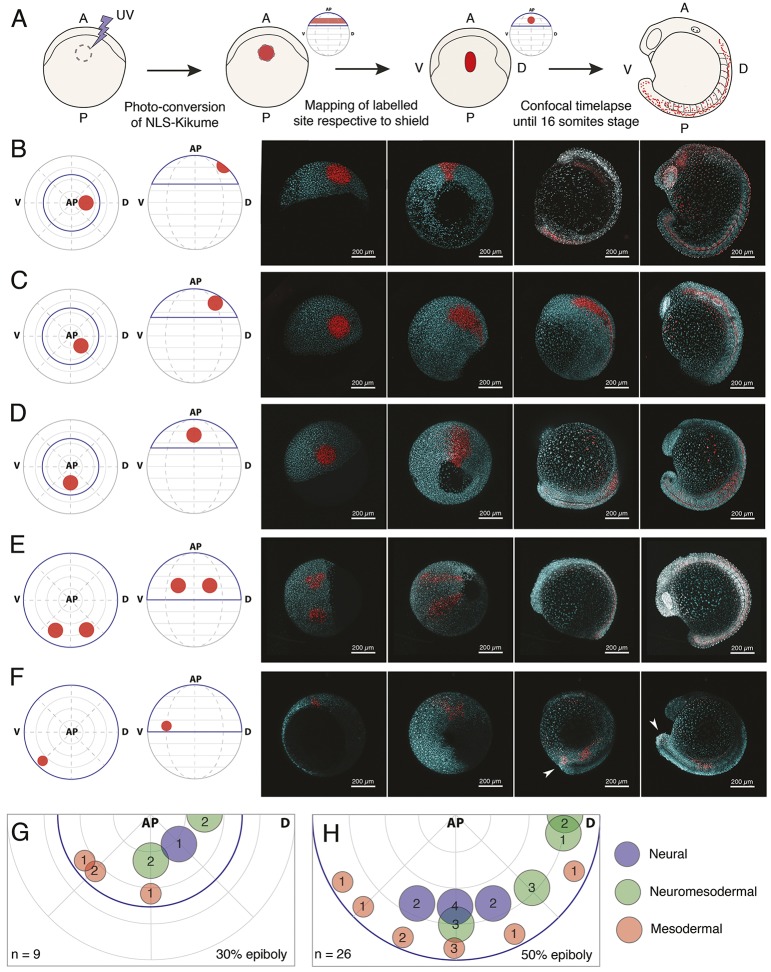
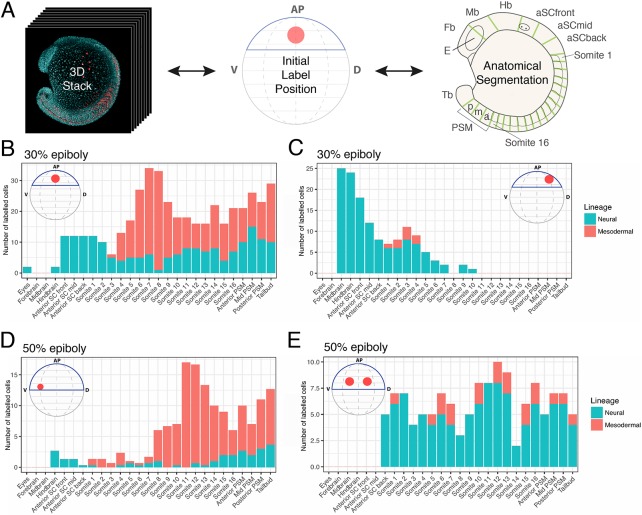
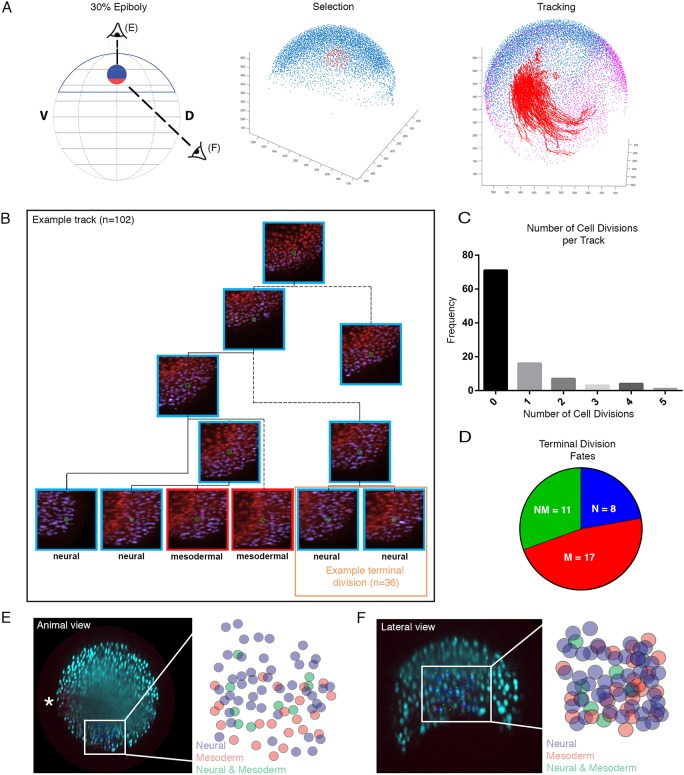
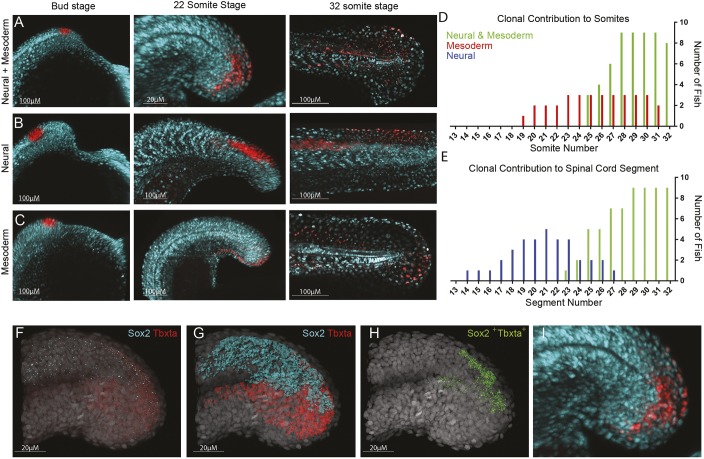
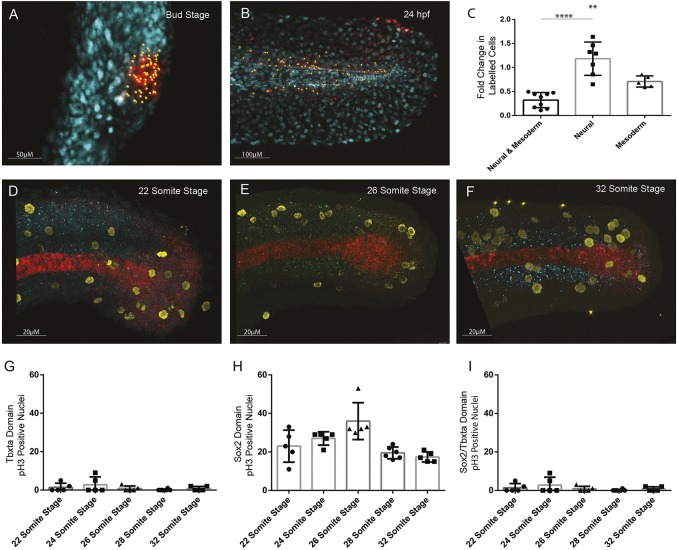
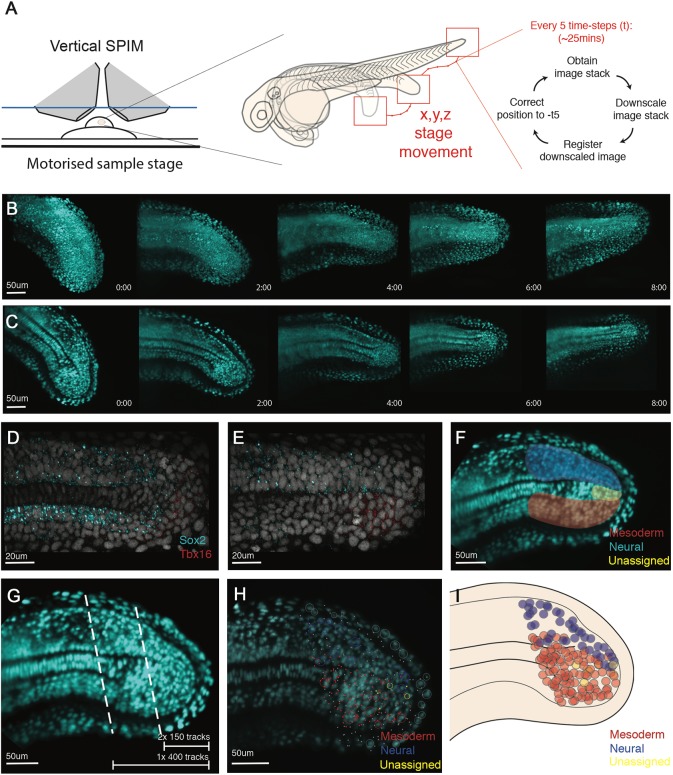
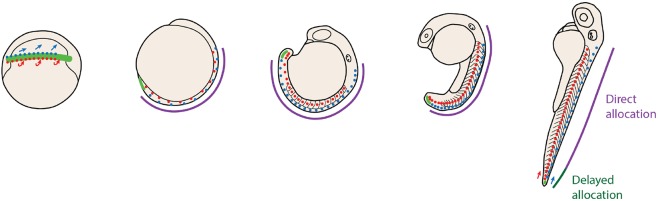
During gastrulation, embryonic cells become specified into distinct germ layers. In mouse, this continues throughout somitogenesis from a population of bipotent stem cells called neuromesodermal progenitors (NMps). However, the degree of self-renewal associated with NMps in the fast-developing zebrafish embryo is unclear. Using a genetic clone-tracing method, we labelled early embryonic progenitors and found a strong clonal similarity between spinal cord and mesoderm tissues. We followed individual cell lineages using light-sheet imaging, revealing a common neuromesodermal lineage contribution to a subset of spinal cord tissue across the anterior-posterior body axis. An initial population subdivides at mid-gastrula stages and is directly allocated to neural and mesodermal compartments during gastrulation. A second population in the tailbud undergoes delayed allocation to contribute to the neural and mesodermal compartment only at late somitogenesis. Cell tracking and retrospective cell fate assignment at late somitogenesis stages reveal these cells to be a collection of mono-fated progenitors. Our results suggest that NMps are a conserved population of bipotential progenitors, the lineage of which varies in a species-specific manner due to vastly different rates of differentiation and growth.

Keywords: Axial elongation; Gastrulation; Tailbud; Zebrafish.


Conflict of interest statement

Competing interestsThe authors declare no competing or financial interests.

Figures

Fig. 1.
Fig. 1.
Spinal cord clones are closely associated to mesodermal, but not anterior, neural derivatives. (A) Experimental workflow for Scartrace lineage tracing of the zebrafish larvae. (B) Clustering of weighted distances (see Materials and Methods) of scars in dissected body structures of fish R1. The smaller the distance the closer the association between body structures. (C) Bootstrapped tree of weighted distances of scars in dissected body structures of fish R1. The tree was bootstrapped 100 times and the final proportion of clades (clade support values) are shown at each node of a clade. Coloured boxes highlight three groups: the ectodermal group (green), the mesodermal/endodermal group (orange), and the mixed ectodermal and mesodermal group (blue) containing muscle and spinal cord. There is close association of spinal cord and mesodermal cells across the anterior to posterior axis, that is distinct from brain regions. spc, spinal cord; antIntes, anterior intestine; postIntes, posterior intestine; l, left; r, right. (D) Model 1. The continuous allocation model is based on lineage analysis in mouse embryos and proposes that a group of self-renewing neuromesodermal stem cells continually generates spinal cord and paraxial mesoderm throughout axial elongation. (E) Model 2. The direct allocation model proposes that an early segregation of neural and mesodermal lineages occurs during gastrulation, the derivatives of which then expand rapidly by convergence and extension.
Fig. 2.
Fig. 2.
Tissue-level segregation of spinal cord and mesoderm populations occurs by 50% epiboly. (A) Description of large-scale fate-mapping experiments. NLS-Kik-injected embryos are mounted for confocal microscopy at 30 or 50% epiboly, and a circular region of the blastoderm is photoconverted. Time-lapse imaging is carried out until the 16-somite stage. Position of the label is retrospectively assigned based on its location on the anterior-posterior axis (determined at the moment of labelling) and the position of the prospective embryonic shield (appearing right after 50% epiboly), which marks the dorsal side of the embryo. (B-F) Embryos were photolabelled in the territories shown in the animal and lateral view diagrams (left-most image) and cells were followed until the 16-somite stage (right-most image panels) by time-lapse microscopy. Consecutive time points are displayed in the right-hand four panels for each example label. Labels were placed in the prospective anterior neural (B), marginal zone (C) and prospective spinal cord (D) territories at 30% epiboly. At 50% epiboly, the boundaries of the prospective spinal cord region (E) and a smaller, more ventro-marginal, mesodermal region (F) were mapped. Arrowheads in F indicate that a subset of labelled cells specifically migrates and contributes to the tailbud mesenchyme. Native NLS-KikGR is shown in cyan, photoconverted NLS-Kik in red. (G,H) Plots showing the location and diameter of labels in relation to the number of embryos imaged per label at 30% (G) and 50% (H) epiboly. Labels are colour-coded according to the ratio of cells allocated to neural tissues or paraxial mesoderm. Blue indicates that over 90% of labelled cells contribute to neural tissues; red indicates that over 90% of labelled cells contribute to paraxial mesoderm; green indicates that labelled cells contribute both to neural and paraxial mesoderm. n indicates total number of embryos fate mapped. AP, animal pole; V, prospective ventral side; D, prospective dorsal side (shield). Dorsal and ventral only indicate 3D orientation of the embryo and not future dorsoventral position of cells.
Fig. 3.
Fig. 3.
Axial dispersion and neuro-mesodermal contribution of labelled cells. (A) 3D confocal stacks of photolabelled embryos were analysed to relate the initial label position with the contribution of cells along the anterior-posterior axis. (B-E) The contributions of labelled populations from individual examples are plotted against the anterior-posterior axis with the number of cells in each tissue compartment shown in red for the somitic mesoderm or blue for the neural tube. There is a significant degree of overlap between spinal cord- and mesoderm-fated cells within the marginal zone at both 30% (B,C) and 50% (D,E) epiboly.
Fig. 4.
Fig. 4.
Bipotential neuromesodermal cells segregate rapidly during mid to late gastrulation. (A) In silico tracking of cells within the multi-view reconstruction was performed to follow lineage segregation from 30% epiboly. A custom MATLAB-based tool was developed to allow for the extraction of tracking data. Tracks were selected separately (n=100) in marginal and animal subgroups and visualized on top of 75% epiboly stage nuclei as a reference (purple). Cells were selected and tracked forwards in time, then scored based on expression or absence of mezzo:eGFP marking mesoderm. (B) An example track demonstrating a number of cell divisions and the two terminal divisions, one scored as both neural and one as a bi-fated NMp. In total 102 tracks were validated, with 36 terminal divisions scored. (C) Frequencies of cell divisions per track. (D) Of the 36 terminal divisions, 11 demonstrated contributions to both the neural and mesodermal compartment, with a remaining eight contributing to only neural and 17 to only the mesoderm. (E-F) From the animal and lateral views, the bi-fated cells are clearly intermixed with mono-fated cells. The fated cells are shown overlaid on the animal view image and then expanded in the schematic. Asterisk in E indicates the first mezzo:eGFP-positive cells and therefore the dorsal-most aspect of the marginal zone.
Fig. 5.
Fig. 5.
Tailbud neuromesodermal populations are restricted to the posterior-most aspect of the body axis. (A-C) Regions of the tailbud were photolabelled at bud stage and followed until the completion of somitogenesis. Populations on the dorsolateral wall of the tailbud gave rise to both spinal cord and mesoderm derivatives (A), those more anterior generated only spinal cord (B) and those more ventral gave rise to only mesoderm (C). All labels had an additional contribution to non-neural ectoderm. (D) The contribution of labelled populations to the anterior-posterior axis are plotted separately for mesodermal (D) and neural (E) fates. In red are labels with mesodermal contribution only (n=7), in blue are spinal cord-specific populations (n=5) and in green are those that gave rise to both germ layers (n=9). (F-I) Hybridization chain reaction (HCR) for sox2 and tbxta was used to locate double-positive cells within 3D confocal datasets. (F) Original dataset with sox2 in cyan and tbxta in red; DAPI is in grey. (G) Surface segmentation of the HCR stain was performed to mask sox2 expression within the tbxta channel. (H) Masking reveals only those cells that are co-expressing both genes. (I) Magnified image of that shown in A to compare photolabel with co-expressing cells.
Fig. 6.
Fig. 6.
Quantification of cell division in tailbud NMps. Quantification of increase in number of cells photolabelled using nls-kikume from (A) bud stage through to (B) 24 hpf. (C) Fold-change increase in labelled clone number changes depending on the labelled progenitor type, with regions contributing only to neural tissue undergoing most clonal expansion and bipotent progenitors undergoing the least clonal expansion. (D-F) Replicating cells stained using phospho-histone H3 (pH3) as a marker of mitotic cells (yellow) with bipotent NMps identified through co-expression of Sox2 (blue) and Ntl (red) at the (D) 22-somite stage, (E) 26-somite stage and (F) 32-somite stage. (G-I) The frequency of Ph3-positive nuclei in the (G) Ntl-positive expression domain, including notochord, (H) Sox2-positive expression domain, and (I) Ntl and Sox2-positive NMp domain. Two-tailed Student's t-test. **P<0.01, ****P<0.0001.
Fig. 7.
Fig. 7.
Single cell tracking of tailbud progenitors during late somitogenesis demonstrates an absence of bi-fated cells and cellular mixing within the tailbud. (A) Experimental design to allow long-term light-sheet imaging of the growing zebrafish tailbud. Embryos at the 21-somite stage were mounted as described by Hirsinger and Steventon (2017). Z-stacks were captured every 2.5 min with image-based registration on downsampled images conducted every five frames. The shift of this registration is then fed back into the stage position in all three directions to re-centre the tailbud within the image. (B,C) Individual frames are shown every 2 h across the 8 h movie shown as both maximum projections (B) and as a medial slice (C). (D-G) Fates of cells were assigned by the termination point of the track by scoring-based position within the anatomy of the tailbud and the associated expression of neural markers (Sox2) and mesdoermal markers (Tbx16 and Tbxta). Medial slices of hybridization chain reaction are shown in D and E, and used to zone the tailbud in F. Automatic tracks were selected using a custom MATLAB script by selecting all cells posteriorly to the lines shown in G. Two movies were subsetted using the most-posterior lines generating two movies of 150 tracks each. A third movie was subset using the more-anterior line, generating 400 tracks. (H,I) Final fates were assigned and have been overlaid over the starting timepoint (H) with open circles representing cells close to the viewed plane and dots representing cells on a different z-section. These different z-planes have been collapsed into a single 2D image (I) and demonstrate an absence of a mixed population of unfated cells. The mixing around the notochord is an artifact of collapsing the z-axis into a 2D image. No cells were observed dividing with progeny entering both lineages.
Fig. 8.
Fig. 8.
Zebrafish allocated spinal cord and mesoderm progenitors through a combination of direct and delayed allocation modes. Diagrams depict zebrafish embryos at progressive stages of development with neuromesodermal competent regions shown in green. Cells either become restricted to spinal cord or paraxial mesoderm fates at early gastrulation (direct allocation; purple) or remain within the tailbud until late somitogenesis (delayed allocation; dark green).

References

    1. Abzhanov A. (2013). von Baer's law for the ages: lost and found principles of developmental evolution. Trends Genet. 29, 712-722. 10.1016/j.tig.2013.09.004 - DOI - PubMed
    1. Alemany A., Florescu M., Baron C. S., Peterson-Maduro J. and van Oudenaarden A. (2018). Whole-organism clone tracing using single-cell sequencing. Nature 556, 108-112. 10.1038/nature25969 - DOI - PubMed
    1. Amat F., Lemon W., Mossing D. P., McDole K., Wan Y., Branson K., Myers E. W. and Keller P. J. (2014). Fast, accurate reconstruction of cell lineages from large-scale fluorescence microscopy data. Nat. Methods 11, 951-958. 10.1038/nmeth.3036 - DOI - PubMed
    1. Bouldin C. M., Snelson C. D., Farr G. H. and Kimelman D. (2014). Restricted expression of cdc25a in the tailbud is essential for formation of the zebrafish posterior body. Genes Dev. 28, 384-395. 10.1101/gad.233577.113 - DOI - PMC - PubMed
    1. Brown J. M. and Storey K. G. (2000). A region of the vertebrate neural plate in which neighbouring cells can adopt neural or epidermal fates. Curr. Biol. 10, 869-872. 10.1016/S0960-9822(00)00601-1 - DOI - PubMed

Publication types