. 2018 Oct 17;10(463):eaaq0305.
doi: 10.1126/scitranslmed.aaq0305.

Mixed-effects association of single cells identifies an expanded effector CD4+ T cell subset in rheumatoid arthritis

Affiliations

Mixed-effects association of single cells identifies an expanded effector CD4+ T cell subset in rheumatoid arthritis

Chamith Y Fonseka et al. Sci Transl Med. .

Abstract

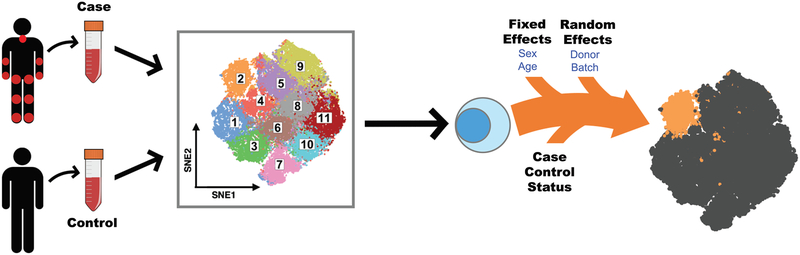
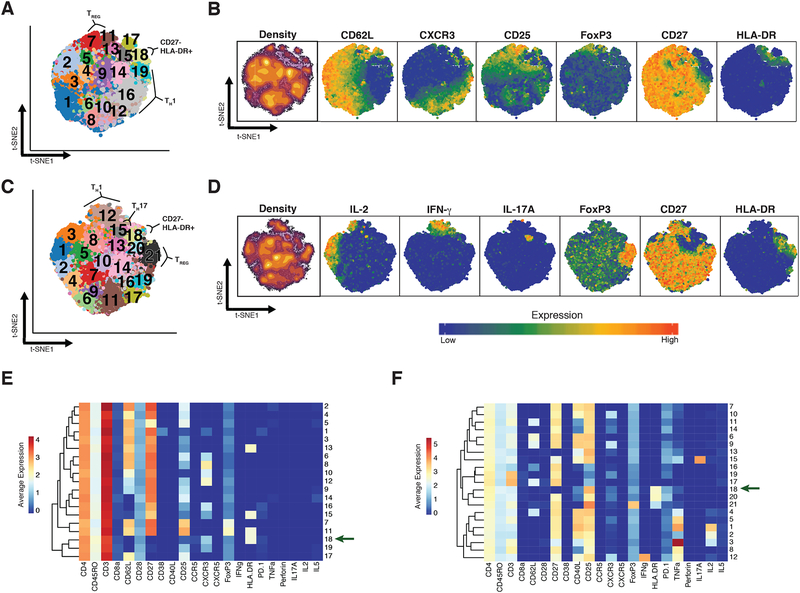
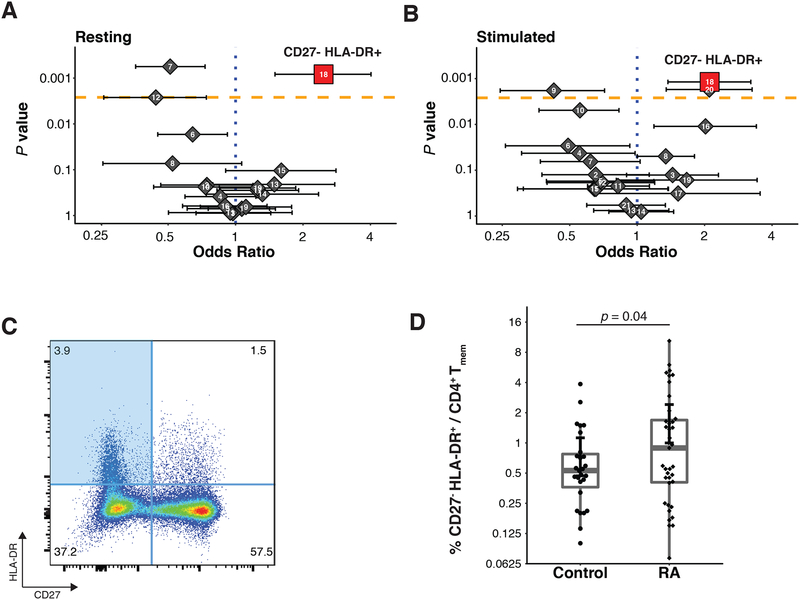
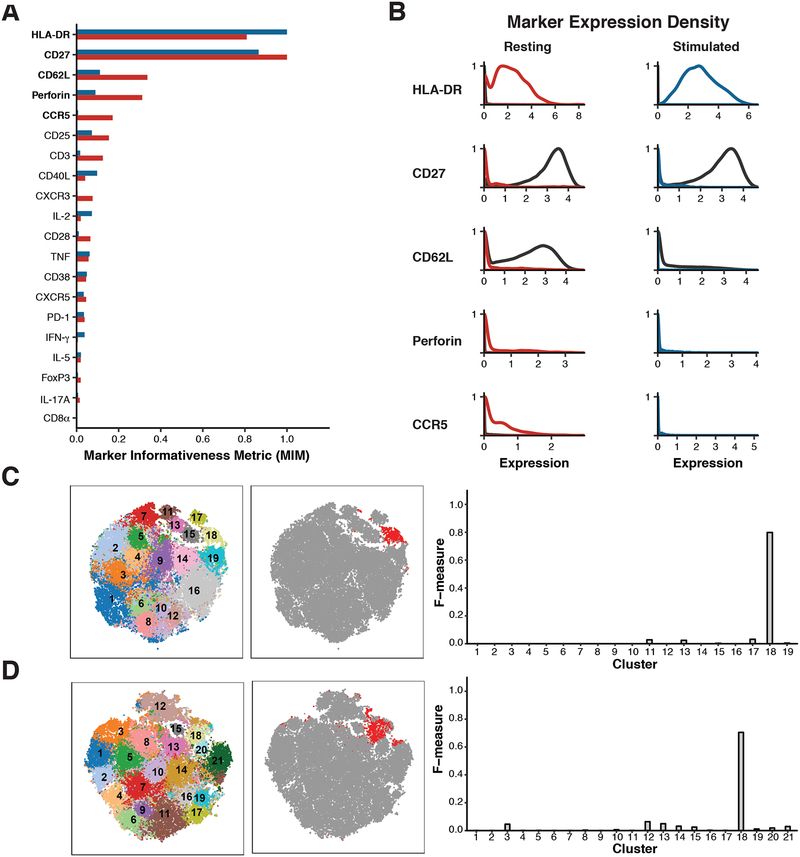
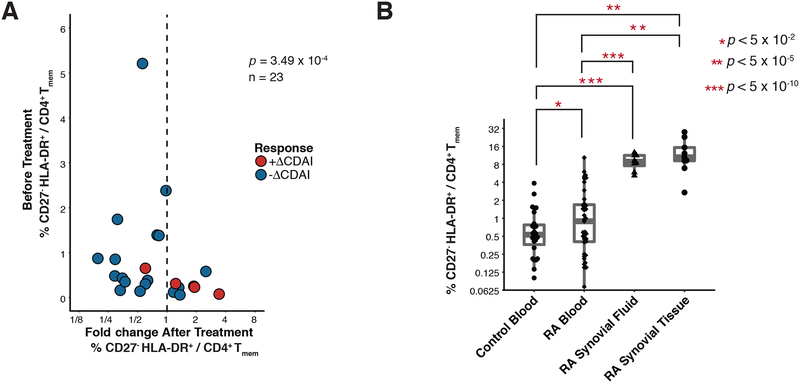
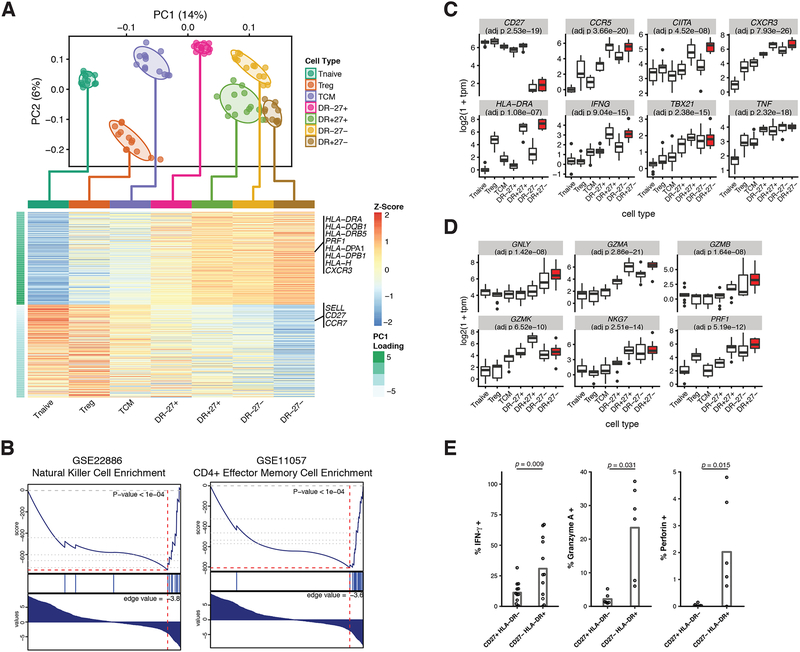
High-dimensional single-cell analyses have improved the ability to resolve complex mixtures of cells from human disease samples; however, identifying disease-associated cell types or cell states in patient samples remains challenging because of technical and interindividual variation. Here, we present mixed-effects modeling of associations of single cells (MASC), a reverse single-cell association strategy for testing whether case-control status influences the membership of single cells in any of multiple cellular subsets while accounting for technical confounders and biological variation. Applying MASC to mass cytometry analyses of CD4+ T cells from the blood of rheumatoid arthritis (RA) patients and controls revealed a significantly expanded population of CD4+ T cells, identified as CD27- HLA-DR+ effector memory cells, in RA patients (odds ratio, 1.7; P = 1.1 × 10⁻³). The frequency of CD27- HLA-DR+ cells was similarly elevated in blood samples from a second RA patient cohort, and CD27- HLA-DR+ cell frequency decreased in RA patients who responded to immunosuppressive therapy. Mass cytometry and flow cytometry analyses indicated that CD27- HLA-DR+ cells were associated with RA (meta-analysis P = 2.3 × 10⁻⁴). Compared to peripheral blood, synovial fluid and synovial tissue samples from RA patients contained about fivefold higher frequencies of CD27- HLA-DR+ cells, which comprised ~10% of synovial CD4+ T cells. CD27- HLA-DR+ cells expressed a distinctive effector memory transcriptomic program with T helper 1 (TH1)- and cytotoxicity-associated features and produced abundant interferon-γ (IFN-γ) and granzyme A protein upon stimulation. We propose that MASC is a broadly applicable method to identify disease-associated cell populations in high-dimensional single-cell data.


Conflict of interest statement

Competing interests

All authors declare that they have no competing financial interests. I.K. has been a paid bioinformatics consultant for Outlier Bio LLC since November 2017.

Figures

Figure 1:
Figure 1:. Mixed-effects modeling of Associations of Single Cells (MASC) overview.
Single cell transcriptomics or proteomics are used to assay samples from cases and controls, such as immunoprofiling of peripheral blood. The data is then clustered to define populations of similar cells. Mixed-effects logistic regression is used to predict individual cell membership in previously defined populations. The addition of a case-control term to the regression model allows the user to identify populations for which case-control status is significantly associated.
Figure 2:
Figure 2:. Diversity of CD4+ memory T cells before and after stimulation.
(A) t-SNE projection of 50,000 resting CD4+ memory T cells sampled equally from RA patients (n=24) and controls (n=26). DensVM identified 19 populations in this dataset. (B) Same t-SNE projections as in (A) colored by the density of cells on the SNE plot or the expression of the markers labeled above each panel. (C) t-SNE projection of 52,000 CD4+ stimulated memory T cells sampled equally from RA patients (n=26) and controls (n=26). Cells were stimulated for 24 hours with anti-CD3/anti-CD28 beads. (D) Same t-SNE projections as in (C) colored by the density of cells on the SNE plot or the expression of the markers labeled above each panel. (E) Heatmap showing mean expression of indicated markers across the 19 populations found in resting cells. (F) Heatmap showing mean expression of indicated markers across the 21 populations found after stimulation. Protein expression data are shown after arcsinh transformation. All markers but CD4 and CD45RO were used to create t-SNE projections and perform clustering.
Figure 3:
Figure 3:. MASC identifies a population that is expanded in RA.
(A, B) Odds ratios and association p-values were calculated by MASC for each population identified the resting (A) and stimulated (B) datasets. The yellow line indicates the significance threshold after applying the Bonferroni correction for multiple testing. (C) Flow cytometry dot plot of gated memory CD4+ T cells from a single RA donor shows the gates used to identify CD27 HLA-DR+ memory CD4+ T cells (blue quadrant). (D) Flow cytometric quantification of the percentage of CD27, HLA-DR+ cells among blood memory CD4+ T cells in an independent cohort of seropositive RA patients (n = 39) and controls (n = 27). Statistical significance was assessed using a one-tailed t-test after assessing normality with a Shapiro-Wilk test (p > 0.52).
Figure 4:
Figure 4:. CD27 and HLA-DR expression specifically mark the expanded population.
(A) Plot of the Kullback-Liebler divergence for each marker comparing cluster 18 to all other cells (grey) in both the resting dataset (red) and the stimulated dataset (blue). (B) Density plots showing expression of the five markers most different between cluster 18 cells (resting = red, stimulated = blue) and all other cells in the same dataset (black line). (C) Left: t-SNE projection of clusters identified in resting dataset; Middle: Same t-SNE projection, with cells gated as CD27- HLA-DR+ colored in red; Right: F-measure scores were calculated for the overlap between gated cells and each cluster in the resting dataset. (D) Left: t-SNE projection of clusters identified in stimulated dataset; Middle: Same t-SNE projection, with cells gated as CD27- HLA-DR+ colored in red; Right: F-measure scores were calculated for the overlap between gated cells and each cluster in the stimulated dataset.
Figure 5:
Figure 5:. CD27 HLA-DR+ memory CD4+ T cells are expanded in the blood and joints of patients with active RA.
(A) Flow cytometric quantification of the frequency of CD27- HLA-DR+ memory CD4+ T cells in 18 RA patients prior to starting a new medication, plotted against change in cell frequency after 3 months of new therapy. Treatment significantly reduced CD27- HLA-DR+ cell frequency as determined by a Wilcoxon signed-rank test. (B) Flow cytometric quantification of the percentage of memory CD4+ T cells with a CD27- HLA-DR+ phenotype in cells from seropositive RA synovial fluid (n=8) and synovial tissue (n=9), compared to blood samples from RA patients and controls. Blood sample data are the same as shown in panel 3d. Significance was assessed using one-tailed t-test after determining normality with a Shapiro-Wilk test (p > 0.52) and applying a Bonferroni correction for multiple testing.
Figure 6:
Figure 6:. Transcriptomic characterization of CD27- HLA-DR+ memory CD4+ T cells identified a Th1-skewed cytotoxic phenotype.
RNA-seq characterization of CD627- HLA-DR+ (DR+27-) cells and 6 related CD4+ T cell populations: naive T cells (Tnaive), regulatory T cells (Treg), central memory t cells (TCM), and three populations of effector memory T cells, CD27+ HLA-DR- (DR-27+), CD27+ HLA-DR+ (DR+27+), and CD27- HLA-DR- (DR-27-). (A) PCA plot (top) and PC1 gene loadings (bottom) of 90 samples from the 7 CD4+ T cell populations. Cells were colored on the PCA plot according to known cell type. Normal confidence ellipses at 1 standard deviation were plotted for each cell type. The 300 most positive and 300 most negative PC1 gene loadings for each cell type were averaged and plotted in the heatmap. Genes relevant to the CD27- HLA-DR+ population were labeled. (B) Gene set enrichment analysis was performed on all genes, ranked on their PC1 loadings. Two significantly enriched gene sets: NK signature (GSE22886 NAIVE CD4 T CELL VS NK CELL DN) and effector memory t cell signature (GSE11057 NAIVE VS EFF MEMORY CD4 T CELL) are shown. (C) Distribution of log-scaled expression of six canonical Th1 genes: CCR5, CIITA, CXCR3, IFNG, TBX21 (Tbet), and TNF. Populations are ordered by PC1 loading values, with CD27- HLA-DR+ population highlighted in red. (D) Distribution of log-scaled gene expression of six canonical cytotoxic genes: GNLY, GZMA, GZMB, GMZK, NKG7, and PRF1. Populations are ordered by PC1 loading values, with the CD27- HLA-DR+ population highlighted in red. Reported p-values in (C) and (D) correspond to a linear model of gene expression against ordered cell type (as an ordinal variable), with p-values adjusted for multiple testing by the Benjamini Hochberg procedure. (E) Cytokine expression determined by intracellular cytokine staining of peripheral effector memory CD4+ T cells after in vitro stimulation with PMA/ionomycin. The percentage of cells positive for each stain is plotted for CD27+ HLA-DR- and CD27- HLA-DR+ subsets. Each dot represents a separate donor (n = 12; 6 RA patients and 6 controls, except for the quantification of Granyzme A and perforin where n = 6; 3 RA patients and 3 controls). Statistical significance was assessed using a Wilcoxon signed-rank test.

Similar articles

Cited by

References

    1. Neu KE, Tang Q, Wilson PC, Khan AA, Single-Cell Genomics: Approaches and Utility in Immunology, Trends Immunol. 38, 140–149 (2017). - PMC - PubMed
    1. Cross M, Smith E, Hoy D, Carmona L, Wolfe F, Vos T, Williams B, Gabriel S, Lassere M, Johns N, Buchbinder R, Woolf A, March L, The global burden of rheumatoid arthritis: estimates from the global burden of disease 2010 study, Annals of the Rheumatic Diseases 73, 1316–1322 (2014). - PubMed
    1. Viatte S, Plant D, Raychaudhuri S, Genetics and epigenetics of rheumatoid arthritis, Nat Rev Rheumatol 9, 141–153 (2013). - PMC - PubMed
    1. Kurkó J, Besenyei T, Laki J, Glant TT, Mikecz K, Szekanecz Z, Genetics of Rheumatoid Arthritis — A Comprehensive Review, Clinic Rev Allerg Immunol 45, 170–179 (2013). - PMC - PubMed
    1. Gizinski AM, Fox DA, T cell subsets and their role in the pathogenesis of rheumatic disease, Current Opinion in Rheumatology 26, 204–210 (2014). - PubMed

Publication types

Substances