Comparative Study
. 2018 Oct 18;3(20):e121717.
doi: 10.1172/jci.insight.121717.

Superior immune reconstitution using Treg-expanded donor cells versus PTCy treatment in preclinical HSCT models

Affiliations
Comparative Study

Superior immune reconstitution using Treg-expanded donor cells versus PTCy treatment in preclinical HSCT models

Dietlinde Wolf et al. JCI Insight. .

Abstract

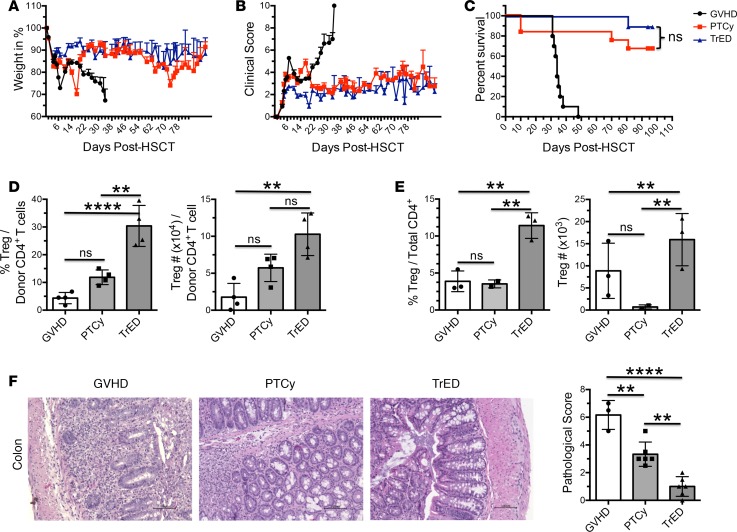
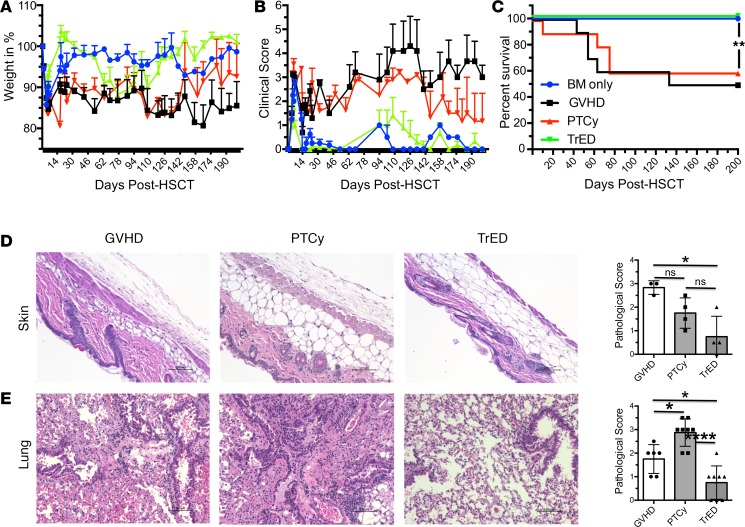
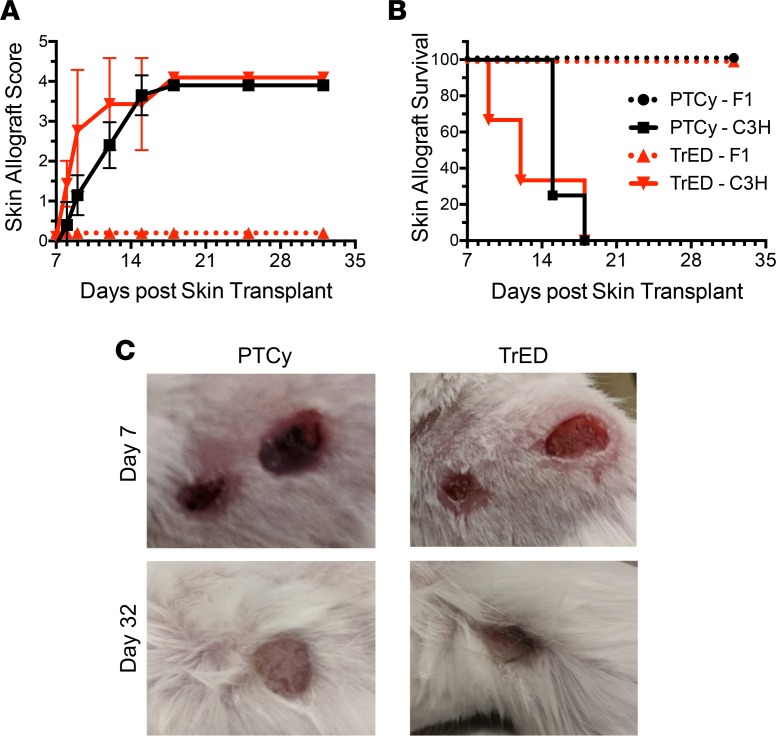
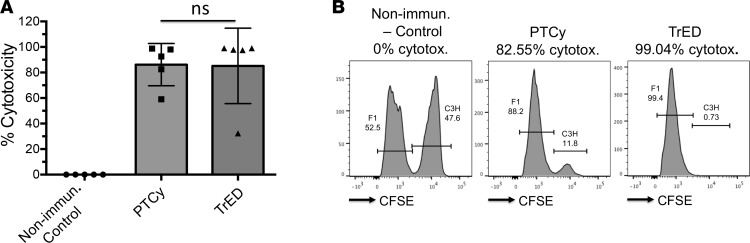
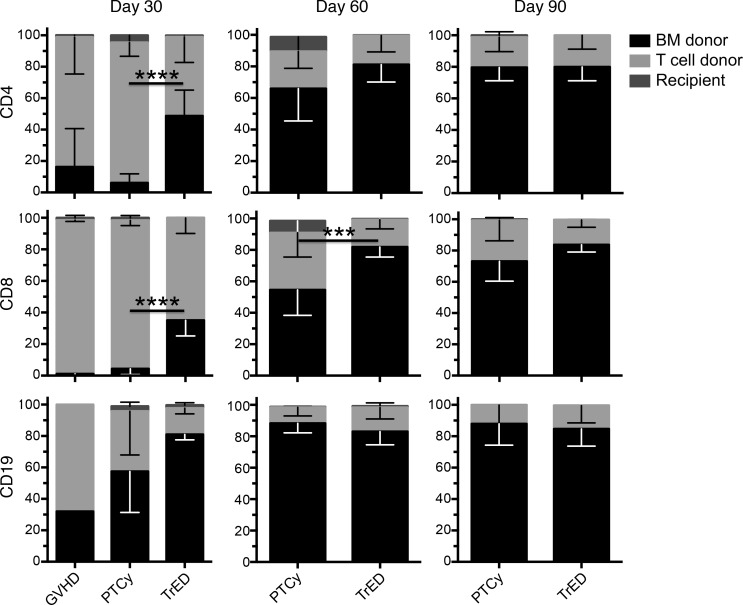
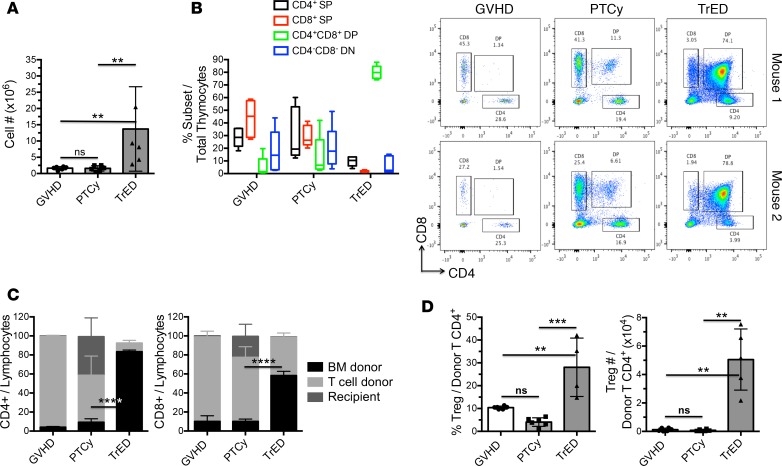
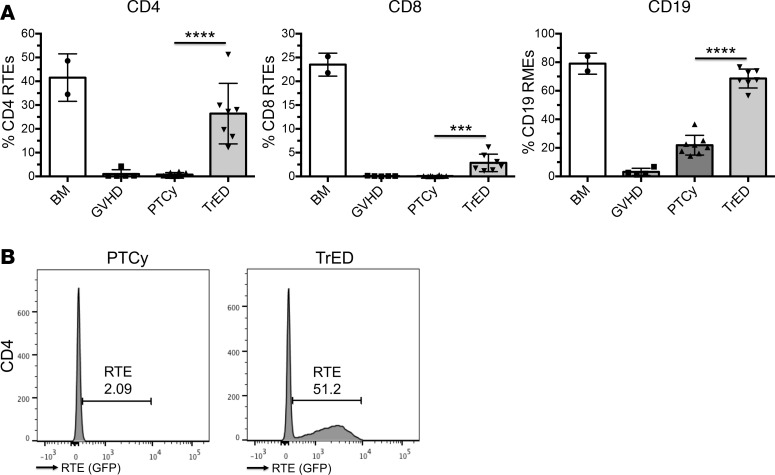
Posttransplant cyclophosphamide (PTCy) has been found to be effective in ameliorating acute graft-versus-host disease (GVHD) in patients following allogeneic hematopoietic stem cell transplantation (aHSCT). Adoptive transfer of high numbers of donor Tregs in experimental aHSCT has shown promise as a therapeutic modality for GVHD regulation. We recently described a strategy for in vivo Treg expansion targeting two receptors: TNFRSF25 and CD25. To date, there have been no direct comparisons between the use of PTCy and Tregs regarding outcome and immune reconstitution within identical groups of transplanted mice. Here, we assessed these two strategies and found both decreased clinical GVHD and improved survival long term. However, recipients transplanted with Treg-expanded donor cells (TrED) exhibited less weight loss early after HSCT. Additionally, TrED recipients demonstrated less thymic damage, significantly more recent thymic emigrants, and more rapid lymphoid engraftment. Three months after HSCT, PTCy-treated and TrED recipients showed tolerance to F1 skin allografts and comparable immune function. Overall, TrED was found superior to PTCy with regard to weight loss early after transplant and initial lymphoid engraftment. Based on these findings, we speculate that morbidity and mortality after transplant could be diminished following TrED transplant into aHSCT recipients, and, therefore, that TrED could provide a promising clinical strategy for GVHD prophylaxis.

Keywords: Bone marrow transplantation; Immunology; T cells; Transplantation.


Conflict of interest statement

Conflict of interest: RBL is a consultant for Allergan, HEAT Biologics, and Pelican Therapeutics and is on the scientific advisory board of HEAT Biologics.

Figures

Figure 1
Figure 1. Treg-expanded donor cells show advantages over PTCy treatment early after transplant; however, long-term outcomes are comparable in a major MHC-mismatch model of preclinical HSCT.
(AC) A HSCT utilizing a B6 BALB/c donor/recipient mouse model involving a complete MHC mismatch was performed on day 0. Lethally irradiated (8.5-Gy) BALB/c mice received 5 × 10⁶ TCD B6-CD45.1 BM cells and spleen cells from expanded (TL1A-Ig/IL-2; Treg-expanded donor cells [TrED] group) or untreated B6-FoxP3rfp (GVHD and PTCy group) donor mice adjusted to contain 1.1 × 10⁶ total T cells. Cyclophosphamide was given on day 3 and 4 after HSCT at 80 mg/kg i.p. Weights (day 12–19) (A), clinical scores (day 12–19) (B), and survival (P = ns) (C) (n = 10–12). Statistical analysis for weights and clinical score was also performed to assess the overall model using JMP 13 Pro. No statistical significance between PTCy and TrED was detected. A log-rank test was used for survival analysis. (D) Donor Treg frequencies and cell numbers in spleens on day 21 after HSCT are significantly higher in TrED recipients compared with PTCy-treated and GVHD control animals (n = 4). Data are expressed as mean ± SEM and were analyzed by ANOVA with Bonferroni correction for multiple comparisons. Data are pooled from 2 independent experiments. (E) Treg frequencies and cell numbers in lamina propria on day 21 after HSCT are significantly higher in TrED recipients compared with PTCy-treated and GVHD control animals (n = 3). Data are expressed as mean ± SEM and were analyzed by ANOVA with Bonferroni correction for multiple comparisons. Data shown are from 1 experiment. (F) Representative H&E-stained sections from colons on day 21 after HSCT show severe colitis in tissue from untreated HSCT recipients, with disruption of architecture, acute inflammation with severe lymphocyte infiltration, edema, mucosal thickening, and severe necrosis. In contrast, PTC colonic tissue showed mild hyperplasia, mild inflammation, and edema in the submucosa. Finally, colon tissue from TrED recipients exhibited patchy and mild colitis without hyperplasia or necrosis. Original magnification, ×200. Pathology scores are shown on the right (n = 3–6). Data (from 2 independent experiments) are shown as mean ± SEM; ANOVA with Bonferroni correction was applied for multiple comparisons. *P < 0.05; **P < 0.01; ***P < 0.001; ****P < 0.0001. Scale bars: 100 μm.
Figure 2
Figure 2. Comparison of TrED and PTCy treatment in a minor MHC-mismatch model shows comparable results to the major MHC-mismatch model.
(AC) A HSCT utilizing a B10.D2 BALB/c donor/recipient mouse model across a MHC-matched, minor histocompatibility antigen mismatch was performed using 8 × 10⁶ non-TCD BM cells + 25 × 106 spleen cells from either untreated (GVHD and PTCy group) or TL1A-Ig/IL-2–expanded (TrED group) B10.D2 donor mice (BM: n = 8; GVHD and PTCy: n = 12; TrED: n = 17). Percentage of initial weight (day 10–24, P < 0.0001) (A), clinical score (day 10–24, P < 0.0001) (B) and survival (**P < 0.01) (C) are presented. Survival was analyzed by log-rank test. Statistical analysis for weights and clinical score was also performed to assess the overall model using JMP 13 Pro. P < 0.05 for all the groups. (D) Representative H&E staining from untreated recipient skin on day 31 after HSCT exhibited substantial fibrosis and thickening accompanied by moderate infiltration and inflammation with patchy necrosis. However, skin from PTC-treated recipients showed mild fibrosis with mild inflammation and some infiltrate and hyperplasia. In contrast, no fibrosis or thickening was observed with only mild inflammation in TrED recipients. Original magnification, ×200. Pathology scores are shown on the right (n = 3–4). Data are shown as mean ± SEM; ANOVA with Bonferroni correction was applied for multiple comparisons. *P < 0.05. Data are pooled from 2 independent experiments. Scale bars: 100 μm. (E) Representative H&E staining (chosen from 2 independent experiments) from recipient lung on day 200 after HSCT exhibited multifocal areas of moderate chronic, active inflammation, and fibrosis. The inflammation was characterized mainly by lymphocytes and macrophages with smaller numbers of neutrophils. Many alveoli also contained large macrophages and foamy cytoplasm in the PTCy compared with the TrED group, which was within normal limits. Original magnification, ×200. Pathology scores are shown on the right (n = 6–8). Data are shown as mean ± SEM; ANOVA with Bonferroni correction was applied for multiple comparisons. *P < 0.05; **P < 0.01; ***P < 0.001; ****P < 0.0001. Scale bars: 100 μm.
Figure 3
Figure 3. Functional immunity is intact in TrED recipients and PTCy-treated animals.
TrED and PTCy recipients received 2 skin grafts, applied on the trunk of each mouse, 1 from B6×BALB/c F1 (H2b/d) mice and 1 from C3H/HeJ third-party (H2k) donors 3 months after HSCT. Grafts were assessed and scored on days 7, 8, 9, 12, 15, 18, 25, and 32 (n = 4). (A) Allograft score. Graft scoring was performed as follows: 0, intact graft and healthy appearance; 1, inflamed graft, but without signs of necrosis observed; 2, inflamed graft and less than 25% necrosis observed; 3, inflamed graft and between 25% and 75% necrosis observed; and 4, greater than 75% necrosis detected or loss of graft. (B) Allograft survival. All mice accepted the F1 (B6×BALB/c) skin grafts, whereas all C3H/HeJ grafts were rejected in both PTCy and TrED transplant recipients by day 18. (C) Representative photographs of skin grafts present on recipient mice on days 7 and 32 from both groups (PTCy, left; TrED, right).
Figure 4
Figure 4. aHSCT recipients of both TrED and PTCy are able to mount T cell recall responses following priming against alloantigens.
Three months after HSCT, recipients were immunized twice, 14 days apart, with 50 × 106 spleen, LN, and thymic cells from third-party complete MHC-disparate C3H/HeJ mice (H2k). Four days after the last immunization, splenocytes from both third-party C3H/HeJ (H2k) and F1 cells (BALB/c × C57/Bl6; H2b/d) were labeled with high (5 μM) and low (0.5 μM) levels of CFSE, respectively, and inoculated at a ratio of 1:1 (20 × 106 total) into groups of (a) unimmunized BM-transplanted BALB/c (“control”) mice and the immunized mice from both (b) TrED- and (c) PTCy-treated recipients. 12–18 hours later, all mice were sacrificed and cytotoxicity was assessed in the spleen by gating on the CFSE+ cells (n = 5). Cytotoxicity was calculated using the following formula: 1 – (C3Hsample × F1control)/(C3Hcontrol × F1sample) × 100. (A) TrED and PTCy recipients show comparable anti-C3H/HeJ H2k third-party cytotoxicity. Data are expressed as mean ± SEM and were analyzed by a 2-tailed unpaired t test. Data are pooled from 2 independent experiments. (B) Representative flow cytometry histograms. Lower fluorescent peaks of CFSE-labeled C3H versus F1 cells indicate cytotoxicity against these third-party target cells.
Figure 5
Figure 5. More rapid peripheral engraftment in TrED recipients compared with PTCy-treated animals.
The origin of lymphoid cells from transplanted mature donor T cells (CD45.1, H2Kb+), transplanted hematopoietic progenitors (T cell–depleted bone marrow = (CD45.1+, H2Kb+), or surviving recipient lymphocytes (host: CD45.1,H2Kb–), present in recipients of TrED and PTCy was assessed in peripheral blood by flow cytometry from 1–3 months after HSCT by staining with directly conjugated anti-CD45.1 and anti-Kb mAbs. A significantly faster engraftment of CD4 and CD8 cells was detected in TrED recipients compared with PTCy-treated and GVHD controls (first column, day 30). GVHD, n = 3; PTCy and TrED, n = 8–10. Data are expressed as mean ± SEM and were analyzed by a 2-tailed unpaired t test. ***P < 0.001; ****P < 0.0001.
Figure 6
Figure 6. Faster thymic recovery in TrED recipients compared with PTCy-treated animals and GVHD controls early after HSCT.
Three weeks after HSCT, thymic tissue was analyzed for total cell numbers (A), phenotype (B), engraftment (C), and Tregs (D) (n = 4–6). (A) Significantly greater cell numbers were identified in TrED recipients compared with PTCy-treated and control animals. Data from 3 pooled independent experiments are shown as mean ± SEM; ANOVA with Bonferroni correction was applied for multiple comparisons. (B) Normal levels of CD4+CD8 and CD4CD8+ SP as well as DP thymocytes are detected in TrED recipients. PTC-treated animals and GVHD controls show an abnormal pattern of thymocytes, with few DP cells and a prevalence of SP cells (left). Representative dot plots for each group are shown (right). (C) Assessment of the origin of developing thymocytes shows a significantly faster engraftment from donor CD45.1+ stem cells in the CD4+ and CD8+ SP compartment in TrED recipients compared with PTCy-treated animals and GVHD controls. Data are expressed as mean ± SEM and were analyzed by a 2-tailed unpaired t test. Data are pooled from 2 independent experiments. (D) TrED recipients exhibit higher frequencies and numbers of donor CD4+Foxp3+ Tregs. Data from 3 pooled independent experiments are shown as mean ± SEM; ANOVA with Bonferroni correction was applied for multiple comparisons. **P < 0.01; ***P < 0.001; ****P < 0.0001.
Figure 7
Figure 7. Significantly higher frequencies of recent thymic/marrow emigrants in TrED recipients versus PTCy-treated animals and GVHD controls early after HSCT.
A HSCT utilizing a B6 BALB/c donor/recipient mouse model involving a complete MHC mismatch was performed on day 0. Lethally irradiated (8.5-Gy) BALB/c mice received 5 × 10⁶ TCD B6-RAG2p-GFP BM cells and spleen cells from expanded (TL1A-Ig/IL-2; TrED group) or untreated B6-FoxP3rfp (GVHD and PTCy group) donor mice adjusted to contain 1.1 × 10⁶ total T cells. Cyclophosphamide was given on day 3 and 4 after HSCT at 80 mg/kg i.p. Recent thymic/marrow emigrants (RTEs/RMEs) were analyzed in PB by flow cytometry 3 weeks after HSCT (BM, n = 2; GVHD, n = 5; PTCy and TrED, n = 8). (A) Significantly higher frequencies of CD4+ and CD8+ RTEs as well as CD19+ B cells (RMEs) are detected in TrED recipients compared with PTCy-treated animals and GVHD controls. Data are expressed as mean ± SEM and were analyzed by a 2-tailed unpaired t test. (B) A representative histogram from the TrED and the PTCy group is shown. *P < 0.05; **P < 0.01; ***P < 0.001; ****P < 0.0001.

Similar articles

Cited by

References

    1. Couriel D, Caldera H, Champlin R, Komanduri K. Acute graft-versus-host disease: pathophysiology, clinical manifestations, and management. Cancer. 2004;101(9):1936–1946. doi: 10.1002/cncr.20613. - DOI - PubMed
    1. Zeiser R, Blazar BR. Pathophysiology of chronic graft-versus-host disease and therapeutic targets. N Engl J Med. 2017;377(26):2565–2579. doi: 10.1056/NEJMra1703472. - DOI - PubMed
    1. Zeiser R, Blazar BR. Acute graft-versus-host disease - biologic process, prevention, and therapy. N Engl J Med. 2017;377(22):2167–2179. doi: 10.1056/NEJMra1609337. - DOI - PMC - PubMed
    1. Luznik L, Fuchs EJ. High-dose, post-transplantation cyclophosphamide to promote graft-host tolerance after allogeneic hematopoietic stem cell transplantation. Immunol Res. 2010;47(1-3):65–77. doi: 10.1007/s12026-009-8139-0. - DOI - PMC - PubMed
    1. Luznik L, O’Donnell PV, Fuchs EJ. Post-transplantation cyclophosphamide for tolerance induction in HLA-haploidentical bone marrow transplantation. Semin Oncol. 2012;39(6):683–693. doi: 10.1053/j.seminoncol.2012.09.005. - DOI - PMC - PubMed

Publication types

MeSH terms

Substances