. 2018 Oct 18;3(20):e121521.
doi: 10.1172/jci.insight.121521.

Coordination of ENT2-dependent adenosine transport and signaling dampens mucosal inflammation

Affiliations

Coordination of ENT2-dependent adenosine transport and signaling dampens mucosal inflammation

Carol M Aherne et al. JCI Insight. .

Abstract

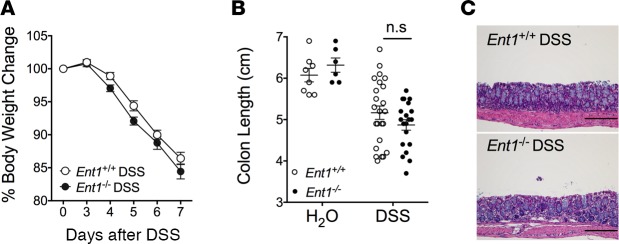
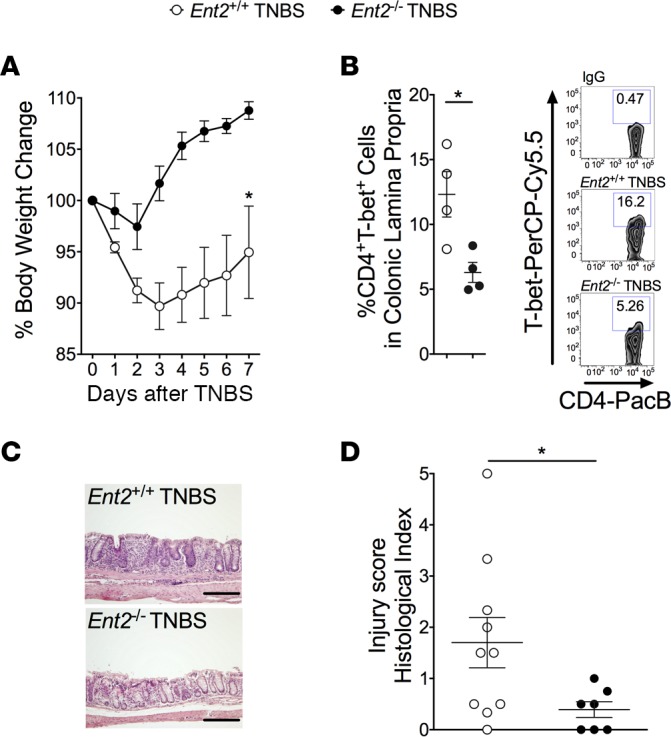
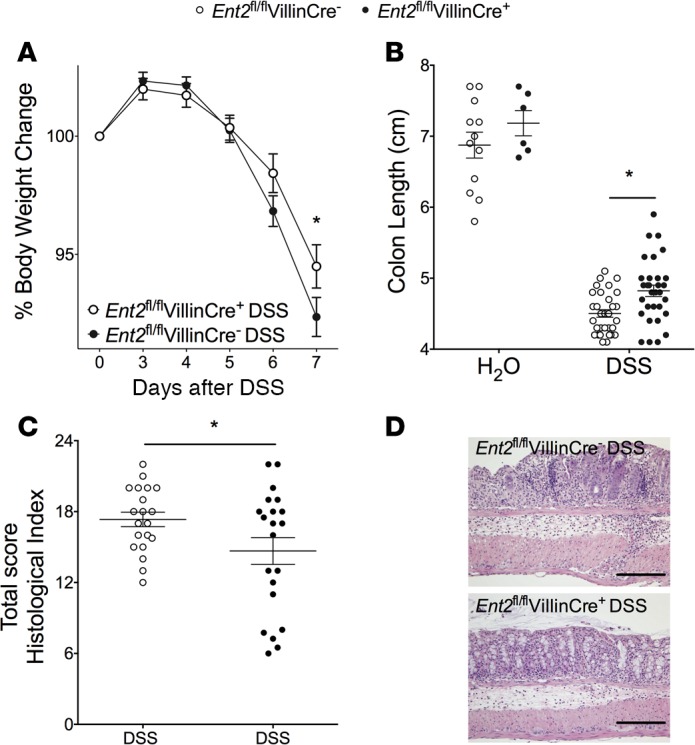
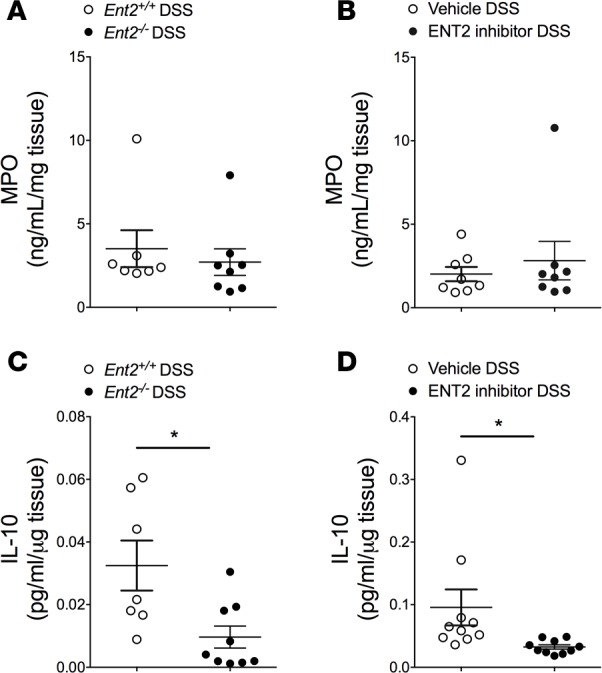
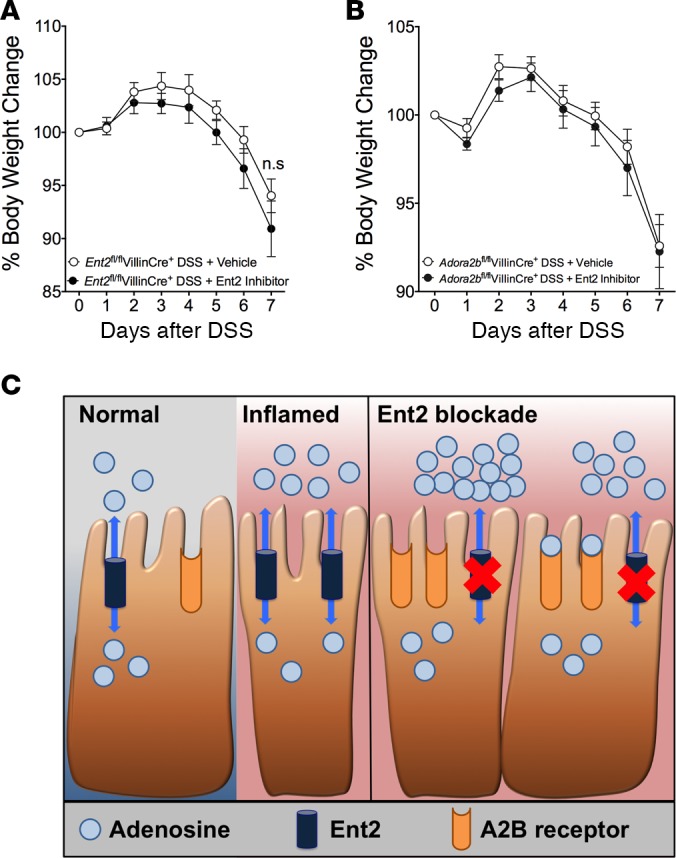
Intestinal epithelial barrier repair is vital for remission in inflammatory bowel disease (IBD). Extracellular adenosine signaling has been implicated in promoting restoration of epithelial barrier function. Currently, no clinically approved agents target this pathway. Adenosine signaling is terminated by uptake from the extracellular space via equilibrative nucleoside transporters (ENTs). We hypothesized that ENT inhibition could dampen intestinal inflammation. Initial studies demonstrated transcriptional repression of ENT1 and ENT2 in IBD biopsies or in murine IBD models. Subsequent studies in mice with global Ent1 or Ent2 deletion revealed selective protection of Ent2-/- mice. Elevated intestinal adenosine levels in conjunction with abolished protection following pharmacologic blockade of A2B adenosine receptors implicate adenosine signaling as the mechanism of gut protection in Ent2-/- mice. Additional studies in mice with tissue-specific deletion of Ent2 uncovered epithelial Ent2 as the target. Moreover, intestinal protection provided by a selective Ent2 inhibitor was abolished in mice with epithelium-specific deletion of Ent2 or the A2B adenosine receptor. Taken together, these findings indicate that increased mucosal A2B signaling following repression or deletion of epithelial Ent2 coordinates the resolution of intestinal inflammation. This study suggests the presence of a targetable purinergic network within the intestinal epithelium designed to limit tissue inflammation.

Keywords: Gastroenterology; Inflammatory bowel disease.


Conflict of interest statement

Conflict of interest: The authors have declared that no conflict of interest exists.

Figures

Figure 1
Figure 1. Ent 1 and Ent2 expression is repressed in IBD and murine colitis.
(A and B) cDNA from control, active Crohn’s disease, or ulcerative colitis biopsies (Origene) was probed with specific primers (QuantiTect, QIAGEN) for human ENT1, ENT2, and β-actin. ENT1 and ENT2 levels were normalized to β-actin and are expressed as fold change relative to control biopsies. n = 5 control, n = 17–21 Crohn’s disease, and n = 18–20 ulcerative colitis patients. (CF) Sex-, age-, and weight-matched C57BL/6 mice were exposed to DSS. After 3, 6, or 7 days, whole-colon (C and D) or mucosal scrapings from the proximal and distal colon (E and F) were harvested, and total RNA was extracted. TaqMan RT-PCR for Ent1, Ent2, and 18s was performed. (CF) mRNA transcript levels were calculated relative to 18s and are expressed as the fold change compared with water-treated (H2O) mice. In all cases data are displayed as mean ± SEM. Results in C and D represent n = 5–10 mice/group from 2 independent experiments. Results in E and F represent 6–8 mice/group from 2 independent experiments. One-way ANOVA with post hoc Dunnett’s multiple-comparisons test was performed to determine statistical differences compared with control or water. *P < 0.05.
Figure 2
Figure 2. Ent1 and Ent2 inhibition is protective in acute experimental colitis.
Sex-, age-, and weight-matched C57BL/6 WT mice were treated with dipyridamole (combined Ent1 and Ent2) inhibitor, 5 mg/kg, i.p., or vehicle 2–3 times daily from 1 day prior to exposure to DSS. (A) Daily weight measurements were obtained for each group of mice and are displayed as percentage of the body weight average from day 0–3. (B) Following sacrifice, colons were harvested and measured. (C) Mice were administered FITC-dextran by oral gavage (0.6 mg/g at 100 mg/ml) 4 hours prior to sacrifice on day 7. Serum was harvested at sacrifice, and fluorescence measurement was used to determine FITC levels. n = 7 mice/group from 1 independent experiment. (D) Blinded histological analysis of whole colon from each group following DSS exposure. Representative histological sections from whole colon harvested on day 7 after DSS (scale bars: 100 μm; images acquired at ×10). Unless otherwise stated, results of 2 independent experiments are presented as mean ± SEM (n = 4–17 mice/group). Two-way ANOVA with post hoc Bonferroni’s t test was used to determine statistical weight change. Two-way ANOVA with post hoc Tukey’s multiple comparison test was used to determine statistical colon length change. In all other cases, unpaired Student’s t test was used. *P < 0.05.
Figure 3
Figure 3. Loss of Ent1 does not protect the colonic mucosa during experimental colitis.
Ent1-deficient mice (Ent1–/–) or C57BL/6 WT controls (Ent1+/+) matched by sex, age, and weight were exposed to water or DSS. (A) Weight measurements were obtained for each group of mice and are displayed as percentage of body weight on day 0. (B) Following sacrifice, colons were harvested and measured. (C) Representative histological sections from whole colon harvested on day 7 after DSS (scale bars: 200 μm; images acquired at ×10). Results of 3 independent experiments are shown as mean ± SEM (n = 6–24 mice/group). Two-way ANOVA with post hoc Bonferroni’s t test was used to determine statistical weight change. Two-way ANOVA with post hoc Tukey’s multiple comparison test was used to determine statistical colon length change. P < 0.05.
Figure 4
Figure 4. Deletion of Ent2 protects from inflammation and injury in DSS colitis.
Matched Ent2-deficient mice (Ent2–/–) or WT controls (Ent2+/+, mice on a B6/129 background) were exposed to DSS. (A) Weights were obtained for each group of mice and are displayed as percentage of body weight on day 0. (B) Following sacrifice, colons were harvested and measured. (C) Mice were administered FITC-dextran by oral gavage (0.6 mg/g at 80 mg/ml) 4 hours prior to sacrifice on day 7. Serum was harvested at sacrifice, and fluorescence measurement was used to determine FITC levels. n = 5–7 mice/group from 1 independent experiment. (D) Following sacrifice on day 7, whole colonic tissue was snap frozen. Total RNA was extracted and RT-PCR. performed. mRNA transcript levels were calculated relative to β-actin and are expressed as fold change compared with DSS-treated WT mice. Data represent 5–8 mice per group from 1 independent experiment. (E) Representative histological sections from whole colon harvested on day 7 after DSS (scale bars: 100 μm; images acquired at ×10). (F) Histological analysis of whole colon harvested on day 7 after DSS provided by a pathologist blinded to the groups and the study. Unless otherwise stated, there were n = 7–9 mice/group. presented are representative of at least 3 independently performed experiments. Graphs show data as the mean ± SEM. Two-way ANOVA with post hoc Bonferroni’s t test was used to determine statistical weight change; in all other cases, unpaired Student’s t test was used. *P < 0.5, **P < 0.001.
Figure 5
Figure 5. Loss of Ent2 results in a marked reduction in the severity of TNBS colitis.
Matched Ent2-deficient mice (Ent2–/–) or WT controls (Ent2+/+, mice on B6/129 background) were given a TNBS (2,4,6-trinitrobenzenesulfonic acid) enema 7 days following skin sensitization. (A) Weights for each group of mice are presented as percentage of body weight on day 0. (B) Lamina propria leukocytes were isolated from mouse colon 7 days after TNBS enema. Flow cytometric analysis of CD4+T-bet+ cells was performed. Left: Percentage of CD4+T-bet+ cells in the colonic lamina propria in each group. Right: Representative zebra plots of the percentage of CD4+T-bet+ cells in the colonic lamina propria. IgG served as an antibody control for antibody staining. Data represent n = 4 mice per group. (C) Representative histological sections from distal colon harvested on day 7 after TNBS (scale bars: 200 μm; images acquired at ×10). (D) Histological analysis of distal colon harvested on day 7 after TNBS enema provided by a pathologist blinded to the groups and the study. Results are displayed as mean ± SEM; n = 7–11 mice/group from 1 independent experiment. Two-way ANOVA with post hoc Bonferroni’s t test was used to determine statistical weight change; in all other cases, unpaired Student’s t test was used. *P < 0.05
Figure 6
Figure 6. Ent2 expression on the intestinal epithelium is detrimental during experimental colitis.
Mice with Ent2 deletion in the intestinal epithelium (Ent2fl/flVillinCre+) or matched WT littermates (Ent2fl/flVillinCre) were given water or DSS. (A) Weights for each group are presented as percentage of bodyweight on day 0. (B) On day 7 following DSS, mice were sacrificed. Colons were harvested, and length was measured. (C) Histological analysis of distal colon harvested on day 7 after DSS. Scores were provided by a pathologist blinded to the groups and the study. (D) Representative histological sections from distal colon harvested on day 7 after DSS (scale bars: 200 μm; images acquired at ×10). Results are displayed as mean ± SEM. In A and B, results represent n = 6–32 mice/group from 3 independent experiments. In C and D, results represent n = 20–21 mice/group from 2 independent experiments. Two-way ANOVA with post hoc Bonferroni’s t test was used to determine statistical weight change. Two-way ANOVA with post hoc Tukey’s multiple comparison test was used to determine statistical colon length change. In all other cases, unpaired Student’s t test was used. *P < 0.05.
Figure 7
Figure 7. Adenosine generation and signaling play a central role in the protective effect of Ent2 loss in experimental colitis.
(A) Sex-, age-, and weight-matched Ent2-deficient mice (Ent2–/–) or WT controls (Ent2+/+, mice on a B6/129 background) were exposed to DSS for 6 days, followed by water for 24 hours. Colonic lavage was performed on terminally anesthetized mice with nucleoside preserving cocktail. Adenosine concentration in the lavage fluid was determined by HPLC and normalized to protein content. Results are shown as mean ± SEM, n = 6 mice/group, and are representative of 2 independent experiments. (BD) Sex-, age-, and weight-matched Ent2-deficient mice (Ent2–/–, mice on a B6/129 background) were treated with an A2B receptor–specific antagonist (PSB 1115, 1 mg/kg/mouse, oral gavage) on days –1, 0, 2, 4, and 6 of DSS colitis. (B) Mice were weighed daily. Results are presented as percentage of bodyweight on day 0. (C) Histological analysis of whole colon harvested on day 7 after DSS. Scores were provided by a pathologist blinded to the groups and the study. (D) Representative histological sections from whole colon harvested on day 7 after DSS (Bar represents 100 μm; images acquired at ×10). Results are presented as mean ± SEM, n = 7–8 mice/treatment group, from 1 independent experiment. Two-way ANOVA with post hoc Bonferroni’s t test was used to determine statistical weight change; in all other cases, paired Student’s t test was used. *P < 0.05.
Figure 8
Figure 8. Specific pharmacological inhibition of Ent2 ameliorates experimental colitis.
Sex-, age-, and weight-matched C57BL/6 WT mice were treated with soluflazine (Ent2 inhibitor, 7.7 μg/kg, Alzet pump) or vehicle 1 day prior to exposure to DSS. (A) Chemical structure of Ent2 inhibitor (soluflazine). (B) Each group of mice was weighed daily. Weights are presented as percentage of body weight on day 0. (C) Following sacrifice, colons were harvested and measured. (D) Histological analysis of whole colon from each group following DSS. Scores were provided by a pathologist blinded to the groups and the study. Representative histological sections from whole colon harvested on day 7 after DSS (scale bars: 200 μm; images acquired at ×10). Results of 2 independent experiments are presented as mean ± SEM (n = 2 mice/water group and n = 10 mice/DSS group). Two-way ANOVA with post hoc Bonferroni’s t test was used to determine statistical weight change; in all other cases, unpaired Student’s t test was used. *P < 0.05.
Figure 9
Figure 9. Genetic or pharmacologic Ent2 inhibition does not affect neutrophil migration or increase IL-10 expression in DSS colitis.
Matched Ent2-deficient mice (Ent2–/–) or WT controls (Ent2+/+, mice on a B6/129 background) were exposed to DSS (A and C), or C57BL/6 WT mice were treated with soluflazine (Ent2 inhibitor, 7.7 μg/kg, Alzet pump) or vehicle 1 day prior to exposure to DSS for 7 days (B and D). Following sacrifice, colons were harvested. (A and B) Whole colon was homogenized and myeloperoxidase (MPO) activity measured by specific ELISA. (C and D) Whole colon was placed in cell culture media for 24 hours (C, ex vivo culture) or whole colon was homogenized (D). Media from ex vivo culture or tissue lysate were loaded onto a Meso Scale assay plate for specific detection of mouse IL-10. Data in A, B, and C are presented relative to tissue weight. Data in D are relative to protein concentration as determined by BCA. Data represent 7–8 mice per group (A), 8 mice per group (B), 7–9 mice per group (C), and 10 mice per group (D), from 1 independent experiment. Results are displayed as mean ± SEM. Unpaired Student’s t test was used to test for statistical changes. *P < 0.05.
Figure 10
Figure 10. Ent2 and the A2B receptor on the colonic intestinal epithelium provide a targetable signaling network to protect the inflamed colon.
Matched mice with (A) Ent2 deletion on the intestinal epithelium (Ent2fl/flVillinCre+) or (B) A2B receptor deletion on the intestinal epithelium (Adora2bfl/flVillinCre+) were treated with soluflazine (Ent2 inhibitor, 7.7 μg/kg, Alzet pump) or vehicle 1 day prior to exposure to DSS or water. Mice were weighed, and results are presented as percentage of body weight on day 0. Two-way ANOVA with post hoc Bonferroni’s t test was used to determine statistical weight change. n = 6–8 mice/group from 1 independent experiment. (C) Schematic of functional consequence of Ent2 inhibition in colitis. Intestinal inflammation as observed in IBD is associated with decreased intestinal epithelial Ent2 expression, which leads to increased extracellular adenosine that can signal through the epithelial A2B adenosine receptor to protect the mucosal barrier.

Similar articles

Cited by

References

    1. Shivashankar R, Tremaine WJ, Harmsen WS, Loftus EV. Incidence and prevalence of Crohn’s disease and ulcerative colitis in Olmsted County, Minnesota from 1970 through 2010. Clin Gastroenterol Hepatol. 2017;15(6):857–863. doi: 10.1016/j.cgh.2016.10.039. - DOI - PMC - PubMed
    1. Peyrin-Biroulet L, Loftus EV, Colombel JF, Sandborn WJ. The natural history of adult Crohn’s disease in population-based cohorts. Am J Gastroenterol. 2010;105(2):289–297. doi: 10.1038/ajg.2009.579. - DOI - PubMed
    1. Monstad I, Hovde O, Solberg IC, A Moum B. Clinical course and prognosis in ulcerative colitis: results from population-based and observational studies. Ann Gastroenterol. 2014;27(2):95–104. - PMC - PubMed
    1. Beigel F, et al. Rate and predictors of mucosal healing in patients with inflammatory bowel disease treated with anti-TNF-alpha antibodies. PLoS ONE. 2014;9(6):e99293. doi: 10.1371/journal.pone.0099293. - DOI - PMC - PubMed
    1. Pineton de Chambrun G, Peyrin-Biroulet L, Lémann M, Colombel JF. Clinical implications of mucosal healing for the management of IBD. Nat Rev Gastroenterol Hepatol. 2010;7(1):15–29. doi: 10.1038/nrgastro.2009.203. - DOI - PubMed

Publication types

MeSH terms