. 2018 Oct 18;3(20):e120922.
doi: 10.1172/jci.insight.120922.

Transcranial optical imaging reveals a pathway for optimizing the delivery of immunotherapeutics to the brain

Affiliations

Transcranial optical imaging reveals a pathway for optimizing the delivery of immunotherapeutics to the brain

Benjamin A Plog et al. JCI Insight. .

Erratum in

Abstract

Despite the initial promise of immunotherapy for CNS disease, multiple recent clinical trials have failed. This may be due in part to characteristically low penetration of antibodies to cerebrospinal fluid (CSF) and brain parenchyma, resulting in poor target engagement. We here utilized transcranial macroscopic imaging to noninvasively evaluate in vivo delivery pathways of CSF fluorescent tracers. Tracers in CSF proved to be distributed through a brain-wide network of periarterial spaces, previously denoted as the glymphatic system. CSF tracer entry was enhanced approximately 3-fold by increasing plasma osmolality without disruption of the blood-brain barrier. Further, plasma hyperosmolality overrode the inhibition of glymphatic transport that characterizes the awake state and reversed glymphatic suppression in a mouse model of Alzheimer's disease. Plasma hyperosmolality enhanced the delivery of an amyloid-β (Aβ) antibody, obtaining a 5-fold increase in antibody binding to Aβ plaques. Thus, manipulation of glymphatic activity may represent a novel strategy for improving penetration of therapeutic antibodies to the CNS.

Keywords: Alzheimer’s disease; Immunotherapy; Neuroimaging; Neuroscience; Therapeutics.


Conflict of interest statement

Conflict of interest: The authors have declared that no conflict of interest exists.

Figures

Figure 1
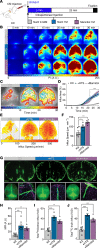
Figure 1. In vivo transcranial brain-wide imaging of CSF influx.
(A). Mice were imaged through an intact skull using a macroscope. (B) A fluorescent protein tracer (BSA-647 nm) was delivered into the cisterna magna (2 μl/min, 5 minutes) and tracer influx was imaged for 30 minutes from the start of the injection. All mice received i.p. isotonic saline at the onset of the intracisternal injection. (C) Representative time-lapse images of CSF influx over the first 30 minutes following tracer injection in anesthetized (KX) and awake wild-type mice as well as anesthetized Aqp4–/– mice (KX-Aqp4–/–). Images (8-bit pixel depth) are color coded to depict pixel intensity (PI) in arbitrary units (AU). Scale bar: 2 mm. Fluorescence was detected as early as 5 minutes after infusion at the base of the brain approximately 5-6 mm below the dorsal cortical surface. (D) Quantification of mean pixel intensity (MPI) for the 30-minute in vivo imaging series depicted in C (mean ± SEM; n = 5–7 mice/group; repeated-measures 2-way ANOVA, Sidak’s multiple comparisons test; *P < 0.05, **P < 0.01, ***P < 0.001, ****P < 0.0001 vs. KX). (E) Representative front-tracking analysis of CSF tracer influx over the imaging session. Fronts are time coded in minutes. (F) Quantification of the influx area over time from analysis E (mean ± SEM; n = 5–7 mice/group; repeated-measures 2-way ANOVA, Sidak’s multiple comparisons test; ****P < 0.0001 KX vs. awake and KX- Aqp4–/–). (G) Average influx speed maps (μm/min) generated from group data in C and E. (H) Representative conventional fluorescence images of brains ex vivo upon removal from the cranium (whole brains; scale bar: 2 mm) and after coronal sectioning to evaluate tracer penetrance deep into the cortical surface (coronal sections; scale bar: 1 mm) in the KX and awake wild-type and KX-anesthetized Aqp4–/– groups. High-magnification images of perivascular tracer were acquired using laser scanning confocal microscopy (immunohistochemical staining; scale bar: 50 μm). (I) Quantification of ex vivo coronal section fluorescence MPI for the KX and awake wild-type and KX-anesthetized Aqp4–/– groups (mean ± SEM; n = 3–8 mice/group; 1-way ANOVA, Tukey’s multiple comparisons test; *P < 0.05, **P < 0.01).
Figure 2
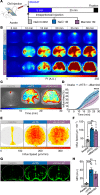
Figure 2. Plasma hypertonicity increases CSF influx in anesthetized mice.
(A) Fluorescent BSA-647 was delivered into the cisterna magna (CM) of anesthetized mice. Mice received isotonic saline (KX), hypertonic saline (+HTS), or hypertonic mannitol (+Mannitol) i.p. at the onset of the CM injection. (B) Representative time-lapse images of BSA-647 influx over the immediate 30 minutes following CM injection in the KX, +HTS, and +Mannitol groups. Images (8-bit pixel depth) are color coded to depict pixel intensity (PI) in arbitrary units (AU). Scale bar: 2 mm. (C) Representative front-tracking analysis of CSF tracer influx over the imaging session for all groups. Fronts are time coded in minutes. (D) Quantification of the influx area over time (mean ± SEM; n = 6–7 mice/group; repeated-measures 2-way ANOVA, Sidak’s multiple comparisons test; ****P < 0.0001 KX vs. +HTS and +Mannitol). (E) Tracer influx speed maps (μm/min) and (F) quantification of mean influx speeds for all groups (mean ± SEM; n = 6 mice/group; 1-way ANOVA, Tukey’s multiple comparisons test; *P < 0.05, ***P = 0.001). (G) Representative ex vivo conventional fluorescence images of intact brains upon removal from the cranium (scale bar: 2 mm) and after coronal sectioning (scale bar: 1 mm) from all groups. Coronal sections were imaged with high-powered confocal laser scanning microscopy to evaluate perivascular tracer (scale bar: 50 μm). (H) Quantification of ex vivo coronal section fluorescence MPI (mean ± SEM; n = 5–7 mice/group; 1-way ANOVA, Tukey’s multiple comparisons test; **P < 0.01, ***P = 0.003). Total brain uptake of CSF-delivered (I) 3H-dextran (40 kDa) or (J) 14C-inulin (6 kDa) in all 3 groups (mean ± SEM; n = 5 mice/group; 1-way ANOVA, Tukey’s multiple comparisons test; **P = 0.001, ***P = 0.0009, ****P < 0.0001) expressed as percentage injected dose (%ID). The KX data set is the same that is used in Figure 1.
Figure 3
Figure 3. Plasma hypertonicity overrides arousal state inhibition of glymphatic function.
(A) Head-plated, awake mice received intracisternal BSA-647. Mice received isotonic saline (Awake), hypertonic saline (+HTS), or hypertonic mannitol (+Mannitol) i.p. at the onset of the cisterna magna (CM) injection. (B) Representative time-lapse images of BSA-647 influx over the immediate 30 minutes following CM injection in the awake, +HTS, and +Mannitol groups. Images (8-bit pixel depth) are color coded to depict pixel intensity (PI) in arbitrary units (AU). Scale bar: 2 mm. Fluorescence was first detected at the base of the brain approximately 5–6 mm below the dorsal cortical surface. (C) Representative front-tracking analysis of CSF tracer influx over the imaging session for all groups. Fronts are time coded in minutes. (D) Quantification of the influx area over time (mean ± SEM; n = 5–7 mice/group; repeated-measures 2-way ANOVA, Sidak’s multiple comparisons test; ****P < 0.0001 Awake vs. +HTS and +Mannitol). (E) Tracer influx speed maps (μm/min) and (F) quantification of mean influx speeds for all groups (mean ± SEM; n = 5–7 mice/group; 1-way ANOVA, Tukey’s multiple comparisons test; **P = 0.0024, ***P = 0.0003). (G) Representative ex vivo coronal sections from all groups (scale bar: 1 mm). (H) Quantification of ex vivo coronal section fluorescence MPI (mean ± SEM; n = 5–6 mice/group; 1-way ANOVA, Tukey’s multiple comparisons test; **P = 0.0063, ***P = 0.003). The Awake data set is the same that is used in Figure 1.
Figure 4
Figure 4. Plasma hypertonicity improves the delivery of an Aβ antibody in 6-month-old APP/PS1 mice and enhances target engagement.
(A and B) Amyloid plaques were labeled 24 hours before with methoxy-X04 (MeX04). Mice were then anesthetized, and a fluorescent anti-Aβ antibody was injected intracisternally. Mice received either i.p. isotonic saline (Control) or hypertonic saline (+HTS) at the onset of the intracisternal infusion. After 120 minutes, mice were perfusion fixed with a fluorescent lectin to label the vasculature. (C) Representative ex vivo images of intact brains upon removal from the cranium (bottom left; scale bar: 2 mm) and after coronal sectioning to evaluate antibody penetrance into the brain (top; scale bar: 500 μm). Confocal images of the antibody and Aβ plaques (arrowheads) surrounding the perivascular spaces of penetrating arteries (bottom right; scale bar: 100 μm). (D) Quantification of ex vivo coronal section Aβ antibody fluorescence MPI (mean ± SEM; n = 5 mice/group; unpaired 2-tailed t test; **P = 0.0039). (E) Representative high-magnification confocal images of perivascular Aβ plaques (scale bar: 20μm). (F) Percentage of target engagement shown by colabeling of the antibody with MeX04+ Aβ plaques (mean ± SEM; n = 5 mice/group; unpaired t test; **P = 0.005). (G) Nearest neighbor analysis of the average distance of a colabeled plaque from its nearest perivascular space (PVS) in μm (mean ± SEM; total number of colabeled plaques/number of mice in group; unpaired t test; ****P < 0.0001). (H) Histogram and cumulative frequency plot of the number of colabeled plaques and distance from the nearest PVS. (I) Representative high-magnification confocal image with orthogonal views showing the anti-Aβ antibody engaging the surface of a plaque (arrows). Scale bar: 20 μm. (J) Three-dimensional reconstruction of Aβ plaques from an +HTS-treated mouse showing antibody targeting and engaging plaque surface (scale bar: 20 μm [both images]). (K) Plaque burden was the same between groups (mean ± SEM; n = 5 mice/group; unpaired t test; P = 0.6165).

References

    1. Sevigny J, et al. The antibody aducanumab reduces Aβ plaques in Alzheimer’s disease. Nature. 2016;537(7618):50–56. doi: 10.1038/nature19323. - DOI - PubMed
    1. Schenk DB, et al. First-in-human assessment of PRX002, an anti-α-synuclein monoclonal antibody, in healthy volunteers. Mov Disord. 2017;32(2):211–218. doi: 10.1002/mds.26878. - DOI - PMC - PubMed
    1. Gros-Louis F, Soucy G, Larivière R, Julien JP. Intracerebroventricular infusion of monoclonal antibody or its derived Fab fragment against misfolded forms of SOD1 mutant delays mortality in a mouse model of ALS. J Neurochem. 2010;113(5):1188–1199. - PubMed
    1. Gallardo G, Holtzman DM. Antibody therapeutics targeting Aβ and Tau. Cold Spring Harb Perspect Med. 2017;7:a024331. - PMC - PubMed
    1. Sampson JH, Maus MV, June CH. Immunotherapy for brain tumors. J Clin Oncol. 2017;35(21):2450–2456. doi: 10.1200/JCO.2017.72.8089. - DOI - PubMed

Publication types

MeSH terms