. 2018 Oct 17;9(11):1058.
doi: 10.1038/s41419-018-1076-x.

Transgenic overexpression of furin increases epileptic susceptibility

Affiliations

Transgenic overexpression of furin increases epileptic susceptibility

Yi Yang et al. Cell Death Dis. .

Abstract

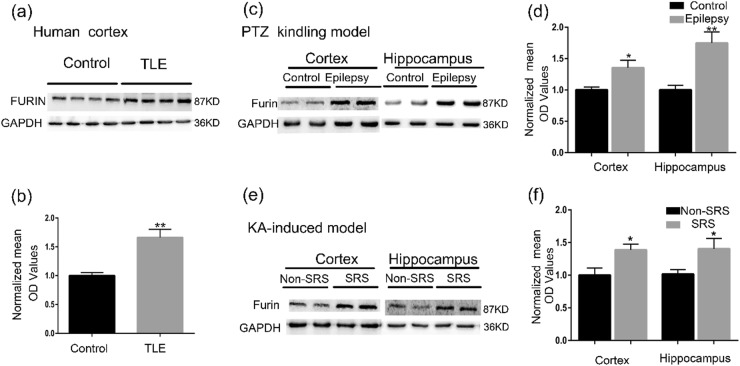
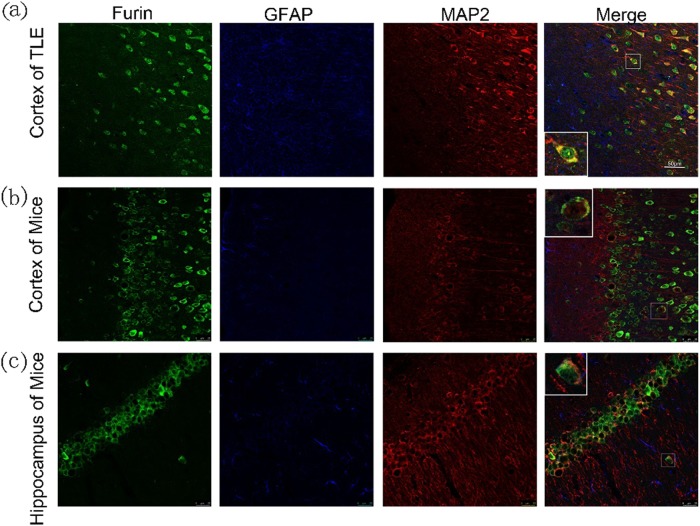
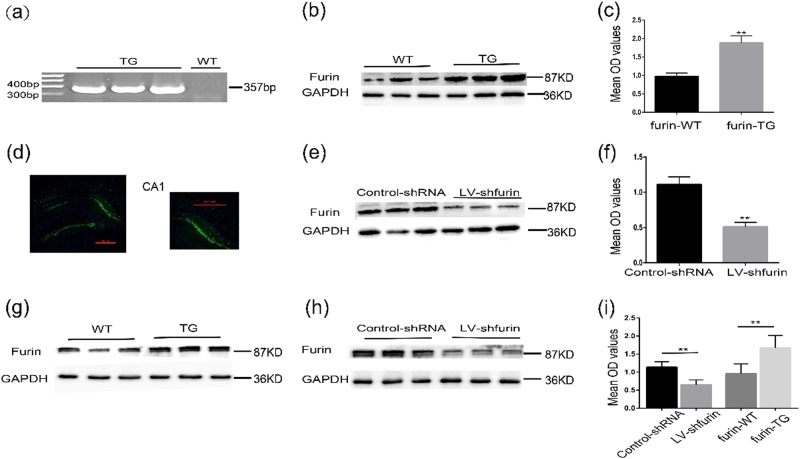
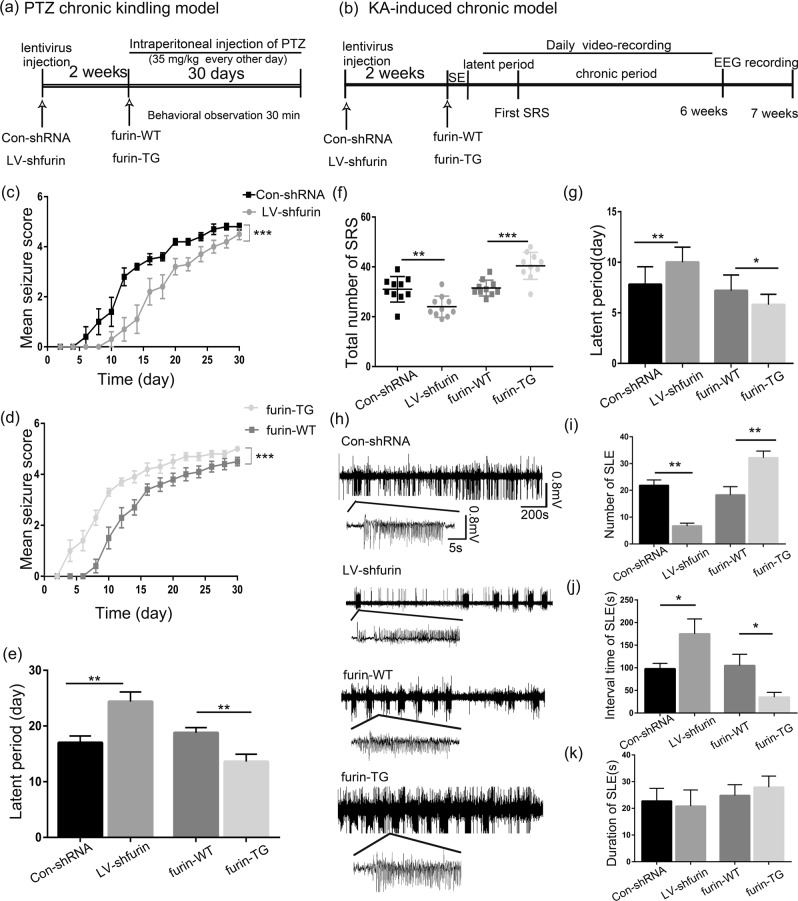
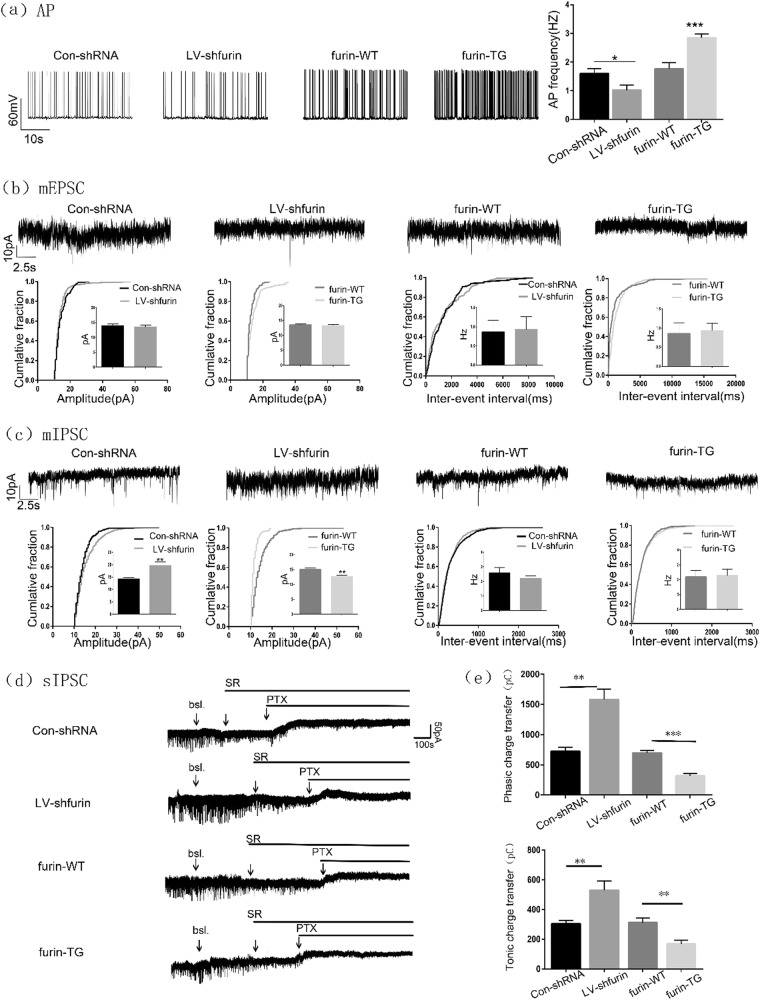
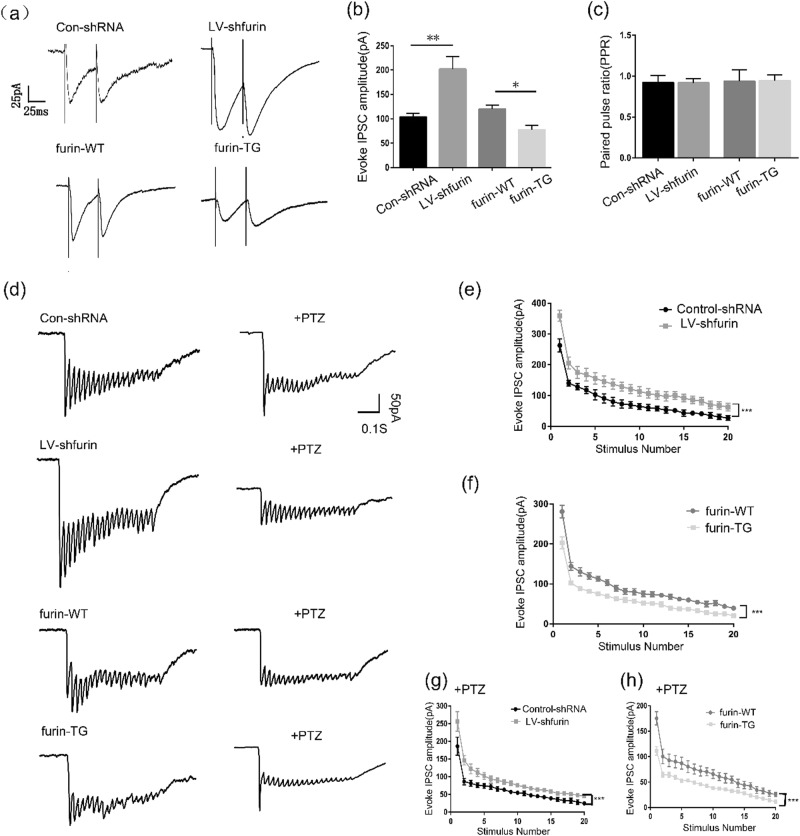
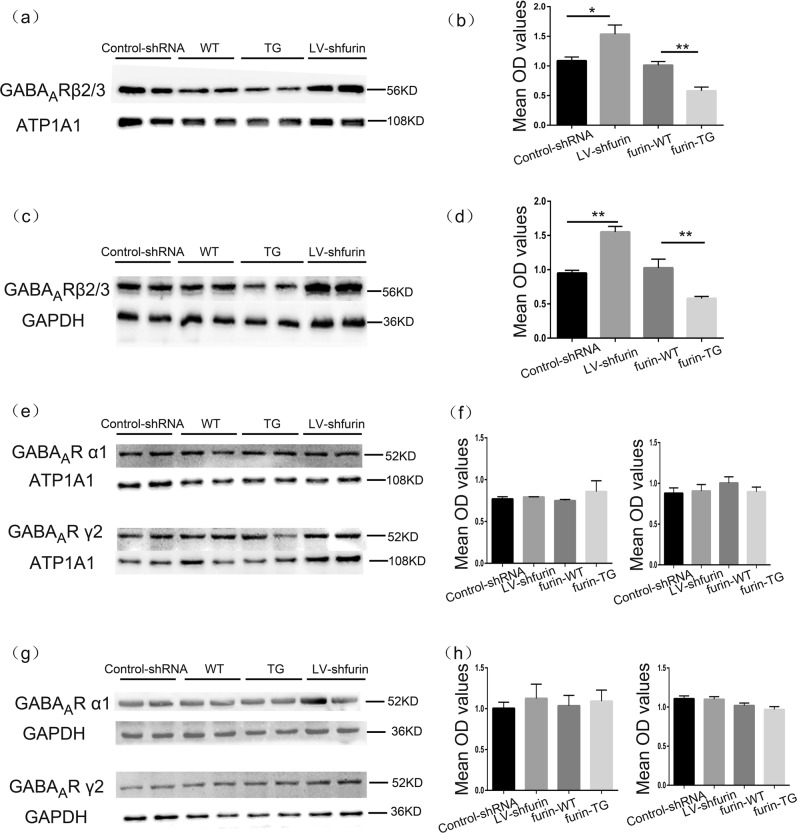
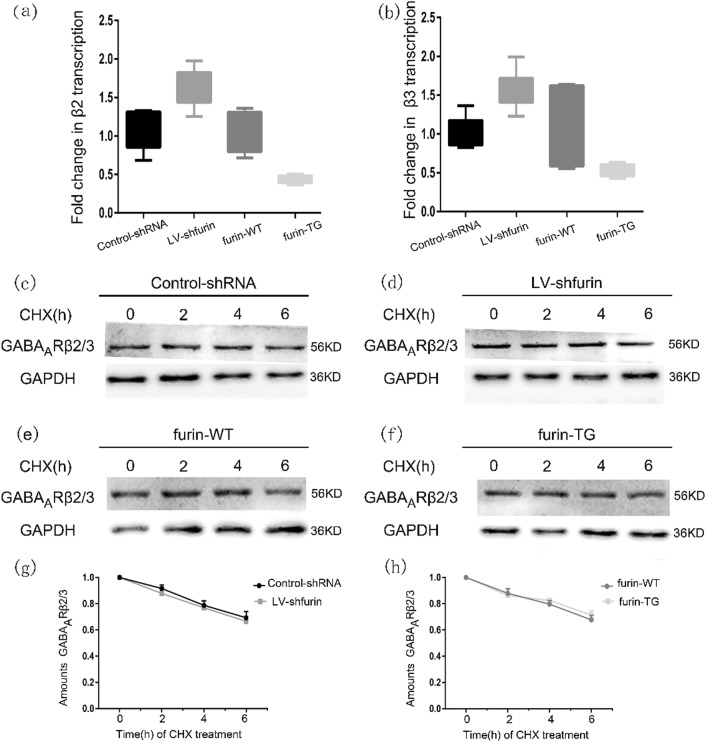
The proprotein convertase Furin plays crucial roles in the pathology of many diseases. However, the specific role of furin in epilepsy remains unclear. In our study, furin protein was increased in the temporal neocortex of epileptic patients and in the hippocampus and cortex of epileptic mice. The furin transgenic (TG) mice showed increased susceptibility to epilepsy and heightened epileptic activity compared with wild-type (WT) mice. Conversely, lentivirus-mediated knockdown of furin restrained epileptic activity. Using whole-cell patch clamp, furin knockdown and overexpression influenced neuronal inhibitory by regulating postsynaptic gamma-aminobutyric acid A receptor (GABAAR)-mediated synaptic transmission. Importantly, furin influenced the expression of GABAAR β2/3 membrane and total protein in epileptic mice by changing transcription level of GABAAR β2/3, not the protein degradation. These results reveal that furin may regulate GABAAR-mediated inhibitory synaptic transmission by altering the transcription of GABAAR β2/3 subunits in epilepsy; this finding could provide new insight into epilepsy prevention and treatment.


Conflict of interest statement

The authors declare that they have no conflict of interest.

Figures

Fig. 1
Fig. 1. Expression of furin in brain tissues from patients with TLE and from epileptic mice.
a, b Western blots demonstrated that furin protein levels were increased in the temporal neocortex of TLE patients (n = 20) compared with that of control patients (n = 10). In the PTZ-kindled epilepsy model (c, d) and the KA-induced epilepsy model (e, f) furin protein was expressed at higher levels in the cortex and hippocampus of epileptic mice than in those of control mice (n = 8 in each group,*P < 0.05, **P < 0.01). Means ± S.E.M. Student’s t-tests were performed
Fig. 2
Fig. 2. Cellular localization of furin in brain tissues from patients with TLE and from epileptic mice.
a Immunofluorescence staining demonstrated that FURIN co-localized with the neuronal dendrite marker MAP2, while co-localization of FURIN and the glial cell marker GFAP was not detected in the cortex of TLE patients. The temporal cortex b and hippocampal CA1 region (c) of epileptic mice corroborated these results.Scale bar: 50 μm
Fig. 3
Fig. 3. Overexpression and knockdown of furin in mice.
a Germline transmission of the transgene was verified by PCR analysis of tail DNA using transgene-specific primers. TG mice (357 bp fragment), WT mice (free fragment). b, c Western blot analysis demonstrated that the protein expression of furin was significantly higher in the TG group than in the WT group (n = 5 in each group, **P < 0.01). d Fluorescence staining images showing the transfection of LV-shRNA into the mouse hippocampus. Scale bar: 500 μm. e, f Western blot analysis demonstrated that the expression of furin protein was significantly lower in the LV-sh-furin group than in the control group (n = 5 in each group, **P < 0.01). g–i Six weeks after the injection of lentiviral vectors, the level of furin protein in the hippocampus was analyzed by Western blot (n = 6 in each group, **P < 0.01). Means ± S.E.M. Student’s t-tests were performed
Fig. 4
Fig. 4. Effects of furin overexpression and inhibition on behavior in chronic epilepsy models.
a, b The concrete steps of the behavioral experiment in the PTZ-kindled chronic epilepsy model and the KA-induced chronic epilepsy model. c, d Mean seizure scores of PTZ-kindled Con-shRNA, LV-sh-furin, WT, and TG mice over the course of the experiment. c Reduced seizure scores were noted in LV-sh-furin mice (F = 96.963, ***P < 0.001). d Increased seizure scores were noted in furin TG mice (F = 117.444, ***P < 0.001) (n = 10 in each group). Repeated measures ANOVA was performed. e The latency of epileptic seizures was longer in the LV-sh-furin group than in the Con-shRNA group and significantly shorter in the TG group than in the WT group (n = 9 or n = 10 in each group, **P < 0.01). f, g In the KA-induced epilepsy model, TG mice showed more frequent SRSs than WT mice, and the latency of SRSs was significantly shorter in the epileptic model than in the WT mice. By contrast, mice injected with LV-sh-furin showed less frequent SRSs than the Con-shRNA group, and the latency of SRSs was significantly longer in TG mice than in Con-shRNA mice (n = 9 or n = 10 in each group,*P < 0.05, ***P < 0.001). h Representative traces of EEG in vivo multichannel electrophysiological recordings from each group. i The TG mice showed greater numbers of SLEs than the WT mice, and j the interval time between SLEs was shorter in TG mice than in WT mice. The LV-sh-furin group and the Con-shRNA group showed opposite results (n = 7 in each group, *P < 0.05, **P < 0.01). k There was no significant difference in SLE duration between the TG and WT mice, and the LV-sh-furin and Con-shRNA groups showed the same result (P > 0.05). Student’s t-tests were performed. The data are expressed as Means ± S.E.M
Fig. 5
Fig. 5. Results of patch clamp recording.
a Representative traces of APs in the hippocampal CA1 region in each group. The TG mice showed an increase in AP frequency compared with WT mice, while LV-sh-furin infection resulted in a decrease in AP frequency compared with Con-shRNA (n = 6 in each group, *P < 0.05, ***P < 0.001). b Representative traces of mEPSCs in the hippocampal CA1 region of each group. There was no difference in the amplitude or frequency of mEPSCs between the TG or LV-sh-furin group and the corresponding control group (n = 6 or n = 8 in each group, P > 0.05). c Representative traces of mIPSCs in the hippocampal CA1 region of each group. The mIPSCs amplitude was significantly decreased in the TG group but remarkably increased in the LV-sh-furin group (n = 7 in each group, **P < 0.01).There was no difference in the frequency of mIPSCs between these 2 groups (n = 6 or n = 8 in each group, P > 0.05). d Representative traces of sIPSCs in the hippocampal CA1 region of each group. All traces marked “+SR” showed the changes of phasic charge transfer and traces marked “+PTX” showed the changes of tonic charge transfer. e The amount of phasic charge transfer was significantly decreased in the TG group but remarkably increased in the LV-sh-furin group. The amount of tonic charge transfer has the same changes (n = 6 in each group, **P < 0.01). Student’s t-tests were performed. The data are expressed as Means ± S.E.M
Fig. 6
Fig. 6. Furin affects GABA transmission through postsynaptic mechanism.
a Representative traces of the PPR in the hippocampal CA1 region of each group. b The first eIPSC amplitude was significantly decreased in the TG group but increased in the LV-sh-furin group (n = 6 in each group, *P < 0.05, **P < 0.01). c There was no difference in PPR between the TG or LV-sh-furin group and the corresponding control group (n = 6 in each group, P > 0.05). d Representative traces of train evoked IPSCs in the hippocampal CA1 region of each group. The response amplitude decreased with the increase of the number of stimuli. e The higher amplitudes were noted in LV-sh-furin group than in the control-shRNA group at every stimulus (n = 6 in each group, rm-ANOVA, F = 136.901, ***P < 0.001). f The lower amplitudes were noted in the TG group than in the WT group at every stimulus (n = 6 in each group, F = 128.772, ***P < 0.001). g, h PTZ application resulted in a decrease in amplitude of eIPSC. g The higher amplitudes were noted in LV-sh-furin group than in the control-shRNA group at every stimulus (n = 6 in each group, F = 68.397, ***P < 0.001). f The furin-TG group and furin-WT group showed opposite results (n = 6 in each group, F = 73.596, ***P < 0.001). The data are expressed as Means ± S.E.M
Fig. 7
Fig. 7. Furin affects the membrane expression and total protein expression of GABAAR β2/3.
a–d The expression levels of membrane/total GABAAR β2/3 were significantly lower in the TG-furin group and significantly higher in the LV-shRNA group than in the control group (a membrane protein, c total protein) (n = 6 in each group, *P < 0.05; **P < 0.01). e–h There were no significant differences in the level of total or membrane GABAAR α1 or γ2 between the TG or LV-sh-furin group and the corresponding control group (n = 6 in each group, P > 0.05). Student’s t-tests were performed. The data are expressed as Means ± S.E.M
Fig. 8
Fig. 8. Furin influences GABAAR β2/3 subunit gene expression in epileptic mice.
a, b Amounts of GABAARβ2/3 mRNA in the TG-furin and LV-sh-furin groups relative to the amounts in corresponding control group (n = 6 in each group).Fold change was expressed as 2-ΔΔCt. c–h A CHX-mediated protein degradation assay to estimate the degradation rate of GABAAR β2/3 subunits. After CHX treatment for different lengths of time (0, 2, 4, and 6 h), Western blot analysis was used to measure protein levels. The degradation rates of GABAAR β2/3 proteins in the cell lysates during the CHX treatment did not significantly differ between the TG or LV-sh-furin groups and the corresponding control group (P > 0.05). Experiments were conducted in triplicate. The data are expressed as Means ± S.E.M

Similar articles

Cited by

References

    1. Thurman DJ, et al. Standards for epidemiologic studies and surveillance of epilepsy. Epilepsia. 2011;52(Suppl 7):2–26. doi: 10.1111/j.1528-1167.2011.03121.x. - DOI - PubMed
    1. Casillas-Espinosa PM, Powell KL, O’Brien TJ. Regulators of synaptic transmission: roles in the pathogenesis and treatment of epilepsy. Epilepsia. 2012;53(Suppl 9):41–58. doi: 10.1111/epi.12034. - DOI - PubMed
    1. Thomas G. Furin at the cutting edge: from protein traffic to embryogenesis and disease. Nat. Rev. Mol. Cell Biol. 2002;3:753–766. doi: 10.1038/nrm934. - DOI - PMC - PubMed
    1. Krysan DJ, Rockwell NC, Fuller RS. Quantitative characterization of furin specificity. Energetics of substrate discrimination using an internally consistent set of hexapeptidyl methylcoumarinamides. J. Biol. Chem. 1999;274:23229–23234. doi: 10.1074/jbc.274.33.23229. - DOI - PubMed
    1. Jackson RS, et al. Obesity and impaired prohormone processing associated with mutations in the human prohormone convertase 1 gene. Nat. Genet. 1997;16:303–306. doi: 10.1038/ng0797-303. - DOI - PubMed

Publication types

MeSH terms