. 2018 Oct 17;9(1):4307.
doi: 10.1038/s41467-018-06500-x.

DRUG-seq for miniaturized high-throughput transcriptome profiling in drug discovery

Affiliations

DRUG-seq for miniaturized high-throughput transcriptome profiling in drug discovery

Chaoyang Ye et al. Nat Commun. .

Abstract

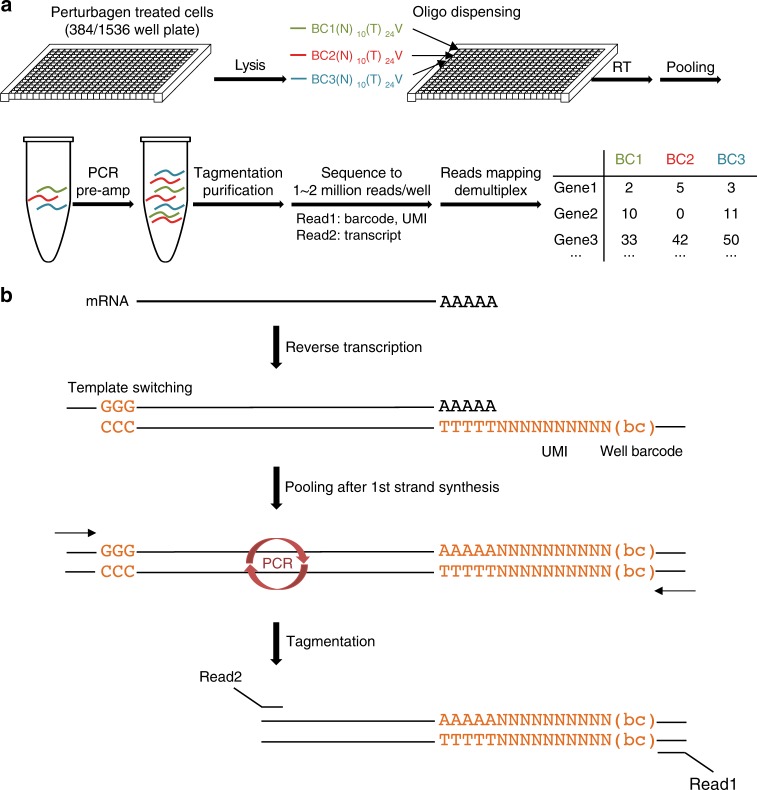
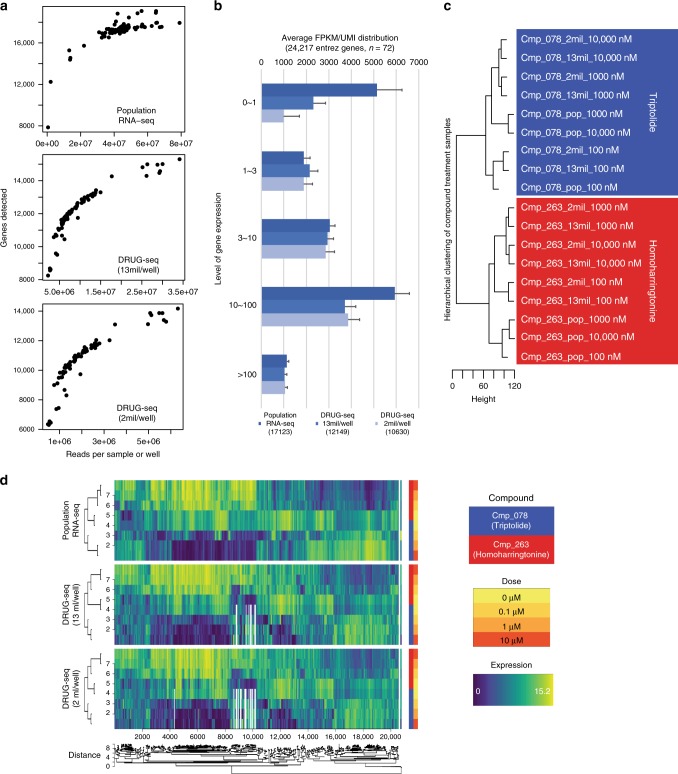
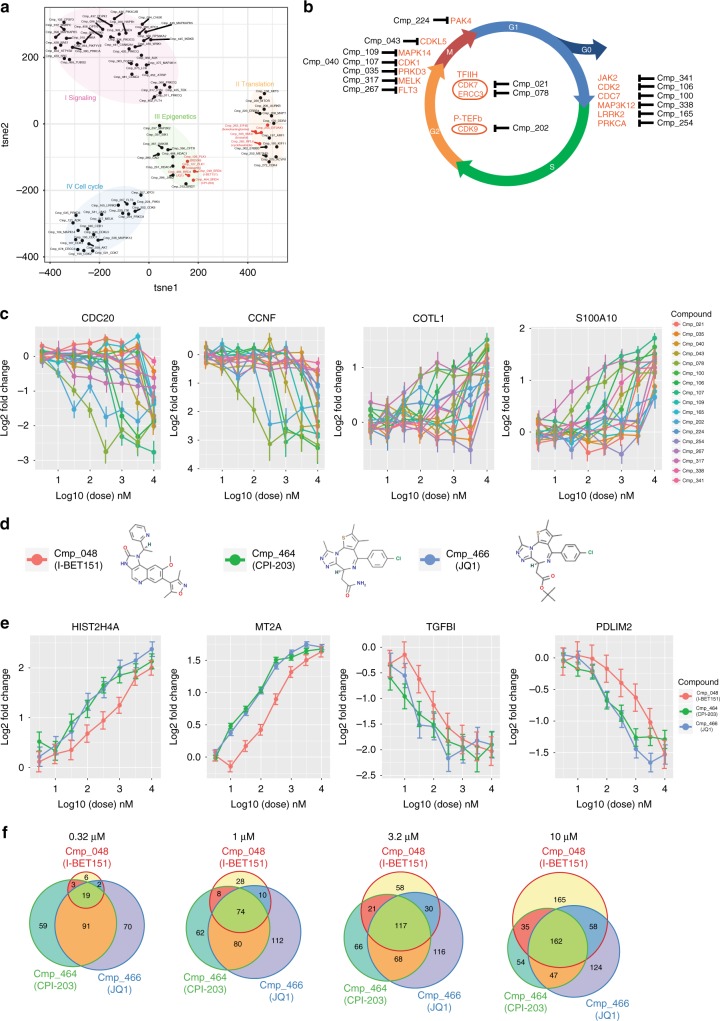
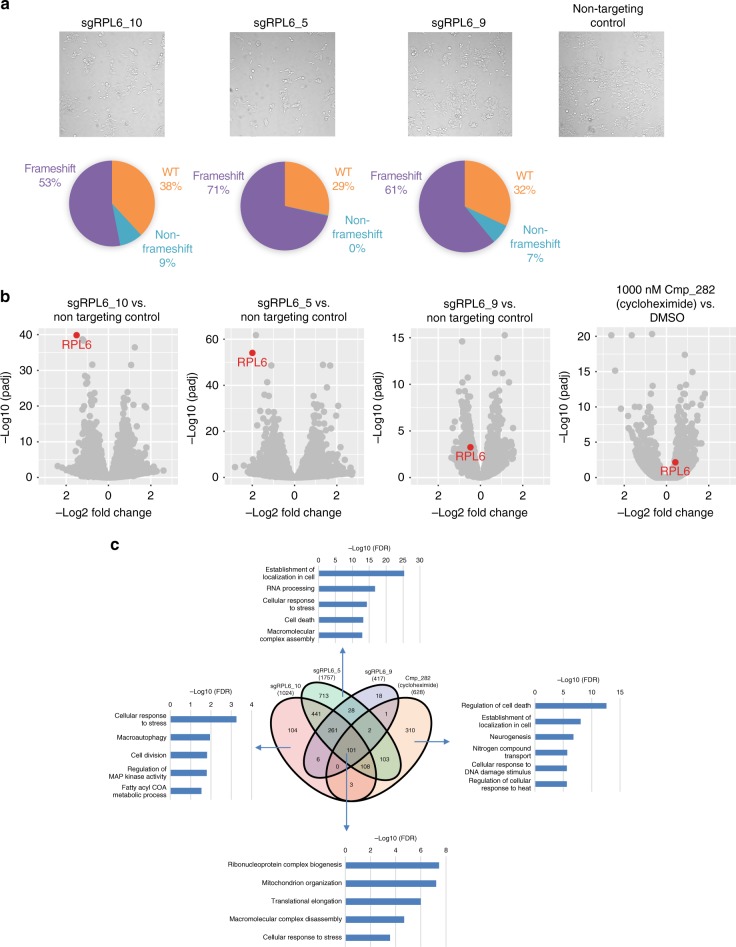
Here we report Digital RNA with pertUrbation of Genes (DRUG-seq), a high-throughput platform for drug discovery. Pharmaceutical discovery relies on high-throughput screening, yet current platforms have limited readouts. RNA-seq is a powerful tool to investigate drug effects using transcriptome changes as a proxy, yet standard library construction is costly. DRUG-seq captures transcriptional changes detected in standard RNA-seq at 1/100th the cost. In proof-of-concept experiments profiling 433 compounds across 8 doses, transcription profiles generated from DRUG-seq successfully grouped compounds into functional clusters by mechanism of actions (MoAs) based on their intended targets. Perturbation differences reflected in transcriptome changes were detected for compounds engaging the same target, demonstrating the value of using DRUG-seq for understanding on and off-target activities. We demonstrate DRUG-seq captures common mechanisms, as well as differences between compound treatment and CRISPR on the same target. DRUG-seq provides a powerful tool for comprehensive transcriptome readout in a high-throughput screening environment.


Conflict of interest statement

The authors declare no competing interests.

Figures

Fig. 1
Fig. 1
DRUG-seq overview. a DRUG-seq workflow. See details in Methods. Following compound treatment, cell lysis and RT reaction assembly are carried out with automation. Incubation steps are carried out in 384-well thermocyclers (Biorad C1000 Touch). All sequencing reaction was performed on Illumina Hiseq 4000 or Nextseq 500 platforms. b DRUG-seq chemistry. After cell lysis, mRNAs are directly reverse transcribed by a modified poly(dT) primer, which contains a well position specific 10mer barcode and a random 10mer sequence as unique molecular index (UMI). Template switching activity of the RT enzyme adds oligo(dC) to the first-strand cDNA, which allows binding of the template switching oligo (TSO). Samples are pooled after the RT and template switching. After pre-amplification and tagmentation, paired end libraries are sequenced to identify well position, UMI and transcript information
Fig. 2
Fig. 2
DRUG-seq performance is on par to standard population RNA-seq. a Gene detection distribution in population RNA-seq and DRUG-seq sequenced at 13 mil/well and 2 mil reads/well. b Gene detection comparison between population RNA-seq, DRUG-seq sequenced at 13 mil/well and 2 mil reads/well. Mean number of genes detected with standard deviation was broken down into different levels, n = 72 for each platform and read depth. c Differential gene expression detected by population RNA-seq and DRUG-seq both distinctively cluster samples treated with different compounds. Pop: population RNA-seq. 13 mil: DRUG-seq sequenced average at 13 mil reads/well. 2 mil: DRUG-seq sequenced at 2 mil reads/well. d Compound impact on differential gene expression is captured by both population RNA-seq and DRUG-seq in dose-dependent manner in meta-hierarchical clustering. The dendrogram located under the heatmaps represent the average correlation between clusters of the tree branch. See details in Methods
Fig. 3
Fig. 3
DRUG-seq profiling of compounds produces mechanistic insights. a tSNE clustering using 4289 dysregulated genes under compound treatment at 10 μM. Each compound and its target are labeled and closely clustered compounds with labeled common mechanisms are grouped by colors. b Compounds in cluster IV arranged based on the functions of their targets during cell cycle. CDK7 and ERCC3, being part of TFIIH complex, are involved in DNA repair. CDK9 is the catalytic subunit of transcription elongation complex P-TEFb c Dose-dependent gene expression changes under the treatment of compounds in b. Mean gene expression level and standard deviation (n = 3) for each compound and dose combination represented. d Structure of 3 compounds targeting Brd4. e Dose-dependent gene expression changes under the treatment of Brd4 compounds. Mean gene expression level and standard deviation (n = 3) for each compound and dose combination represented. f Venn diagram of the number of dysregulated genes under increasing dose by Brd4 compounds
Fig. 4
Fig. 4
CRISPR KO results compared with compound treatment of the same target. a Upper: CRISPR knockout of RPL6 reduced confluency. Lower: Indel type breakdown of specific guide RNA treatment from average of 4 samples. b Differential gene expression analysis of RPL6 CRISPR knockouts and 1 μM Cmp_282 (cycloheximide) treatment targeting RPL6. Target gene RPL6 is highlighted in red. n = 4 for CRISPR samples and n = 3 for compound treatment samples. c Venn diagram of the number of differentially expressed genes in CRISPR knockouts and under 1 μM Cmp_282 (cycloheximide) treatment, and GSEA analysis of 101 core genes impacted in all CRISPR knockouts as well as Cmp_282 (cycloheximide) treatment, and CRISPR/compound treatment specific GSEA categories. Selected GSEA categories are each represented with –log10(FDR) value

Similar articles

Cited by

References

    1. Macarron R, et al. Impact of high-throughput screening in biomedical research. Nat. Rev. Drug. Discov. 2011;10:188–195. doi: 10.1038/nrd3368. - DOI - PubMed
    1. Moffat JG, et al. Opportunities and challenges in phenotypic drug discovery: an industry perspective. Nat. Rev. Drug. Discov. 2017;16:531–543. doi: 10.1038/nrd.2017.111. - DOI - PubMed
    1. Li Hairi, Qiu Jinsong, Fu Xiang-Dong. RASL-seq for Massively Parallel and Quantitative Analysis of Gene Expression. Current Protocols in Molecular Biology. 2012;98(1):4.13.1-4.13.9. doi: 10.1002/0471142727.mb0413s98. - DOI - PMC - PubMed
    1. Lamb J, et al. The connectivity map: using gene-expression signatures to connect small molecules, genes, and disease. Science. 2006;313:1929. doi: 10.1126/science.1132939. - DOI - PubMed
    1. Subramanian A, et al. A next generation connectivity map: L1000 platform and the first 1,000,000 profiles. Cell. 2017;171:1437–1452. doi: 10.1016/j.cell.2017.10.049. - DOI - PMC - PubMed

Publication types

MeSH terms