. 2018 Oct 17;9(1):4321.
doi: 10.1038/s41467-018-06655-7.

Nanoscale metal-organic frameworks for mitochondria-targeted radiotherapy-radiodynamic therapy

Affiliations

Nanoscale metal-organic frameworks for mitochondria-targeted radiotherapy-radiodynamic therapy

Kaiyuan Ni et al. Nat Commun. .

Abstract

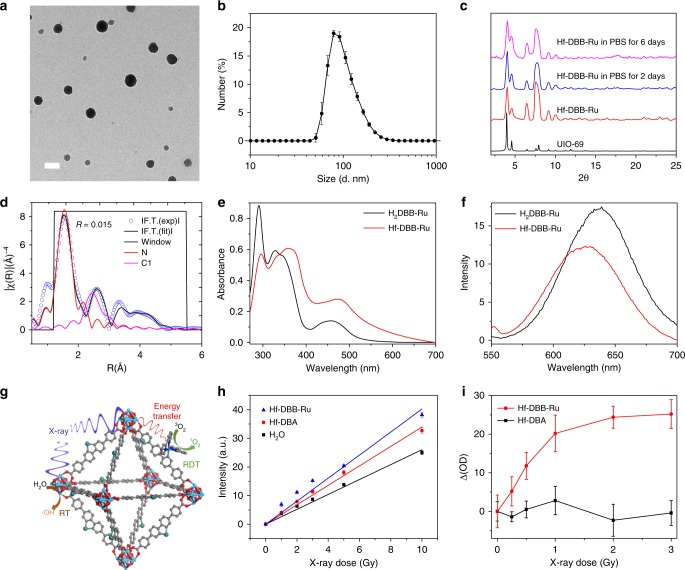
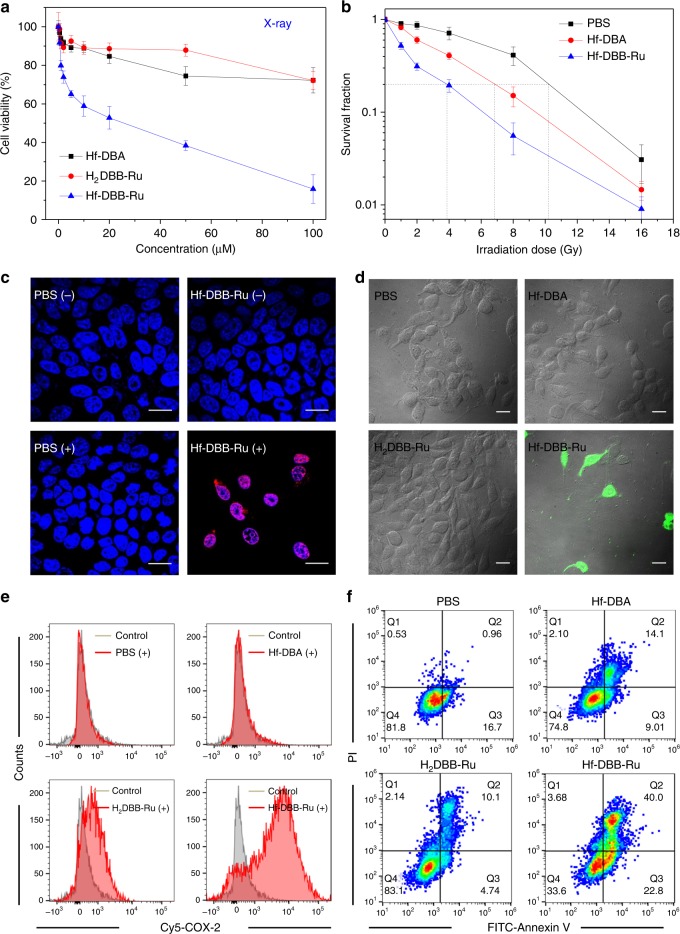
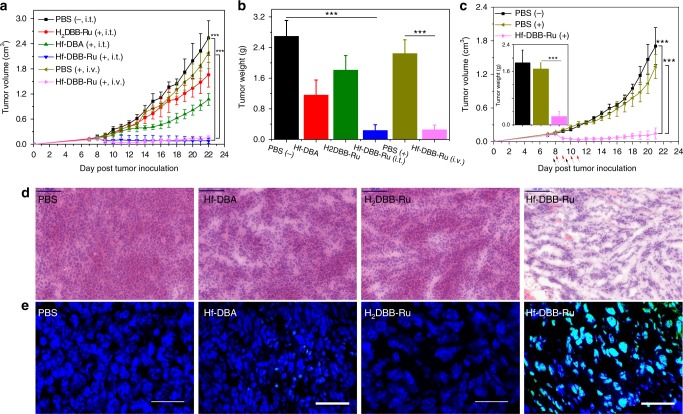
Selective delivery of photosensitizers to mitochondria of cancer cells can enhance the efficacy of photodynamic therapy (PDT). Though cationic Ru-based photosensitizers accumulate in mitochondria, they require excitation with less penetrating short-wavelength photons, limiting their application in PDT. We recently discovered X-ray based cancer therapy by nanoscale metal-organic frameworks (nMOFs) via enhancing radiotherapy (RT) and enabling radiodynamic therapy (RDT). Herein we report Hf-DBB-Ru as a mitochondria-targeted nMOF for RT-RDT. Constructed from Ru-based photosensitizers, the cationic framework exhibits strong mitochondria-targeting property. Upon X-ray irradiation, Hf-DBB-Ru efficiently generates hydroxyl radicals from the Hf6 SBUs and singlet oxygen from the DBB-Ru photosensitizers to lead to RT-RDT effects. Mitochondria-targeted RT-RDT depolarizes the mitochondrial membrane to initiate apoptosis of cancer cells, leading to significant regression of colorectal tumors in mouse models. Our work establishes an effective strategy to selectively target mitochondria with cationic nMOFs for enhanced cancer therapy via RT-RDT with low doses of deeply penetrating X-rays.


Conflict of interest statement

W.L. is founder of RiMO Therapeutics, which licensed the nMOF technology from the University of Chicago. The remaining authors declare no competing interests.

Figures

Fig. 1
Fig. 1
Characterization of Hf-DBB-Ru. a TEM image of Hf-DBB-Ru. b Number-averaged diameter of Hf-DBB-Ru in water by DLS measurements, n = 3. c PXRD patterns of Hf-DBB-Ru samples and UiO-69. Hf-DBB-Ru was freshly prepared or incubated in 0.6 mM PBS for 6 days. d EXAFS fitting of Hf-DBB-Ru. e UV-visible spectra of Hf-DBB-Ru and H2DBB-Ru. f Emission spectra of Hf-DBB-Ru and H2DBB-Ru with 450 nm excitation. g Schematic showing the RT and RDT process enabled by Hf-DBB-Ru. h APF fluorescence of Hf-DBB-Ru and Hf6-DBA at equivalent Hf concentrations of 20 µM and H2O upon X-ray irradiation, n = 6. i SOSG fluorescence of Hf-DBB-Ru and Hf6-DBA at equivalent Hf concentrations of 20 µM upon X-ray irradiation, n = 6. The error bars represent s.d. values. The TEM images were obtained with five repetitions to afford similar results
Fig. 2
Fig. 2
In vitro subcellular localization of Hf-DBA and Hf-DBB-Ru. a Time-dependent enrichment of Hf-DBA or Hf-DBB-Ru in mitochondria. Mitochondria were isolated from nMOF treated cells and the nMOF amounts were quantified by ICP-MS, n = 3. b Time-dependent Pearson’s correlation coefficients. Co-localization of Hf-DBA-R or Hf-DBB-Ru with mitochondria was analyzed based on fluorescence images captured at 1, 2, 4, and 8 h incubation. N = 3. Representative mitochondria co-localization images of ce Hf-DBA-R and fh Hf-DBB-Ru by CLSM. Scale bar = 5 µm. Mitochondria were labeled with Rhodamine 123 in green (d, g). Two nMOFs emitted magenta signal (c, f). White areas merged from the magenta and green signals represent co-localization of Hf-DBA-R or Hf-DBB-Ru with mitochondria. Fluorescence topographic profiles (i, j) display fluorescence intensity curves of straight white lines marked in e and h, respectively. The dots and error bars represent individual data points and s.d. values, respectively. The CLSM images were obtained with two repetitions to afford similar results
Fig. 3
Fig. 3
In vitro anti-cancer efficacy via RT-RDT. a Cytotoxicity of Hf-DBA, H2DBB-Ru, and Hf-DBB-Ru upon X-ray irradiation at a dose of 2 Gy in MC38 cells, n = 6. b Clonogenic assay for evaluating radioenhancement upon X-ray irradiation on MC38 cells, n = 6. c γ-H2AX assays showing DSBs in MC38 cells treated with Hf-DBB-Ru or PBS and X-ray irradiation, confirming the radioenhancing effect. Scale bar = 20 µm. (+) and (−) refer to with and without irradiation, respectively. d 1O2 generation was detected using SOSG in live cells by CLSM. Scale bar = 10 µm. e Quantification of COX-2 by flow cytometry. The cells were incubated with PBS, Hf-DBA, H2DBB-Ru, and Hf-DBB-Ru and irradiated with X-rays at a dose of 2 Gy. f Annexin V/PI analysis of MC38 cells. Cells were incubated with PBS, Hf-DBA, H2DBB-Ru, and Hf-DBB-Ru with and without X-ray irradiation at a dose of 2 Gy. The quadrants from lower left to upper left (counter clockwise) represent healthy, early apoptotic, late apoptotic, and necrotic cells, respectively. The percentage of cells in each quadrant is shown on the graphs. The error bars represent s.d. values. The flow cytometry studies were obtained with two repetitions to afford similar results
Fig. 4
Fig. 4
In vitro mechanistic studies of mitochondria-targeted RDT. a Fluorescence images of MC38 cells stained with JC-1 4 h after treatment of PBS, Hf-DBA, H2DBB-Ru and Hf-DBB-Ru with (2 Gy, + ) or without (-) X-ray irradiation. Green fluorescence indicates the depolarization of mitochondrial membrane potential. Scale bar = 50 µm. b Flow cytometric analysis of green versus red fluorescence of JC-1-stained MC38 cells 4 h after treatment of PBS and Hf-DBB-Ru with (2 Gy, + ) or without (-) X-ray irradiation. c cytochrome c released from mitochondria 8 h after treatment of PBS (left) or Hf-DBB-Ru (right) upon X-ray irradiation (2 Gy). Green: FITC-conjugated cytochrome c antibody; Red: Mitotracker CMXRos; Blue: DAPI. Scale bar = 10 µm. d Bcl-2 and Caspase-3 protein expression levels of MC38 cells 8 h after treatment of PBS, Hf-DBA, H2DBB-Ru and Hf-DBB-Ru upon X-ray irradiation (2 Gy). The glyceraldehyde 3-phosphate dehydrogenase (GAPDH) band served as loading control. The flow cytometry and CLSM studies were obtained with two repetitions to afford similar results
Fig. 5
Fig. 5
In vivo anti-cancer efficacy of mitochondria-targeted RDT. a Tumor growth inhibition/regression curves in MC38 tumor-bearing mice treated with PBS, Hf-DBA, DBB-Ru, or Hf-DBB-Ru by intratumoral (i.t.) injection with (+) or without (−) X-ray irradiation or Hf-DBB-Ru by intravenous (i.v.) injection followed by X-ray irradiation. n = 6. b Excised tumor weights on day 22. n = 6. c Tumor growth inhibition/regression curves in CT26 tumor-bearing mice treated with PBS with (+) or without (−) X-ray irradiation or i.v. injected with Hf-DBB-Ru followed by X-ray irradiation. Black arrows refer to i.v. injection of different treatments and red arrows refer to X-ray irradiation. Excised tumor weights on day 21 shown in the inset. n = 6. **P < 0.05, ***P < 0.001 from control by t-test. Representative (d) H&E histological staining and (e) TUNEL immunofluorescence staining of excised tumor slices for PBS, Hf-DBA, H2DBB-Ru, and Hf-DBB-Ru (i.t. injection) treatment groups (left to right), respectively. d H&E, scale bar = 100 μm. e TUNEL, scale bar = 50 μm. The error bars represent s.d. values. The in vivo confocal images were obtained without repetition
Fig. 6
Fig. 6
Mitochondria-targeted RT-RDT mediated by Hf-DBB-Ru. Hf-DBB-Ru was internalized by tumor cells efficiently and enriched in mitochondria due to dispersed cationic charges in the nMOF framework. Hf6 SBUs preferentially absorb X-rays over tissues to enhance RT by sensitizing hydroxyl radical generation and enable RDT by transferring energy to Ru(bpy)32+-based bridging ligands to generate singlet oxygen. The RT-RDT process trigger mitochondrial membrane potential depolarization, membrane integrity loss, respiratory chain inactivation, and cytochrome c release to initiate apoptosis of cancer cells

Similar articles

Cited by

References

    1. Castano AP, Mroz P, Hamblin MR. Photodynamic therapy and anti-tumour immunity. Nat. Rev. Cancer. 2006;6:535. doi: 10.1038/nrc1894. - DOI - PMC - PubMed
    1. Celli JP, et al. Imaging and photodynamic therapy: mechanisms, monitoring, and optimization. Chem. Rev. 2010;110:2795–2838. doi: 10.1021/cr900300p. - DOI - PMC - PubMed
    1. Lovell JF, et al. Porphysome nanovesicles generated by porphyrin bilayers for use as multimodal biophotonic contrast agents. Nat. Mater. 2011;10:324. doi: 10.1038/nmat2986. - DOI - PubMed
    1. Huang P, et al. Light‐triggered theranostics based on photosensitizer‐conjugated carbon dots for simultaneous enhanced‐fluorescence imaging and photodynamic therapy. Adv. Mater. 2012;24:5104–5110. doi: 10.1002/adma.201200650. - DOI - PMC - PubMed
    1. Agostinis P, et al. Photodynamic therapy of cancer: an update. CA Cancer J. Clin. 2011;61:250–281. doi: 10.3322/caac.20114. - DOI - PMC - PubMed

Publication types

MeSH terms

Substances