. 2018 Oct 17;9(1):4315.
doi: 10.1038/s41467-018-06860-4.

Targeting SPINK1 in the damaged tumour microenvironment alleviates therapeutic resistance

Affiliations

Targeting SPINK1 in the damaged tumour microenvironment alleviates therapeutic resistance

Fei Chen et al. Nat Commun. .

Abstract

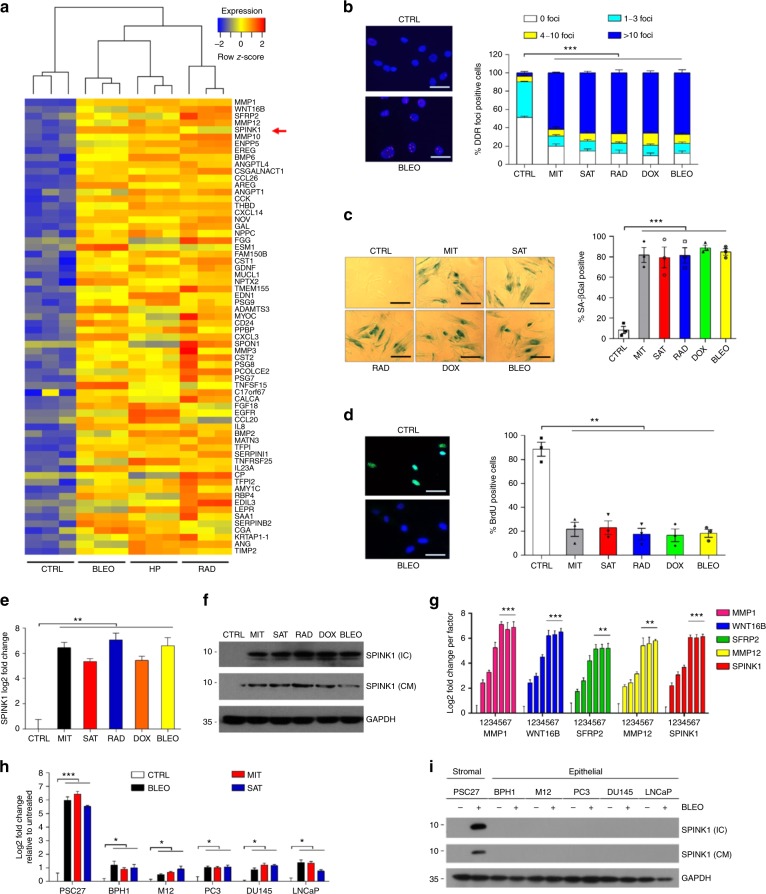
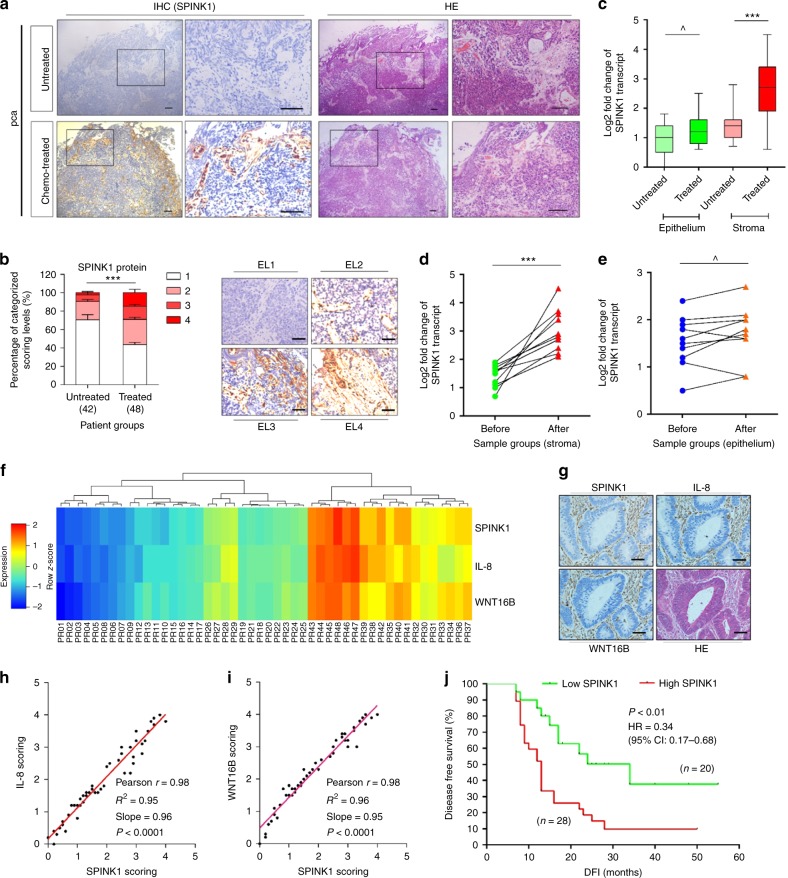
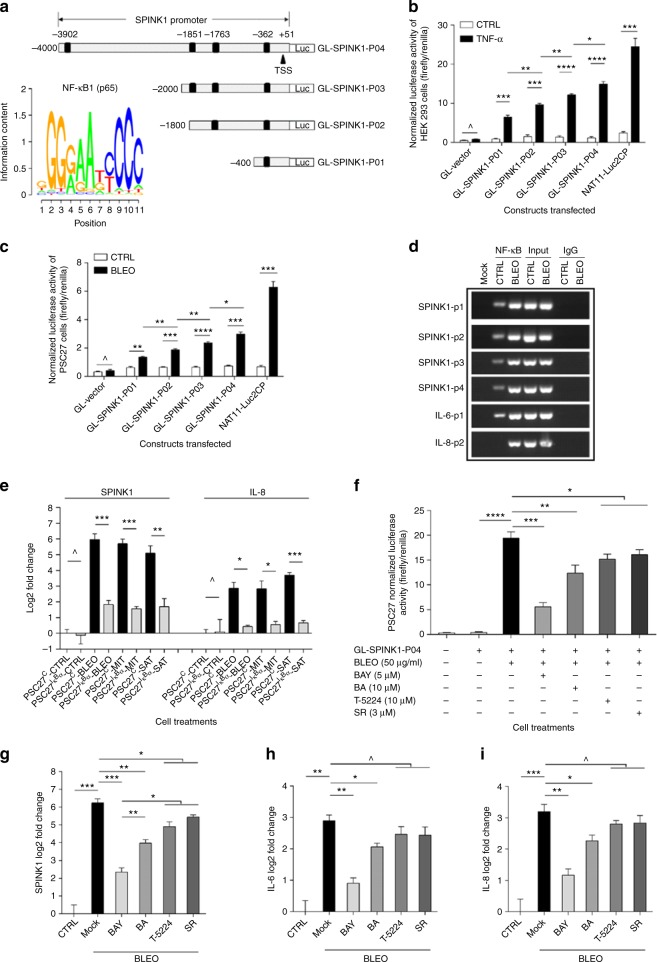
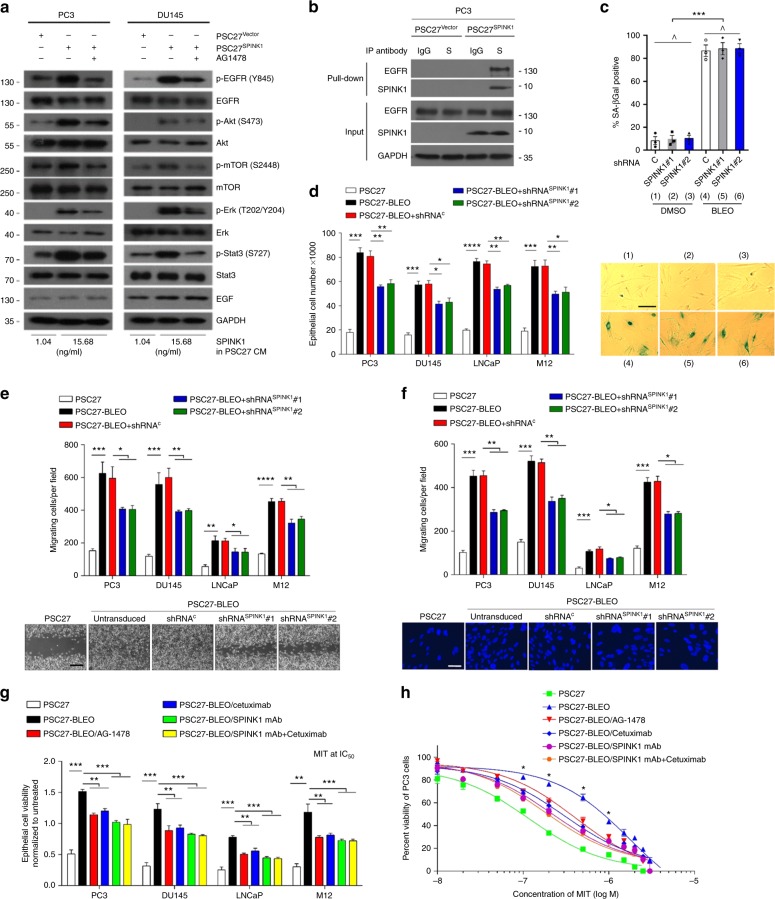
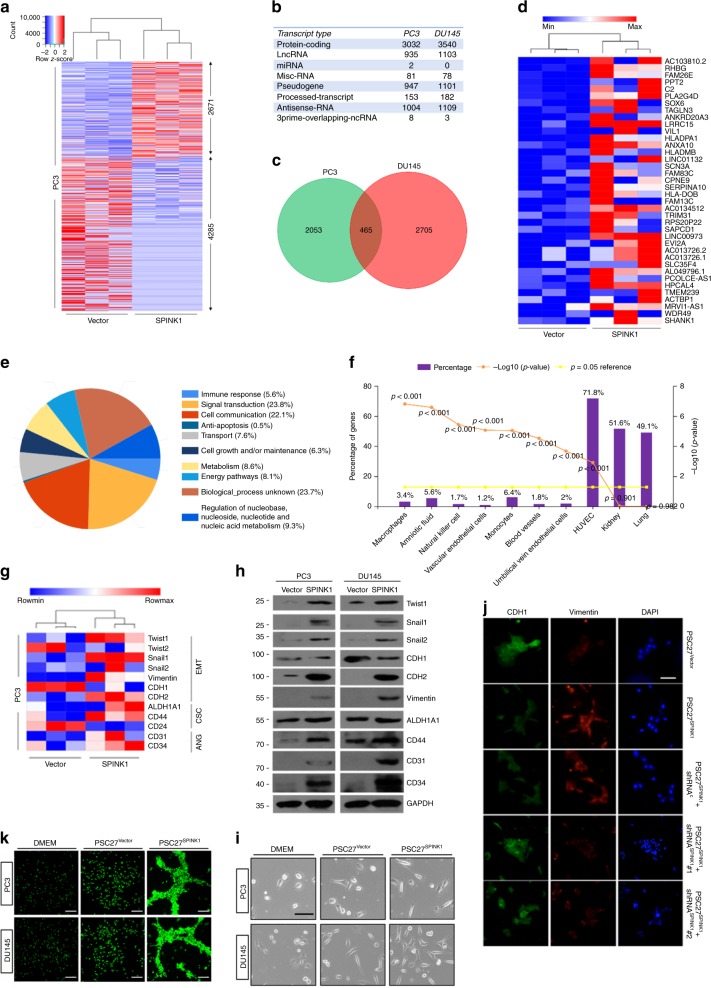
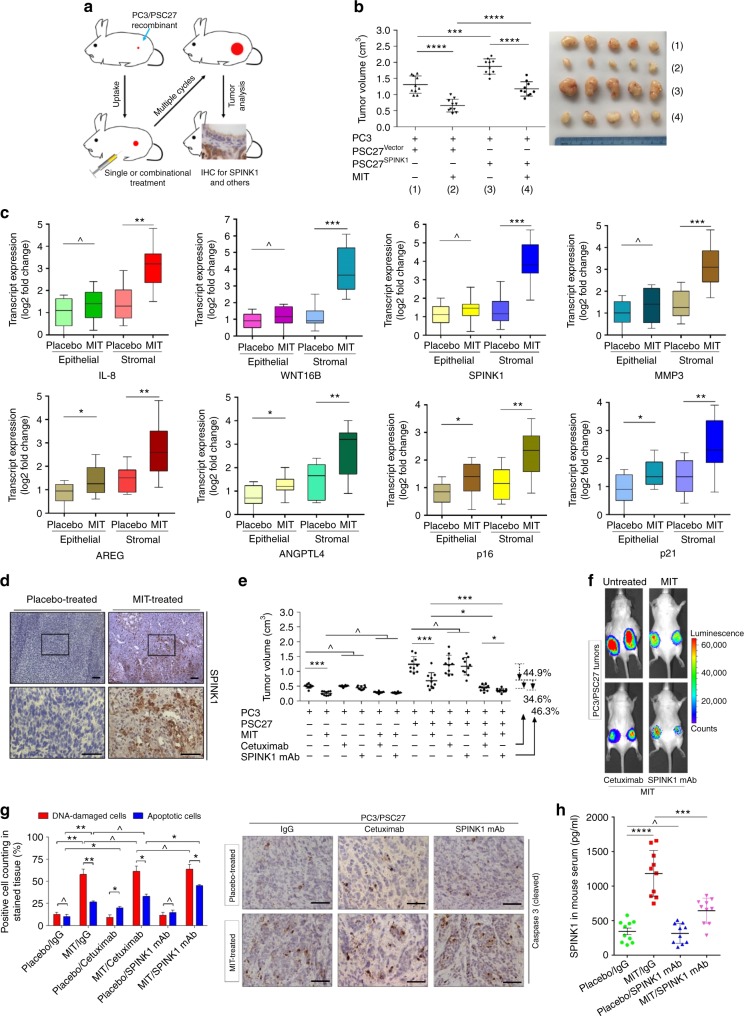
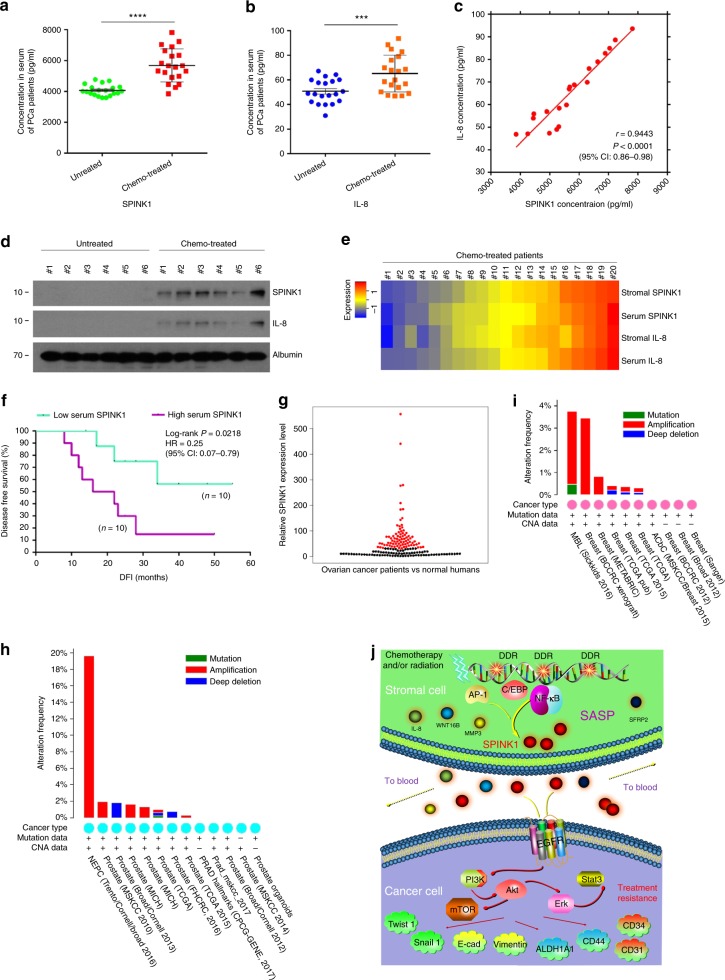
Chemotherapy and radiation not only trigger cancer cell apoptosis but also damage stromal cells in the tumour microenvironment (TME), inducing a senescence-associated secretory phenotype (SASP) characterized by chronic secretion of diverse soluble factors. Here we report serine protease inhibitor Kazal type I (SPINK1), a SASP factor produced in human stromal cells after genotoxic treatment. DNA damage causes SPINK1 expression by engaging NF-κB and C/EBP, while paracrine SPINK1 promotes cancer cell aggressiveness particularly chemoresistance. Strikingly, SPINK1 reprograms the expression profile of cancer cells, causing prominent epithelial-endothelial transition (EET), a phenotypic switch mediated by EGFR signaling but hitherto rarely reported for a SASP factor. In vivo, SPINK1 is expressed in the stroma of solid tumours and is routinely detectable in peripheral blood of cancer patients after chemotherapy. Our study substantiates SPINK1 as both a targetable SASP factor and a novel noninvasive biomarker of therapeutically damaged TME for disease control and clinical surveillance.


Conflict of interest statement

The authors declare no competing interests.

Figures

Fig. 1
Fig. 1
DNA damage to human stromal cells induces expression of secreted factors including SPINK1. a Transcriptome-wide profiling of gene expression changes in the primary normal human prostate stromal cell line (PSC27). Cell lysates were collected for analysis 7 days after treatment. CTRL control, BLEO bleomycin, HP hydrogen peroxide, RAD radiation. Red arrow, SPINK1. Agilent microarray data were adapted from Sun et al. with permission from Nature Medicine, copyright 2012. Genes with upregulation fold change >3.0 are listed. b Representative immunofluorescence staining images (γH2AX, left) and comparative statistics (right) of DNA damage foci (DDR) in PSC27 cells treated by MIT (mitoxantrone), SAT (satraplatin), RAD (radiation), DOX (doxorubicin), BLEO (bleomycin). DDR were classified into 4 sub-categories including 0, 1–3, 4–10, and >10 foci per cell. Scale bars, 15 μm. c SA-β-Gal staining of PSC27 cells 7 days after treatment by various agents used in (b). Scale bars, 15 μm. d BrdU staining of stromal cells treated by different agents used in (b). Scale bars, 20 μm. e Quantitative RT-PCR assay of SPINK1 expression 7 days after treatment by various agents. Signals normalized to CTRL (untreated). f Immunoblot analysis of SPINK1 expression in stromal cells 7 days after treatment as applied in (e). IC intracellular samples, CM conditioned media. GAPDH, loading control. g Time course expression assessment of a subset of typical SASP factors after treatment of stromal cells. X-axis, 1, 2, 3, 4, 5, 6, and 7 refer to experimental timepoints of 0, 1, 3, 5, 7, 10, and 15 day(s) post-treatment, respectively. Gene primers are listed in Supplementary Table 4. h Comparative appraisal of SPINK1 transcription in stromal cells (PSC27) versus transformed or neoplastic epithelial cells (BPH1, M12, PC3, DU145, and LNCaP). Signals normalized to CTRL (untreated sample) per cell line. i SPINK1 protein expression in stromal and epithelial cells after BLEO treatment. IC intracellular extracts, CM conditioned media. GAPDH, loading control. Data are shown as mean ± SD and representative of 3 independent experiments. P values were calculated by one-way (c, d, e, g, h) and two-way (b) ANOVA (^P > 0.05; *P < 0.05; **P < 0.01; ***P < 0.001)
Fig. 2
Fig. 2
SPINK1 expression in human prostate stroma after chemotherapy is correlated with poor clinical survival. a Histochemical images of SPINK1 expression in human prostate cancer (PCa) tissues. Rectangular regions in left images zoomed on the right, all samples acquired from the same patient. Scale bars, 100 μm. b Pathological assessment of stromal SPINK1 expression in PCa samples (42 versus 48). Scoring categories: 1, negative; 2, weak; 3, moderate; 4, strong expression. Left, statistical comparison. Right, representative images. ES expression level. Scale bars, 50 µm. c Boxplot summary of SPINK1 transcript expression in tumour and stroma. Signals normalized to the lowest value in the untreated epithelium group. Samples from 10 patients out of untreated and treated groups were randomly selected. d Comparative analysis of SPINK1 expression at transcription level between stromal cells collected before and after chemotherapy. Each dot represents an individual patient, with the data of “before” and “after” connected to allow direct assessment of SPINK1 induction in the same individual patient. e Comparative analysis of SPINK1 expression at transcription level in epithelial cells collected from the same individual patients as described in (d). f Pathological correlation between SPINK1, IL-8, and WNT16B in the stroma of 48 PCa patients after treatment. Columns represent individual patients, rows different SASP factors. Scores of each patient averaged from 3 independent pathological readings. g Representative images of SPINK1, IL-8, and WNT16B expression in the TME of post-treatment patients. Scale bars, 100 μm. h Statistical correlation between SPINK1 and IL-38 scores in the 48 tumours with matching protein expression data. i Statistical correlation between SPINK1 and WNT16B scores in the same tumours as described in (h). j Kaplan–Meier analysis. Disease-free survival (DFS) stratified according to SPINK1 expression. DFS represents the length (months) of period calculated from the date of treatment completion to the point of first time disease relapse. Data in plots are shown as mean ± SD and representative of 3 biological replicates. P values were calculated by Student’s t-test (ce), one-way ANOVA (b), and log-rank (Mantel–Cox) test (j) (^P > 0.05; ***P < 0.001). HR hazard ratio
Fig. 3
Fig. 3
DNA damage induces SPINK1 expression in stromal cells via NF-κB and C/EBP. a Schematic of putative NF-κB binding sites in the proximal region of SPINK1 promoter. Reporter constructs was generated by sequential cloning of promoter fragments into a pGL4.22 vector (pGL-SPINK1-P01 to P04) encoding firefly luciferase. TSS transcription start site. Lower-left inlet, consensus binding motif of the NF-κB subunit p65. b Luciferase activity assessment upon exposure of 293T cells pre-transfected with the individual SPINK1 promoter constructs to TNF-α at 20 ng/ml in culture. NAT11-Luc2CP, a construct encoding multiple copies of typical NF-κB binding sequences and an optimized IL-2 minimal promoter served as a positive control. c Luciferase activity assay with lysates of PSC27 cells pre-transfected with each of the constructs used in (b) prior to treatment by 50 μg/ml bleomycin (BLEO). d ChIP assay to identify potential NF-κB binding sites in the proximal promoter of SPINK1. Left, SPINK1-p1/p2/p3/p4 denotes 4 representative genomic sites in SPINK1 promoter region, selective NF-κB binding sites from IL-6 and IL-8 served as positive controls. e SPINK1 and IL-8 transcript expression in PSC27 cells stably expressing an NF-κB-null mutant and treated by BLEO, MIT, or SAT. f Construct pGL-SPINK1-P04 was transiently transfected into PSC27 cells before BLEO treatment. BAY (Bay 11-7982, 5 μM), BA (betulinic acid, 10 μM), T-5224 (10 μM) were applied as small molecule inhibitors against NF-κB, C/EBP family, and AP-1. SR (SR 11302, 3 μM) served as a positive control against AP-1. g PSC27 cells were treated in the same conditions as in (f), and subject to qRT-PCR analysis. SPINK1 expression was compared between CTRL (untreated), Mock (PBS-treated), BAY, BA, T-5224, and SR treatment groups. h Expression of IL-6 transcript in PSC27 cells treated as in (g). i Expression of IL-8 transcript in PSC27 cells treated as in (g). Data are mean ± SD and representative of 3 independent experiments. P values were calculated by Student’s t-test (b, c, ei) (^P > 0.05; *P < 0.05; **P < 0.01; ***P < 0.001; ****P < 0.0001)
Fig. 4
Fig. 4
Stromal SPINK1 significantly modifies prostate cancer cell phenotypes in vitro. a Immunoblot analysis of EGFR-associated pathways in PCa cells treated by PSC27 CM alone, or with the EGFR inhibitor AG-1478 (2 μM). Total protein per molecule and GAPDH were used as loading control. b Immunoprecipitation (IP) followed by immunoblot assay of EGFR and SPINK1 in the whole cell lysates of PC3 treated by the CM of PSC27 sublines for 3 days. S, SPINK1; GAPDH, loading control. c Scramble or SPINK1-specific shRNA-transduced PSC27 cells were treated with either DMSO or bleomycin (BLEO) and subject to SA-β-Gal assay. Upper, comparative statistics. Lower, representative images of SA-β-Gal staining. C, scramble. d Proliferation measurement of PCa cells treated with the CM of PSC27 sublines for 3 days. e Migration assay of PCa cells seeded within transwells in 6-well plates, with cells cultured for 3 days in PSC27 subline CM as indicated in (c). Bottom, representative images of PC3 cell migration measured via wound healing assay at 72 h. Scale bars, 100 μm. f Invasiveness appraisal of PCa cells across the transwell membrane upon culture with PSC27 subline CM. Bottom, representative images of PC3 cell invasion across the transwell measured at 72 h. Scale bars, 20 μm. g Chemoresistance assay of PCa cells cultured with PSC27 subline CM. MIT (mitoxantrone) was applied at the concentration of IC50 value pre-determined per cell line. AG-1478 (2 μM), cetuximab (50 μg/ml), or SPINK1 mAb (1 μg/ml) were applied alongside with PSC27 CM. h Dose–response curves (non-linear regression/curve fit) of PC3 cells cultured with PSC27 CM and concurrently treated by a wide range of concentrations MIT. AG-1478 (2 μM), cetuximab (50 μg/ml), and/or SPINK1 mAb (1 μg/ml) were applied with PSC27 CM. Data are mean ± SD and representative of 3 independent experiments, with 3 technical replicates run per cell-based experiment. P values were calculated by Student’s t-test (dh) and one-way ANOVA (c) (^P > 0.05; *P < 0.05; **P < 0.01; ***P < 0.001)
Fig. 5
Fig. 5
SPINK1 induces profound reprogramming of cancer cell expression and causes phenotypic alteration. a Heatmap depicting differentially expressed transcripts in PC3 cells after a 3-day culture with SPINK1+ CM from PSC27 cells. Contrasting the control group (vector), 2671 and 4285 genes were upregulated and downregulated, respectively, in cells treated with PSC27SPINK1 CM. b Statistics of transcripts differentially expressed (fold change either ≥2 or ≤0.5, with p < 0.05) in PC3 and DU145 cells upon SPINK stimulation, and classified into typical categories according to functional annotations mapped by Genecode (V27). c Venn diagram indicating the overlap of 465 transcripts upregulated in PCa cells upon treatment with SPINK1+ CM from PSC27 (2518 and 3170 genes with unique annotations for PC3 and DU145, respectively). d Heatmap showing the top 38 upregulated transcripts by both PCa cell lines, sorted according to their expression fold changes in PC3. e Pie chart displaying the biological processes associated with 2671 transcripts upregulated by stromal SPINK1 in PC3 cells. f Column chart manifesting the expression sites of 2671 transcripts upregulated in PC3 cells after SPINK1 stimulation, with percentage and log10 (P value) per specific site indicated on the left and right Y axis, respectively. Data derived from by the FunRich program. g Heatmap of gene expression signatures associated with phenotypic changes including epithelial–mesenchymal transition (EMT)/cancer stem cell (CSC)/angiogenesis (ANG) after SPINK1 stimulation of PC3 cells. Data were acquired from qRT-PCR assays. h Immunoblot assessment of protein level expression of phenotype-associated markers displayed in (g). GAPDH, loading control. i Representative phase contrast images for morphological changes observed in PC3 and DU145 cells, upon in vitro culture for 3 days with SPINK1+ CM from PSC27 cells. Scale bars, 20 μm. j Immunofluorescence staining of CDH1 (E-cadherin) and vimentin expressed in PC3 cells treated with PSC27 subline CM. Scale bars, 20 μm. k Representative fluorescence images for in vitro tube formation assay to assess angiogenesis of PCa cells placed on the polymerized matrigel. Scale bars, 100 μm. Data of (gk) are mean ± SD and representative of 3 independent experiments, with 3 technical replicates performed per cell-based assay
Fig. 6
Fig. 6
Therapeutically targeting SPINK1 promotes tumour responses to anticancer agents. a Experimental workflow for severe combined immunodeficient (SCID) mice. Two weeks after subcutaneous implantation and in vivo uptake of tissue recombinants, animals received single or combinational agents administered as metronomic treatments composed of several cycles. b Statistics of tumour end volumes. PC3 cells were xenografted alone or together with PSC27 subline cells to the hind flank of SCID mice. MIT was administered to induce tumour regression. c Transcript assessment of several canonical SASP factors expressed in stromal cells isolated from the tumours of SCID mice. Tissues from animals implanted with both stromal and cancer cells were subject to LCM isolation and subsequent assays. d Representative IHC images of SPINK1 expression in tissues isolated from placebo or MIT-treated animals. Square regions in the upper images were zoomed into lower images. Scale bars, 100 μm. e Statistical comparison of tumour end volumes in animals that underwent several different treatment modalities. Tumour volumes were measured at the end of an 8-week preclinical regimen. f Representative bioluminescence images (BLI) of PC3/PSC27 tumour-bearing animals in the preclinical trial. Digital signals were proportional to in vivo luciferase activities measured by an IVIS device. g Statistical assessment of DNA-damaged and apoptotic cells in the biospecimens analyzed in (e). Values are presented as a percentage of cells positively stained by IHC with antibodies against γ-H2AX or caspase 3 (cleaved). Right, representative IHC images of caspase 3 (cleaved). Biopsies of placebo-treated animals served as negative controls for MIT-treated mice. Scale bars, 100 μm. h SPINK1 concentration assessment in circulating blood of experimental mice treated by chemotherapy and/or SPINK1 mAb. Data were derived from human SPINK1-specific ELISA assays. Data are mean ± SD and representative of 3 independent experiments. P values were calculated by Student’s t-test (b, c, e, g, h) (^P > 0.05; *P < 0.05; **P < 0.01; ***P < 0.001; ****P < 0.0001)
Fig. 7
Fig. 7
SPINK1 is a novel circulating biomarker indicative of SASP development and predicts the adverse therapeutic outcome of cancer patients. a ELISA measurement of SPINK1 protein abundance in the serum of untreated and chemo-treated PCa patients. n = 20 per group. b ELISA assays of IL-8 protein abundance in patient serum analyzed in (a). n = 20 per group. c Scatterplot showing a correlation between SPINK1 and IL-8 in the serum of individual patients studied in (a) and (b). Pearson’s correlation coefficient, P value and confidence interval indicated. d Immunoblot of SPINK1 and IL-8 circulating in the serum of randomly selected PCa patients. Albumin, sample loading control for serum protein. n = 6 per group. e Heatmap depicting the overall correlation between stromal SPINK1, serum SPINK1, stromal IL-8, and serum IL-8 in chemo-treated patients (n = 10). The raw stromal scores derived from independent pathological reading of primary tumour tissues, while serum scores from ELISA assays. f Kaplan–Meier survival analysis of chemo-treated PCa patients. Disease-free survival (DFS) stratified according to SPINK1 expression in tumour stroma. DFS represents the length (months) of period calculated from the date of chemotherapy completion to the point of first time disease relapse. g TCGA data (Beeswarm graph) show relative expression of SPINK1 in a cohort of ovarian cancer patients (red dots) in contrast to a normal women population (black dots). h TCGA data (bar graph) show alterations of SPINK1 in human PCa patients at the genomic level, including mutation, amplification, and deep deletion. Alteration frequency is displayed in percentage. i TCGA data (bar graph) display changes of SPINK1 in human BCa patients at the genomic level with the same analysis parameters used in (h). j Illustrative diagram of SPINK1 expression in the treatment-damaged TME, pathological impact of paracrine SPINK1 on intercellular signaling network of cancer cells and its potential as a therapeutic target and novel biomarker for clinical oncology. Data of (ae) are representative of 3 independent experiments. P values were calculated by Student’s t-test (a, b), Pearson analysis (c), and log-rank (Mantel–Cox) test (f) (***P < 0.001; ****P < 0.0001). HR hazard ratio

References

    1. Junttila MR, de Sauvage FJ. Influence of tumour micro-environment heterogeneity on therapeutic response. Nature. 2013;501:346–354. doi: 10.1038/nature12626. - DOI - PubMed
    1. Klemm F, Joyce JA. Microenvironmental regulation of therapeutic response in cancer. Trends Cell Biol. 2015;25:198–213. doi: 10.1016/j.tcb.2014.11.006. - DOI - PMC - PubMed
    1. Straussman R, et al. Tumour micro-environment elicits innate resistance to RAF inhibitors through HGF secretion. Nature. 2012;487:500–504. doi: 10.1038/nature11183. - DOI - PMC - PubMed
    1. Kodack David P., Askoxylakis Vasileios, Ferraro Gino B., Sheng Qing, Badeaux Mark, Goel Shom, Qi Xiaolong, Shankaraiah Ram, Cao Z. Alexander, Ramjiawan Rakesh R., Bezwada Divya, Patel Bhushankumar, Song Yongchul, Costa Carlotta, Naxerova Kamila, Wong Christina S. F., Kloepper Jonas, Das Rita, Tam Angela, Tanboon Jantima, Duda Dan G., Miller C. Ryan, Siegel Marni B., Anders Carey K., Sanders Melinda, Estrada Monica V., Schlegel Robert, Arteaga Carlos L., Brachtel Elena, Huang Alan, Fukumura Dai, Engelman Jeffrey A., Jain Rakesh K. The brain microenvironment mediates resistance in luminal breast cancer to PI3K inhibition through HER3 activation. Science Translational Medicine. 2017;9(391):eaal4682. doi: 10.1126/scitranslmed.aal4682. - DOI - PMC - PubMed
    1. Wilson TR, et al. Widespread potential for growth-factor-driven resistance to anticancer kinase inhibitors. Nature. 2012;487:505–509. doi: 10.1038/nature11249. - DOI - PMC - PubMed

Publication types