

Choosing appropriate prosthetic ankle work to reduce the metabolic cost of individuals with transtibial amputation
- PMID: 30333504
- PMCID: PMC6193045
- DOI: 10.1038/s41598-018-33569-7
Choosing appropriate prosthetic ankle work to reduce the metabolic cost of individuals with transtibial amputation
Abstract
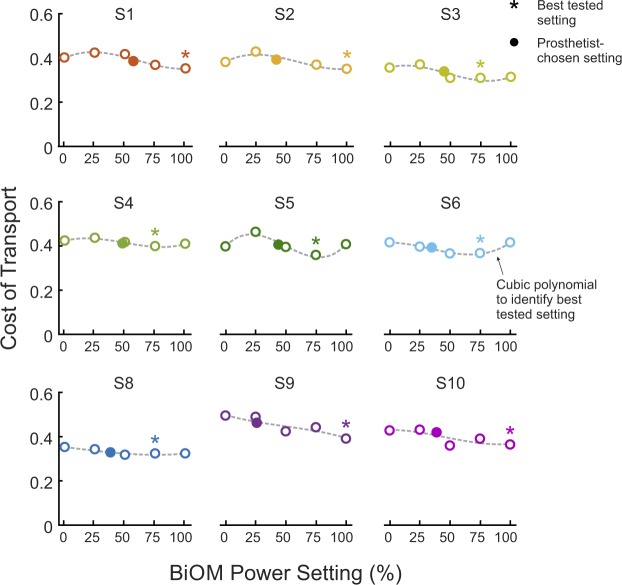
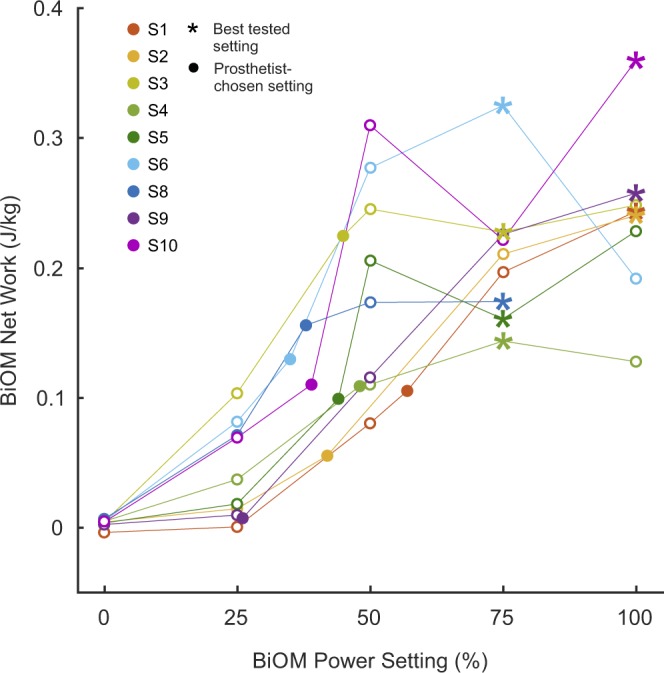
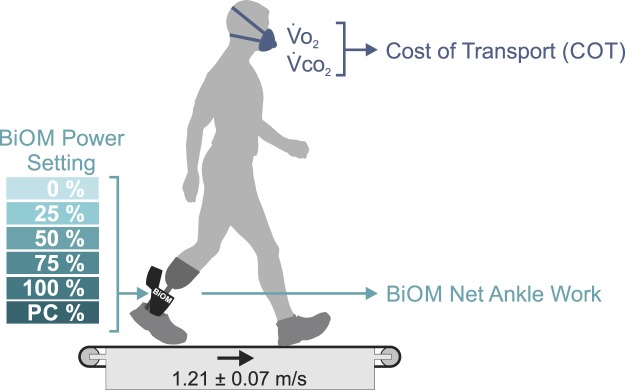
Powered ankle prostheses have been designed to reduce the energetic burden that individuals with transtibial amputation experience during ambulation. There is an open question regarding how much power the prosthesis should provide, and whether approximating biological ankle kinetics is optimal to reduce the metabolic cost of users. We tested 10 individuals with transtibial amputation walking on a treadmill wearing the BiOM powered ankle prosthesis programmed with 6 different power settings (0-100%), including a prosthetist-chosen setting, chosen to approximate biological ankle kinetics. We measured subjects' metabolic cost of transport (COT) and the BiOM's net ankle work during each condition. Across participants, power settings greater than 50% resulted in lower COT than 0% or 25%. The relationship between power setting, COT, and net ankle work varied considerably between subjects, possibly due to individual adaptation and exploitation of the BiOM's reflexive controller. For all subjects, the best tested power setting was higher than the prosthetist-chosen setting, resulting in a statistically significant and meaningful difference in COT between the best tested and prosthetist-chosen power settings. The results of this study demonstrate that individuals with transtibial amputation may benefit from prescribed prosthetic ankle push-off work that exceeds biological norms.
Conflict of interest statement
The authors declare no competing interests.
Figures


Similar articles
-
A controlled clinical trial of a clinically-tuned powered ankle prosthesis in people with transtibial amputation.Clin Rehabil. 2018 Mar;32(3):319-329. doi: 10.1177/0269215517723054. Epub 2017 Jul 27. Clin Rehabil. 2018. PMID: 28750586 Clinical Trial.
-
Step-to-step transition work during level and inclined walking using passive and powered ankle-foot prostheses.Prosthet Orthot Int. 2016 Jun;40(3):311-9. doi: 10.1177/0309364614564021. Epub 2015 Jan 27. Prosthet Orthot Int. 2016. PMID: 25628378
-
Increasing ankle push-off work with a powered prosthesis does not necessarily reduce metabolic rate for transtibial amputees.J Biomech. 2016 Oct 3;49(14):3452-3459. doi: 10.1016/j.jbiomech.2016.09.015. Epub 2016 Sep 21. J Biomech. 2016. PMID: 27702444
-
The influence of powered prostheses on user perspectives, metabolics, and activity: a randomized crossover trial.J Neuroeng Rehabil. 2021 Mar 16;18(1):49. doi: 10.1186/s12984-021-00842-2. J Neuroeng Rehabil. 2021. PMID: 33726802 Free PMC article. Clinical Trial.
-
Does use of a powered ankle-foot prosthesis restore whole-body angular momentum during walking at different speeds?Clin Orthop Relat Res. 2014 Oct;472(10):3044-54. doi: 10.1007/s11999-014-3647-1. Clin Orthop Relat Res. 2014. PMID: 24781926 Free PMC article.
Cited by
-
Low limb prostheses and complex human prosthetic interaction: A systematic literature review.Front Robot AI. 2023 Feb 13;10:1032748. doi: 10.3389/frobt.2023.1032748. eCollection 2023. Front Robot AI. 2023. PMID: 36860557 Free PMC article. Review.
-
Robotic Emulation of Candidate Prosthetic Foot Designs May Enable Efficient, Evidence-Based, and Individualized Prescriptions.J Prosthet Orthot. 2022 Oct;34(4):202-212. doi: 10.1097/JPO.0000000000000409. Epub 2021 Dec 30. J Prosthet Orthot. 2022. PMID: 36157327 Free PMC article.
-
Human-prosthesis coordination: A preliminary study exploring coordination with a powered ankle-foot prosthesis.Clin Biomech (Bristol). 2020 Dec;80:105171. doi: 10.1016/j.clinbiomech.2020.105171. Epub 2020 Sep 7. Clin Biomech (Bristol). 2020. PMID: 32932017 Free PMC article.
-
Deleterious Musculoskeletal Conditions Secondary to Lower Limb Loss: Considerations for Prosthesis-Related Factors.Adv Wound Care (New Rochelle). 2021 Dec;10(12):671-684. doi: 10.1089/wound.2019.1079. Epub 2020 May 22. Adv Wound Care (New Rochelle). 2021. PMID: 32320367 Free PMC article.
-
Reducing stiffness of shock-absorbing pylon amplifies prosthesis energy loss and redistributes joint mechanical work during walking.J Neuroeng Rehabil. 2021 Sep 21;18(1):143. doi: 10.1186/s12984-021-00939-8. J Neuroeng Rehabil. 2021. PMID: 34548080 Free PMC article.
References
-
- Torburn L, Powers CM, Guiterrez R, Perry J. Energy expenditure during ambulation in dysvascular and traumatic below-knee amputees: a comparison of five prosthetic feet. J. Rehabil. Res. Dev. 1995;32:111–119. - PubMed
Publication types
MeSH terms
LinkOut - more resources
Full Text Sources
Medical
Miscellaneous
