. 2018 Oct;562(7728):605-609.
doi: 10.1038/s41586-018-0615-z. Epub 2018 Oct 17.

LILRB4 signalling in leukaemia cells mediates T cell suppression and tumour infiltration

Affiliations

LILRB4 signalling in leukaemia cells mediates T cell suppression and tumour infiltration

Mi Deng et al. Nature. 2018 Oct.

Abstract

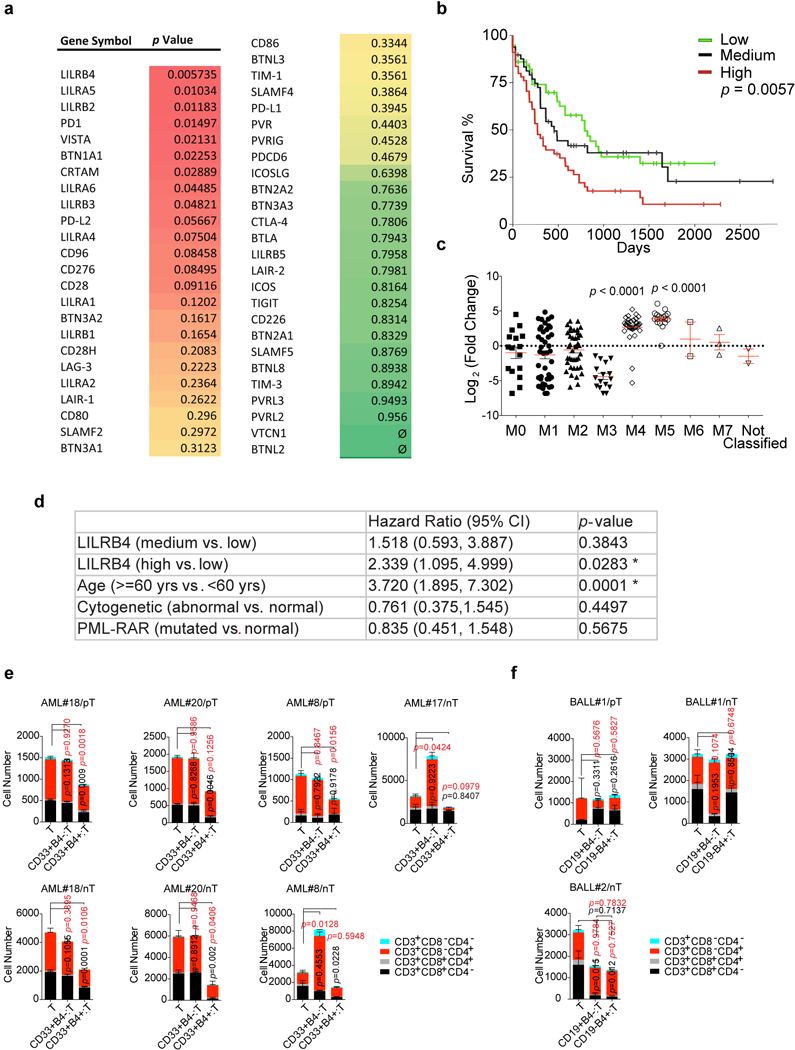
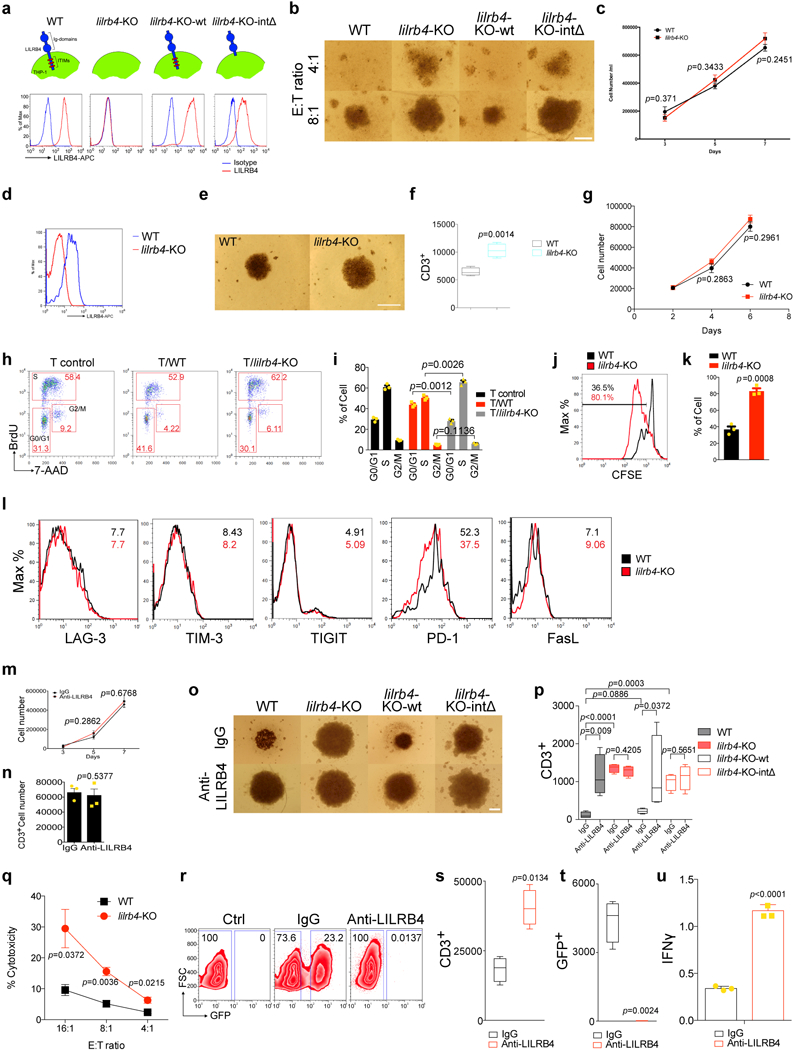
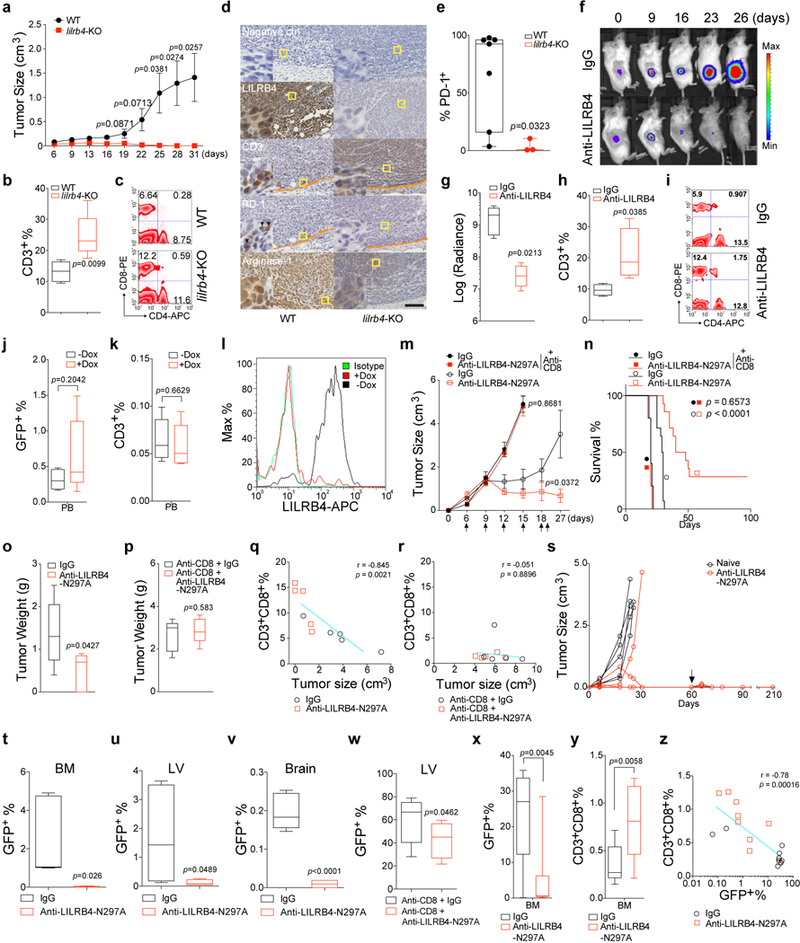
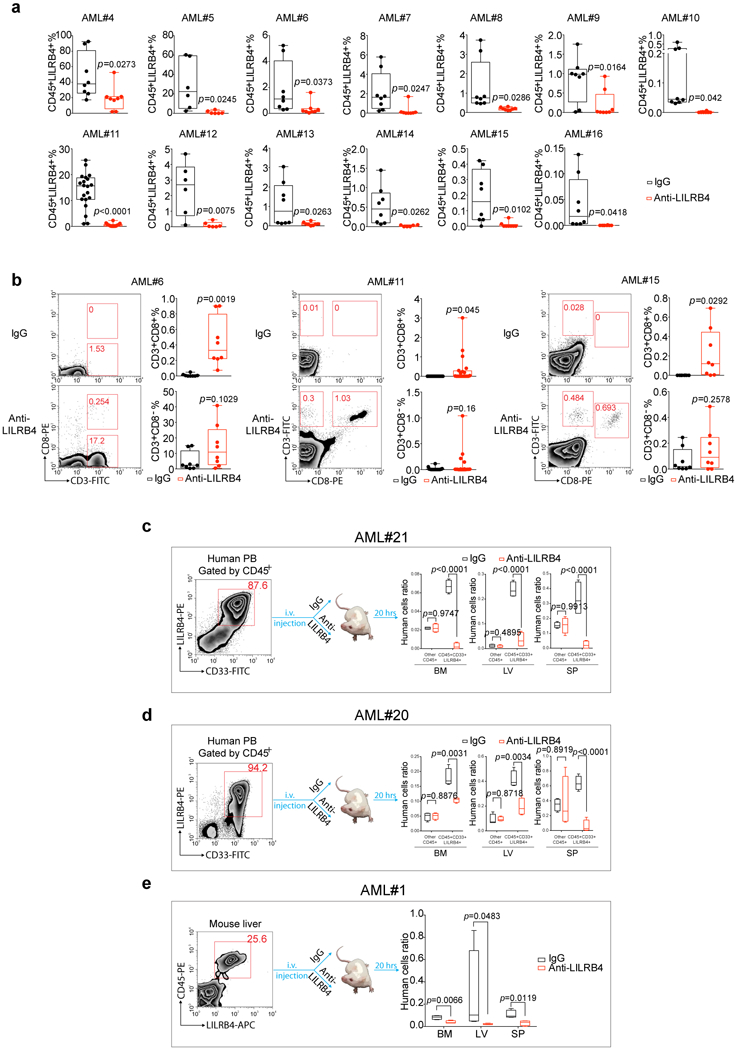
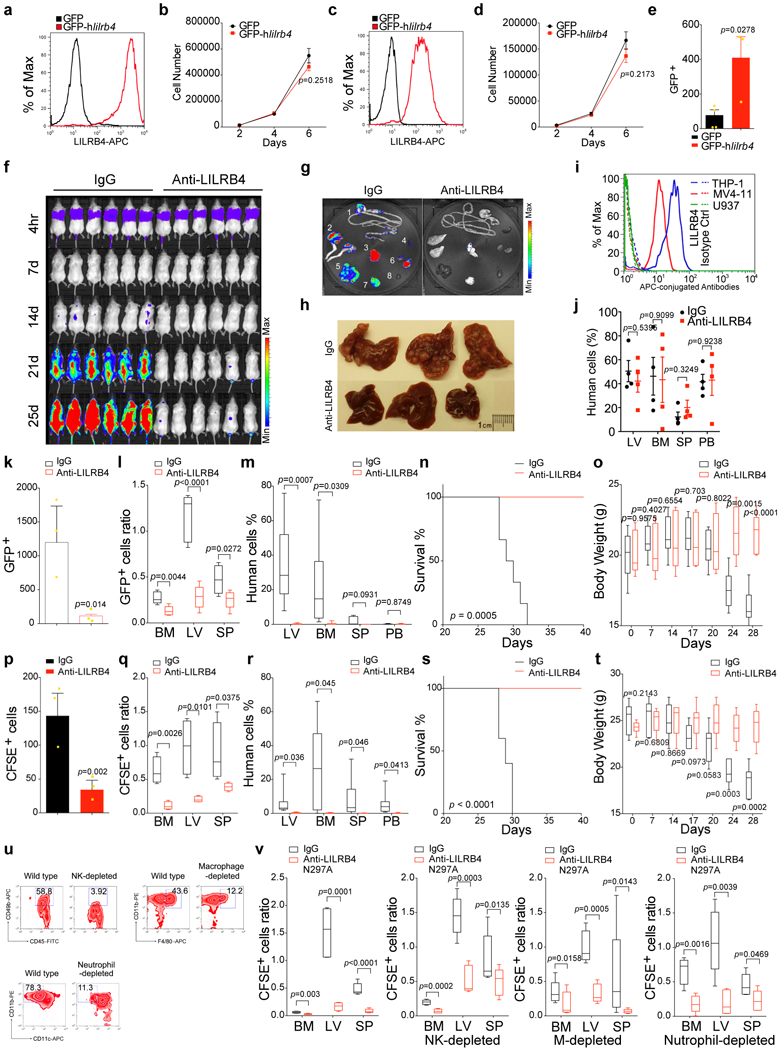
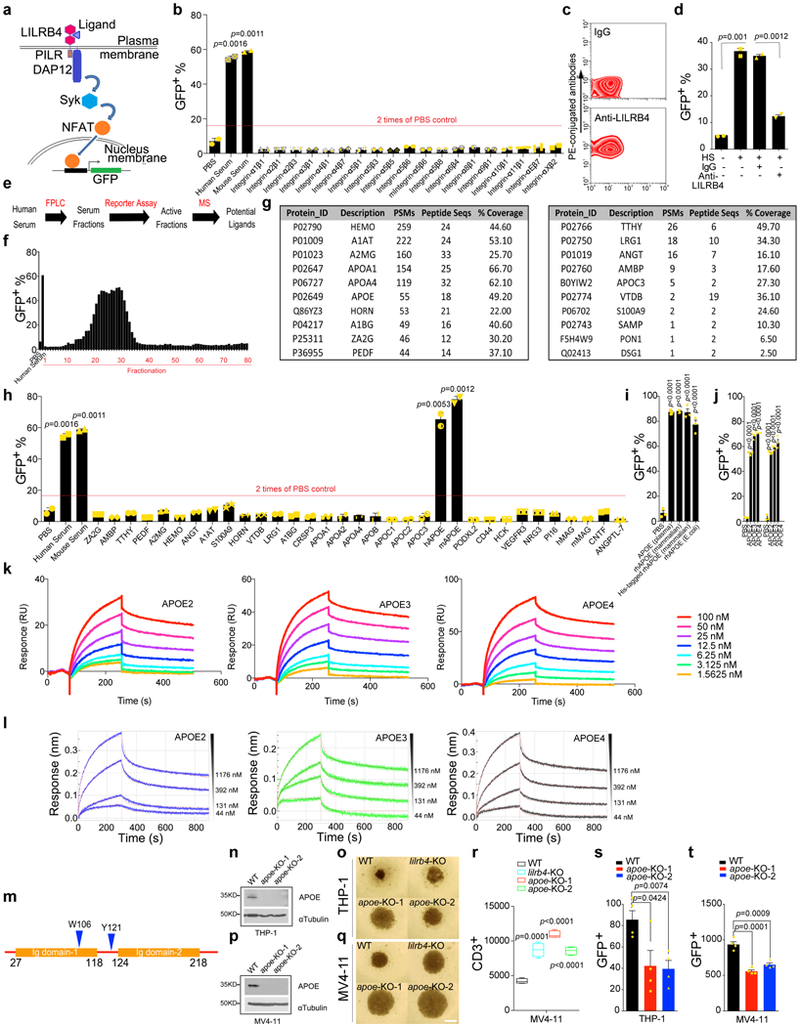
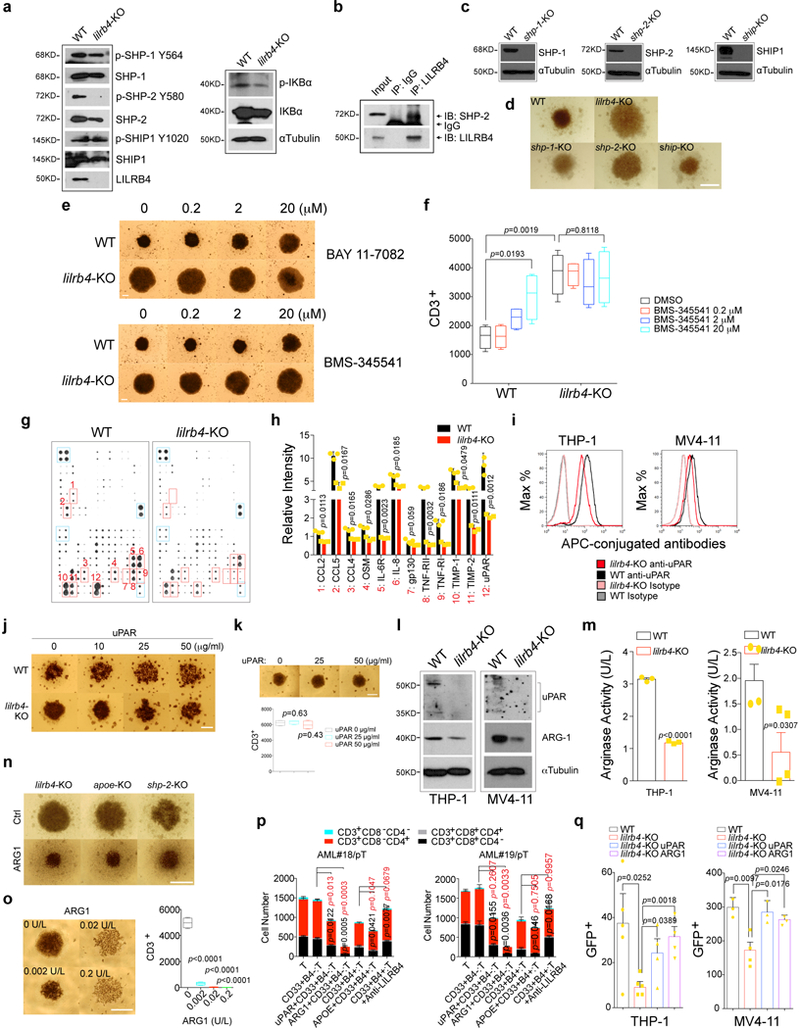
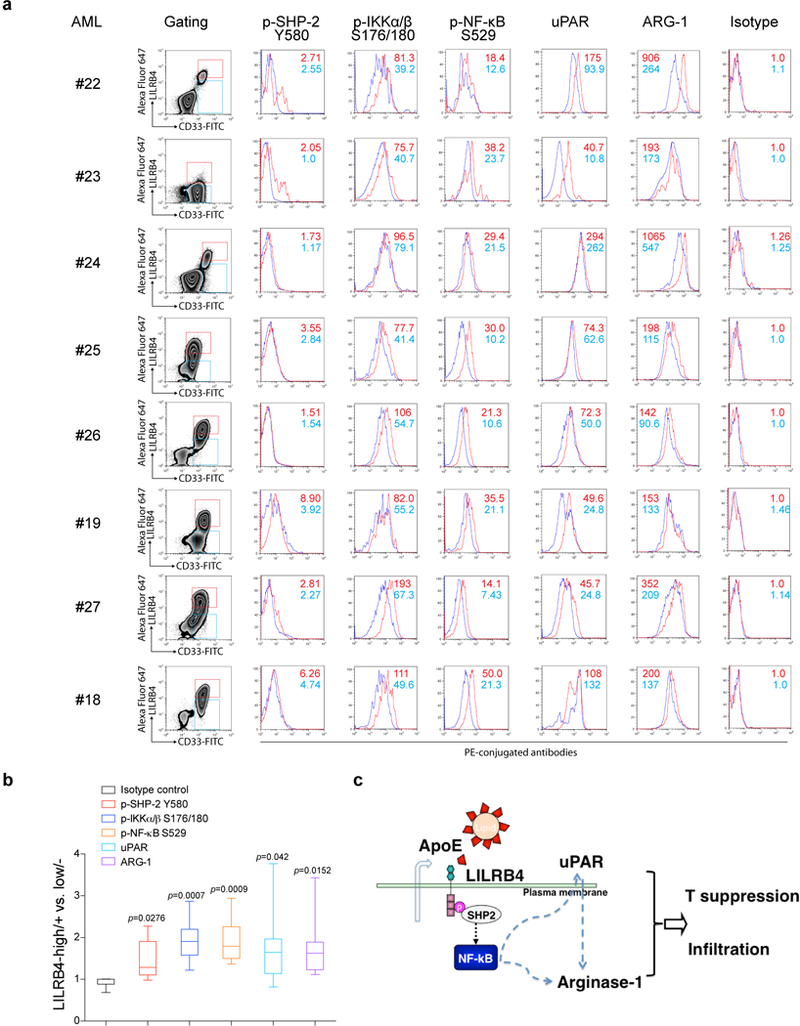
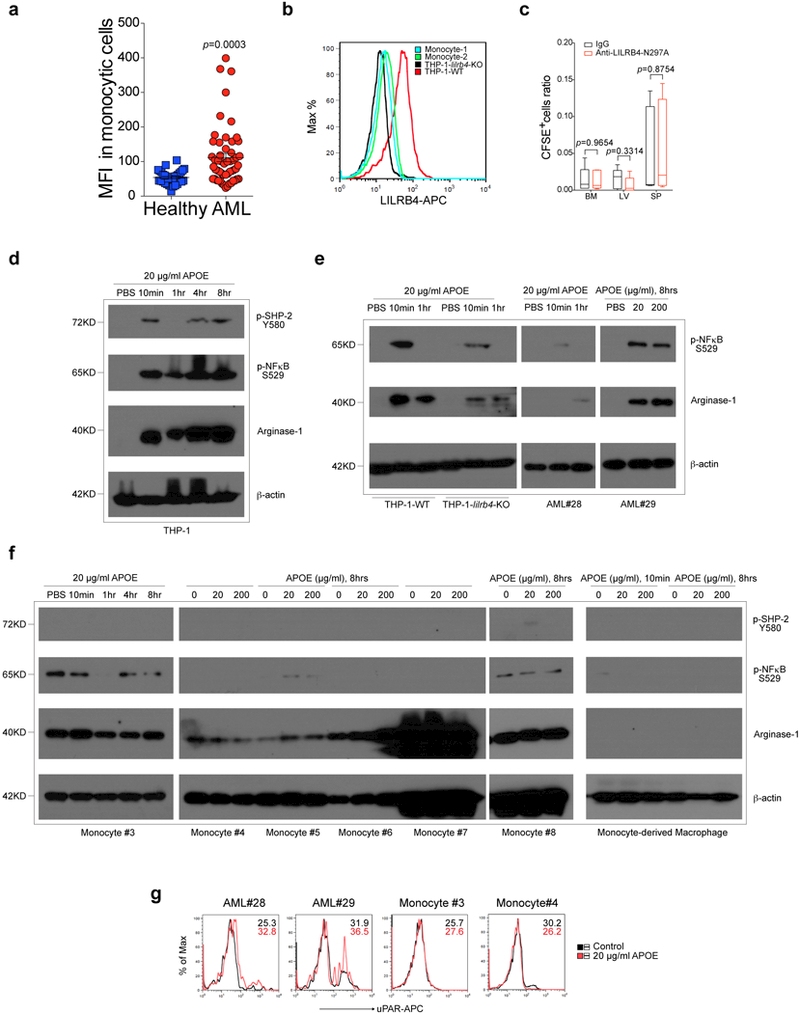
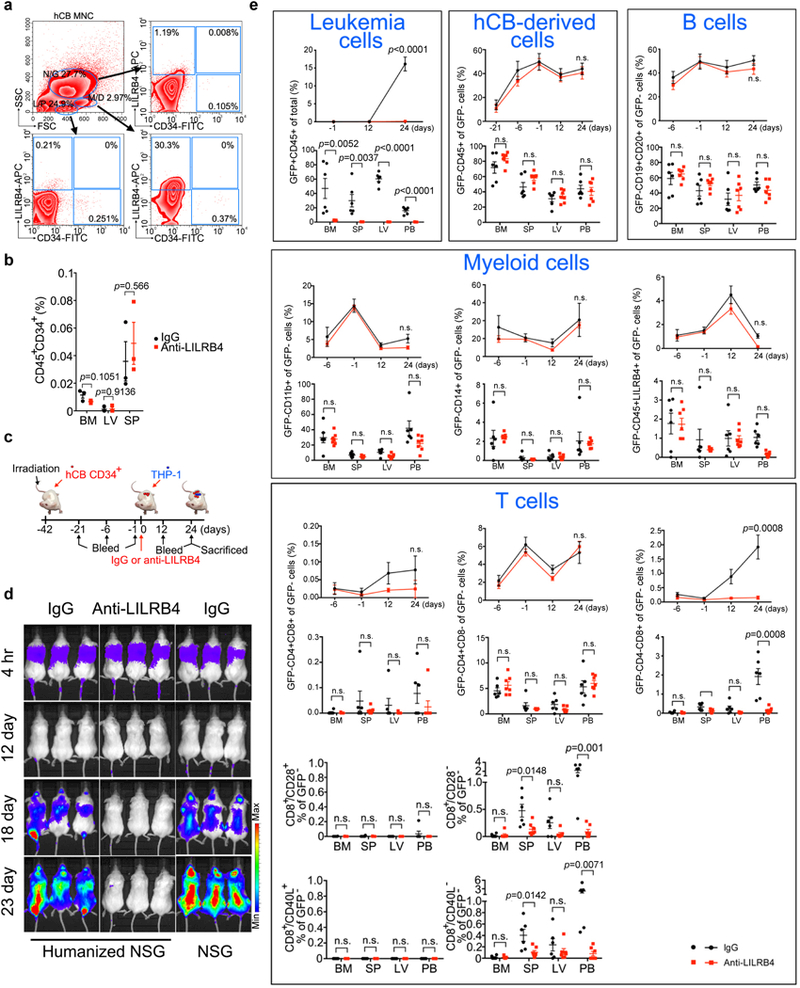
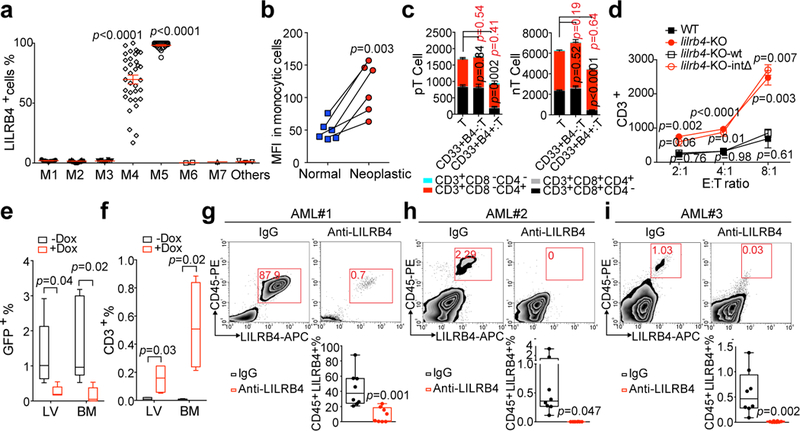
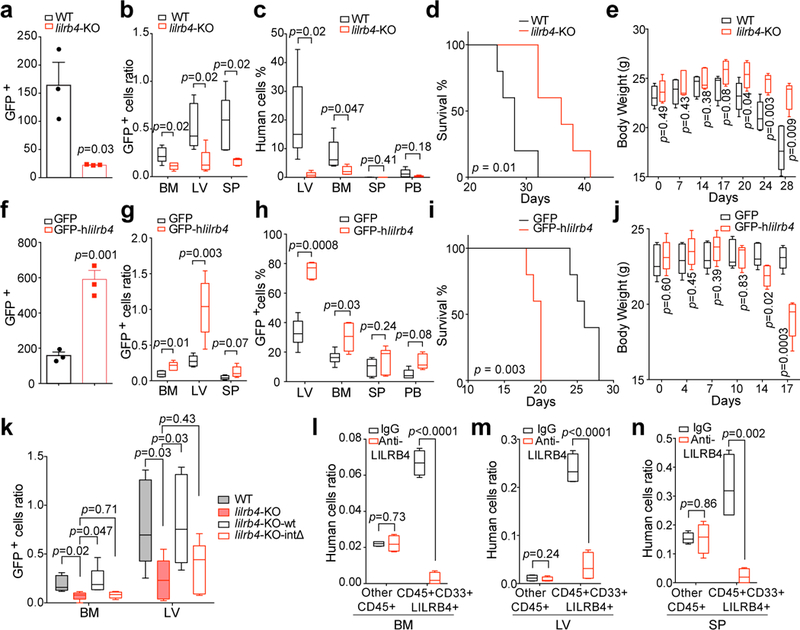
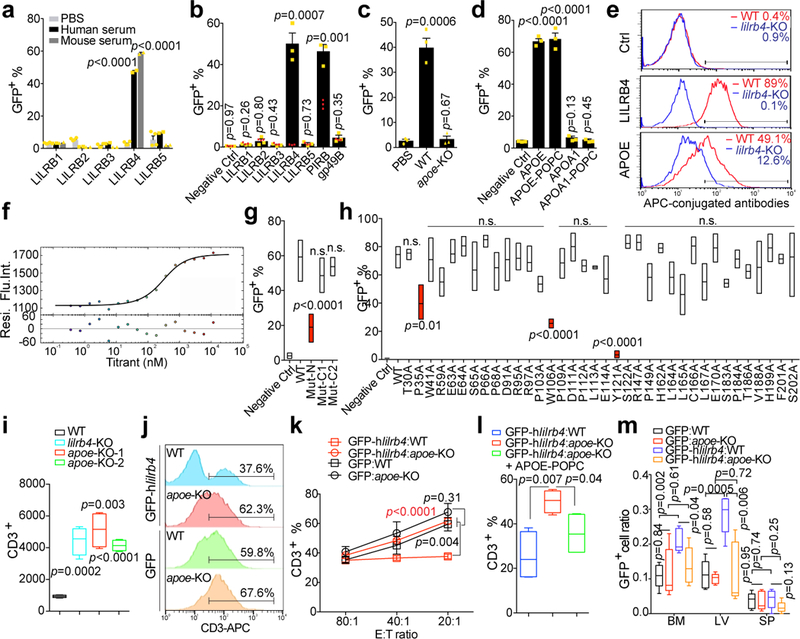
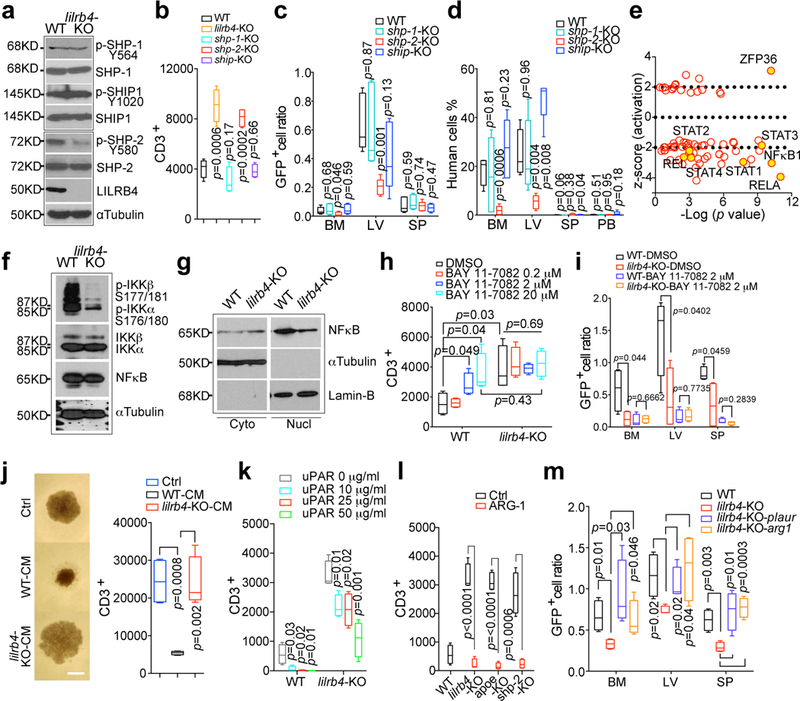
Immune checkpoint blockade therapy has been successful in treating some types of cancer but has not shown clinical benefits for treating leukaemia1. This result suggests that leukaemia uses unique mechanisms to evade this therapy. Certain immune inhibitory receptors that are expressed by normal immune cells are also present on leukaemia cells. Whether these receptors can initiate immune-related primary signalling in tumour cells remains unknown. Here we use mouse models and human cells to show that LILRB4, an immunoreceptor tyrosine-based inhibition motif-containing receptor and a marker of monocytic leukaemia, supports tumour cell infiltration into tissues and suppresses T cell activity via a signalling pathway that involves APOE, LILRB4, SHP-2, uPAR and ARG1 in acute myeloid leukaemia (AML) cells. Deletion of LILRB4 or the use of antibodies to block LILRB4 signalling impeded AML development. Thus, LILRB4 orchestrates tumour invasion pathways in monocytic leukaemia cells by creating an immunosuppressive microenvironment. LILRB4 represents a compelling target for the treatment of monocytic AML.


Figures

Extended Data Figure 1.
Extended Data Figure 1.. LIRB4 expression in human AML patients and negatively correlated with patient overall survival and T cell proliferation.
a, Analysis of correlation between mRNA levels of immune modulating molecules and the overall survival of AML patients (n=160, divided into three groups based on gene expression) in TCGA database (https://xena.ucsc.edu) by Kaplan-Meier long-rank test. b, Kaplan-Meier analysis of correlations between lilrb4 mRNA level and the overall survival of AML patients (n=160) from the TCGA database was performed in Xena browser (https://xena.ucsc.edu). Low, n=57; Medium, n=48; High, n=55. The p value was from Kaplan-Meier long-rank test. c, mRNA expression data from the TCGA database was analyzed as a function of patient AML subtype. M0, n=16; M1, n=42; M2, n=39; M3, n=16; M4, n=35; M5, n=18; M6, n=2; M7, n=3; and two not-classified AML samples. Pairwise comparisons between M4 and each one of the other subtypes (all of the p-values are <0.0001), as well as between M5 and each one of the other subtypes (all of the p-values are <0.0001), using two-sample t-test. Mean and s.e.m. values were shown. d, A multivariable Cox regression analysis to assess the association, with adjustment for confounders that include age, cytogenetics, and PML-RAR mutation in TCGA database. The total sample size was 79. *, p<0.05 is considered as significant. e-f, Autologous T cells isolated from individual monocytic AML or B-ALL patients were incubated with irradiated lilrb4-positive or lilrb4-negative primary leukemia cells from the same patients. pT, patient T cells. Allogeneic T cells isolated from healthy donors were incubated with irradiated lilrb4-positive or lilrb4-negative primary leukemia cells from indicated AML or B-ALL patients at an E:T of 10:1. nT, normal T cells. After culture with anti-CD3/CD28/CD137-coated beads and rhIL-2 for 14 days, T cells were stained with anti-CD3, anti-CD4, and anti-CD8 antibodies and analyzed by flow cytometry. (e and f) p values were from two-tailed student t-test. p values in black indicate significance of CD3+CD8+ cells; p values in red indicate significance of CD3+CD4+ cells. e-f, n=2 or 3 biologically independent samples with mean and s.e.m. See raw data of e and f in Source Data Extended Data Figure 1.
Extended Data Figure 2.
Extended Data Figure 2.. LILRB4 suppresses T cell proliferation in vitro.
a, Schematic of preparation of lilrb4-modulated THP-1 cells and examination of LILRB4 expression on the cell surfaces by flow cytometry. WT, THP-1 cells treated with scrambled control; lilrb4-KO, lilrb4-knockout THP-1 cells; lilrb4-KO-wt, forced expression of wild-type lilrb4 on lilrb4-KO THP-1 cells; lilrb4-KO-intΔ, forced expression of the intracellular domain-deleted mutant lilrb4 on lilrb4-KO THP-1 cells. b, Loss of lilrb4 on THP-1 cells reduces T cell suppression. Representative photograph of Fig. 1c (scale bar, 100 μm). c, Loss of lilrb4 on THP-1 cells does not affect cell proliferation (n=3 biologically independent samples with mean and s.e.m.). d, Examination of LILRB4 expression on cell surface of lilrb4-KO MV4–11 cells by flow cytometry. e-f, Loss of lilrb4 on MV4–11 cells reduces T cell suppression. T cells isolated from healthy donors incubated in the lower chambers of a 96-well transwell plate with irradiated MV4–11 cells (E:T of 2:1) in the upper chamber separated by a membrane with 3 μm pores. After culture with anti-CD3/CD28-coated beads and rhIL-2 for 7 days. Representative cells were photographed using an inverted microscope (scale bar, 100 μm) (e) and T cells were stained with anti-CD3 and analyzed by flow cytometry (f). n=4 biologically independent samples. g, Loss of lilrb4 on MV4–11 cells does not affect cell proliferation (n=3 biologically independent samples with mean and s.e.m.). h-i, T cells (E: effector cells) isolated from healthy donors were incubated with indicated irradiated THP-1 cells (T: target cells) without direct contact in transwells for 2 days. E:T=2:1. T cells were treated with BrdU for 30 mins followed by BrdU and 7-AAD staining for flow cytometry analysis. Representative flow cytometry plots are shown in h and the cell cycle status is summarized in i. T control, T cells were cultured without THP-1 cells. n=3 biologically independent samples with mean and s.e.m. j-k, T cells (E: effector cells) isolated from healthy donors were stained with CFSE and incubated with indicated irradiated THP-1 cells (T: target cells) without direct contact in transwells for 2 days. A representative flow cytometry plot is shown in j and the percentages of proliferating T cells indicated by CFSE-low staining is shown in k. n=3 biologically independent samples with mean and s.e.m. l, LILRB4 increases PD-1 expression on T cells in coculture of leukemia cells and T cells. T cells (E: effector cells) isolated from healthy donors were incubated with indicated irradiated THP-1 cells (T: target cells) in a non-contact manner for 5 days. E:T=2:1. T cells were stained with anti-LAG-3, anti-TIM-3, anti-TIGIT, anti-PD-1 and anti-FasL antibodies for flow cytometry analysis. Shown are representative flow cytometry plots and the mean of fluorescence intensities at the right-upper corner (black, WT; red, KO). Experiments were performed three times with similar results. m-n, Anti-LILRB4 antibody had no effect on proliferation of THP-1 cells (m) or T cells (n). m, The growth of THP-1 cells during 7 days treatment with IgG or anti-LILRB4 antibody (n=3 biologically independent samples with mean and s.e.m.). n, The activation status of human primary T cells after 5 days treatment of IgG or anti-LILRB4 antibody in vitro (n=3 biologically independent samples with mean and s.e.m.). o-p, Primary T cells and irradiated THP-1 cells (E:T ratio, 2:1) were placed to the lower chambers and upper chamber respectively and treated with 10 μg/ml control IgG or anti-LILRB4 antibodies. Shown in o are representative T cells photopgraphed (scale bar, 100 μm) and T cells were stained with anti-CD3 and analyzed by flow cytometry (p). n=4 biologically independent samples. q, Primary T cells stimulated with anti-CD3/CD28/CD137-coated beads were co-cultured with WT or lilrb4-KO-THP-1 cells with indicated E:T ratios for 4 hrs (n=3 biologically independent samples with mean and s.e.m.). Cytotoxity of leukemia cells was determined by PI staining in flow cytometry analysis. r-u, CD8+ T cells (5×10⁴ cells) stimulated with anti-CD3/CD28/CD137-coated beads were co-cultured with 5×10³ THP-1 cells that stably express GFP and treated with 100 μg/ml anti-LILRB4 antibodies or control IgG for 5 days. s-t, n=4 biologically independent samples; u, n=3 biologically independent samples with mean and s.e.m. Shown are representative flow plots (r) of the percentages of T cells (GFP-) and surviving leukemia cells (GFP+), and quantification of T cells (s), GFP+ leukemia cells (t), and secretion of IFNγ (u). (b, d-e, h, j, o and r) These experiments were repeated independently three times with similar results. See Methods for definition of box plot elements in f, p, and s-t. All p values were from two-tailed student t-test.
Extended Data Figure 3.
Extended Data Figure 3.. Inhibition of LILRB4 reduces leukemia development in humanized immunocompromised mice and syngeneic mice.
a-c, WT or lilrb4-KO THP-1 cells (3×10⁶ cells/mouse) were subcutaneously implanted into hPBMC-repopulated NSG mice (WT, n=14 mice with mean and s.e.m.; lilrb4-KO, n=10 mice with mean and s.e.m. Also see Source Data Extended Data Figure 3.). Shown are tumor size (a), quantitation of CD3+ at day 31 in peripheral blood of recipient mice (b) and representative flow plots showing CD4+ and CD8+ T cells (c). d-e, LILRB4 increases PD-1 expression on tumor-infiltrated T cells. WT or lilrb4-KO THP-1 cells were subcutaneously implanted into hPBMC-repopulated NSG mice. Three weeks after implantation, 7 out of 10 WT-group mice had large tumors and 3 out of 10 KO-group mice had tiny tumors. These tumors were dissected for immunohistochemistry and flow cytometry staining with anti-LILRB4, anti-CD3, anti-PD-1 or anti-Arginase-1 antibodies. Left corner images were magnified from the yellow highlighted regions. In CD3 and PD-1 staining images, orange dash lines indicate the tumor boundary. Black arrowheads indicate PD-1 positive cells. Scale bar, 100 μm. Shown in e, tumors were dissected and cells in tumor region were stained with anti-CD3 and anti-PD-1 antibodies for flow cytometry analysis. The percentages of PD-1+ T cells (Ratio of PD-1+CD3+cells/CD3+ cells) were calculated. f-i, THP-1 cells were transplanted into hPBMC-repopulated NSG mice, and mice were treated with control IgG or anti-LILRB4 antibody after 6 days (10 mg/kg; n=5). Leukemia development was monitored by luminescence imaging (f); luminescence flux (radiance) at day 26 (g; n=5) and T cell numbers at day 26 in representative mice (h-i) were also shown. j-k, Engraftment of human T cells and i.v. transplanted Doxycycline (Dox)-inducible lilrb4-knockout THP-1 cells (GFP+) in NSG mice at day 7 before Dox administration (n=5). l, Representative flow plot shows LILRB4 was successfully deleted in engrafted leukemia cells in bone marrow of Dox-fed mouse at the endpoint. n.s., not significant. m-w, Mouse AML C1498 cells (3×10⁶ cells/mouse) that stably express LILRB4-IRES-GFP were s.c. implanted into C57bl/6 mice. Anti-LILRB4-N297A antibodies or control IgG were i.v. injected at 6, 9, 12, 15, 18, and 21 days post implantation of tumor cells. Two groups of mice were treated with anti-CD8 antibodies at 3, 6, 9, and 12 days post implantation of tumor cells to achieve CD8+ T cell depletion. m, Tumor growth of subcutaneously implanted human LILRB4-expressing mouse AML C1498 cells (hlilrb4-C1498) in C57BL/6 mice with anti-LILRB4-N297A antibody or control antibody treatment (n=5 mice). Also see Source Data Extended Data Figure 3. n, Survival curve of subcutaneous hlilrb4-C1498-tumor-bearing mice (n=12 mice). Same as tumor size, anti-LILRB4 antibodies decreased the tumor weight (o, n=5 mice) but did not in the absence of CD8+ T cells (p, n=5 mice). The percentage of CD8+ T cells in spleen is significantly negatively correlated with tumor size (q, n=5 mice) but not in the absence of CD8+ T cells (r, n=5 mice). s, Adoptive transplantation of spleen cells from control mice or tumor-bearing mice that were cured by anti-LILRB4-N297A treatment (n=5 mice). Tumor size was monitored as a function of time. Arrow indicates day of rechallenge in mice that had eliminated leukemia with 3-times number of AML cells (n=4 mice). Also see Source Data Extended Data Figure 3. Anti-LILRB4 antibodies reduced the leukemia cells infiltrating into host tissues (t-v, n=5 mice) and even CD8+ cells were depleted (w, n=5 mice). x-z, C57bl/6 mice were i.v. implanted with human LILRb4-expressing mouse AML C1498 cells (3×10⁶ cells/mouse) that express GFP. Anti-LILRB4-N297A antibodies (n=9 mice) or control IgG (n=9 mice) were i.v. injected at 6, 9, 12, 15 and 18 days post implantation of tumor cells. Anti-LILRB4 antibodies decreased the percentage of leukemia cells in bone marrow (x). Anti-LILRB4 antibodies increased CD8+ T cells (y). The percentage of CD8+ T cells in bone marrow is significantly negatively correlated with the percentage of leukemia cells (z). (c, i and l) These experiments were repeated independently three times with similar results. See Methods for definition of box plot elements in b, e, g-h, j-k, o-p and t-y. All p values (except of n from long-rank test; and except of q-r and z from Pearson’s correlation) were from two-tailed student t-test.
Extended Data Figure 4.
Extended Data Figure 4.. Anti-LILRB4 antibodies reduce leukemia development by restore of autologous T cells in PDX mice and inhibition of primary AML cell infiltration.
a, Primary peripheral blood or bone marrow mononuclear AML cells (5×10⁶ −1×10⁷ cells/mouse) from each of sixteen human patients (three shown in Fig.1g-i, also see Supplementary Table 5) were injected into NSG mice followed by treatment with IgG or anti-LILRB4 antibody (10mg/kg. twice a week by i.v. injection). Shown are percentages of human CD45+LILRB4+ AML cells harvested from hematopoietic tissues including bone marrow, spleen, liver and peripheral blood at 2~4 months after transplantation as determined by flow cytometry. b, Shown are percentages of autologous human T cells harvested from hematopoietic tissues including bone marrow, spleen, liver and peripheral blood at 2~4 months after transplantation as determined by flow cytometry; and representative flow plots of CD3+CD8+ T cells in bone marrow of mice in three PDXs. n=8 biologically independent samples for all PDXs except AML#11 (n=20 biologically independent samples) in a-b. c-e, Comparison of infiltration of human primary monocytic AML cells in NSG mice (n=5 mice) after treatment with anti-LILRB4 antibody or IgG control. c-d, Primary human peripheral blood mononuclear cells from monocytic AML patients were injected. The quantifications in c are also shown in Fig. 2l-n. e, Mouse liver cells with xenografted primary human monocytic AML cells (human CD45+LILRB4+ cells) were injected. See Methods for definition of box plot elements in a-e. All p values were from two-tailed student t-test.
Extended Data Figure 5.
Extended Data Figure 5.. LILRB4 promotes infiltration of AML cells.
a and c, Examination of LILRB4 expression on mouse AML cells, C1498 (a) or WEHI-3 (c) that stably express lilrb4. b and d, Forced expression of LILRB4 did not affect cell proliferation of mouse AML cells, C1498 (b, n=3 biologically independent samples with mean and s.e.m.) or WEHI-3 (d, n=3 biologically independent samples with mean and s.e.m.). e, Forced expression of human LILRB4 promoted transendothelial migration of mouse AML WEHI-3 cells (n=3 biologically independent samples with mean and s.e.m.). f, NSG mice (n=6 mice) were injected with 1×10⁶ THP-1 cells followed immediately by IgG or anti-LILRB4 antibody treatment and were monitored by bioluminescence imaging. g-h, Anti-LILRB4 antibodies decreased AML cells infiltration into internal organs. Mice were sacrificed at 21 days for ex vivo bioluminescence imaging of internal organs after transplantation of 1×10⁶ luciferase-expressed THP-1 cells. Images of luminescence flux (radiance) from representative mice are shown (g). 1: GI tract; 2: legs; 3: lung; 4: spleen; 5: liver; 6: kidneys; 7: brain; 8: heart. Infiltrated leukemia cells formed tumor nodules in liver (h). i-j, Anti-LILRB4 antibodies did not have effect on LILRB4-negative cancer cells. LILRB4 is expressed on THP-1 and MV4–11 human AML cells but not on U937 cells as analyzed by flow cytometry (i). Isotype IgG was used as control. NSG mice were injected with U937 human AML cells, which do not express LILRB4, and then treated with anti-LILRB4 antibodies (j). IgG served as control antibodies. Mice were sacrificed at day 25 post-transplant for analysis of LV, BM, SP, and PB by flow cytometry. The presence of human AML cells was detected by anti-human CD45 antibody staining (n=4 mice with mean and s.e.m.). k-t, Anti-LILRB4 antibodies decreased infiltration of THP-1 (k-o) or MV4–11 (p-t) human AML cells. Comparison of transendothelial migration abilities of GFP-expressing THP-1 (k) or CFSE-labeled MV4–11 (p) cells after treatment with anti-LILRB4 antibody or IgG control in a transwell assay (n=3 biologically independent samples with mean and s.e.m.). Comparison of the homing abilities of CFSE-labeled MV4–11 cells (5×10⁶ per mouse) that were injected into NSG mice followed immediately by IgG or anti-LILRB4 antibody treatment at 20 hr post-injection (n=5 mice). Numbers of leukemia cells (GFP+ in l or CFSE+ in q) in LV, SP, and BM normalized to that in PB as determined by flow cytometry are shown. NSG mice were injected with 1×10⁶ THP-1 or MV4–11 cells followed immediately by IgG or anti-LILRB4 antibody treatment (n=6 mice for THP-1 or 5 mice for MV4–11 xenografts). Shown are percentages of MV4–11 cells (stained with anti-human CD45) as determined by flow cytometry in indicated organs at day 21 post-transplant (m and r), overall survival (n and s), and body weights as a function of time (o and t). u, Targeted immune cell populations were depleted in NSG mice. Representative flow cytometry plots demonstrating successful reduction of NK cell (CD45+CD49b+), macrophage (CD11b+F4/80+), and neutrophil (CD11b+CD11c-) frequency in NSG mice depleted of the respective immune cell subtype by treatment with anti-asialo GM1 antibodies, clodronate liposomes, and anti-Ly6G antibodies, respectively, compared to non-depleted (wild-type) NSG mice. v, CFSE-labeled MV4–11 cells (5×10⁶ per mouse) were injected into NSG mice in that respective innate immune cells were depleted, followed immediately by IgG or anti-LILRB4-N297A antibody treatment (n=5 mice). Numbers of leukemia cells (CFSE positive) in LV, SP, and BM normalized to that in PB at 20 hr post-injection are shown. (a, c, i and u) These experiments were repeated independently three times with similar results. See Methods for definition of box plot elements in l-m, o, q-r, t and v. All p values (except of n and s from long-rank test) were from two-tailed student t-test.
Extended Data Figure 6.
Extended Data Figure 6.. APOE induces LILRB4 activation to suppress T cell and support AML cell migration in vitro.
a, Schematic of the LILRB4 reporter system. b, Human and mouse integrin heterodimer proteins cannot activate LILRB4 reporter (n=3 biologically independent samples with mean and s.e.m.). Human and mouse serum were used as positive controls. The threshold of activation is 2 times of negative control treatment. c, Flow cytometry demonstrating that anti-LILRB4 antibody binds to human LILRB4 reporter cells. d, The LILRB4 activation as indicated by percentage of GFP+ cells in the presence and absence of 10% human serum (HS) with or without anti-LILRB4 antibody or control IgG (n=3 biologically independent samples with mean and s.e.m.). e, Flowchart of ligand identification of potential ligands of LILRB4 in human serum. f, Fractionation of LILRB4 stimulating activities from human serum by FPLC. The positive control was 10% human serum. g, A list of proteins identified from the LILRB4 stimulating fractions by mass spectrometry. PSMs: peptide spectrum matches. h, Both Human and mouse APOE proteins can activate LILRB4 reporter (n=3 biologically independent samples with mean and s.e.m.). Human and mouse serum were used as positive controls. The threshold of activation is 2 times of negative control treatment. i, APOE proteins from different sources all activate LILRB4. APOE (20 μg/ml) purified from human plasma, His-tagged or tag-free recombinant human APOE (rhAPOE) (20 μg/ml) expressed by 293T mammalian cells, or rhAPOE (20 μg/ml) expressed by bacteria all activate the LILRB4 reporter. These APOE all represent human APOE3 (n=3 biologically independent samples with mean and s.e.m.). j, APOE2, APOE3 and APOE4 all activate the LILRB4 reporter (n=3 biologically independent samples with mean and s.e.m.). 40 μg/ml APOEs were coated on plates or directly added in cell culture media (soluble). k-l, Three APOE isoforms binds to human LILRB4. k, Binding kinetics of APOE 2, 3, and 4 to LILRB4-Fc were measured using surface plasmon resonance (SPR). LILRB4-Fc was immobilized on Protein A biosensor tips and incubated with APOE concentrations ranging from 1.5625 nM to 100 nM. l, Binding kinetics of APOE 2, 3, and 4 to LILRB4-Fc were measured using Bio-layer Interferometry (Octet). LILRB4-Fc was immobilized on Protein A biosensor tips and incubated with APOE concentrations ranging from 44 nM to 1176 nM. m, As shown in Fig. 3h, mutation of two residues, W106 and Y121 significantly reduced activation of LILRB4 by APOE, located in the first Ig domain and in the linker between two Ig domains, respectively. n and p, Examination of APOE expression in apoe-knockout THP-1 and MV4–11 cells by immunoblots. Primary T cells and irradiated THP-1 or MV4–11 cells (E:T=2:1) were incubated in the lower and upper chambers respectively. T cells were photographed (o and q, scale bar, 100 μm) and quantified by flow cytometry (Fig. 3i and, here r, n=4 biologically independent samples) after 7 days. s-t, Loss of APOE suppresses transendothelial migration of human AML THP-1 and MV4–11 cells (n=4 biologically independent samples with mean and s.e.m.). (c, k-l and n-q) These experiments were repeated independently three times with similar results. See Methods for definition of box plot elements in r. All p values were from two-tailed student t-test.
Extended Data Figure 7.
Extended Data Figure 7.. LILRB4 upregulates phosphorylation of SHP-2, NF-kB signaling, and expression of uPAR and Arginase-1 to suppress T cell activity and support leukemia migration.
a, Phosphorylated SHP-2, phosphorylated IKB, uPAR, and ARG1 were down-regulated upon lilrb4-knockout (KO) in MV4–11 cells. b, Co-immunoprecipitation demonstrated LILRB4 interacts with SHP-2 in THP-1 cells. c, shp-1, shp-2, and ship were individually knockout by CRISP/Cas9 in THP-1 cells as detected by Western blotting. d, Primary T cells and irradiated THP-1 cells (E:T=2:1) were cultured in the lower and upper chambers respectively. T cells were photographed (scale bar, 100 μm) after 7 days. e-f, Two different NF-κB inhibitors restored T cell proliferation from the suppression by THP-1 cells in an LILRB4-dependent manner (n=4 biologically independent samples). THP-1 cells were pretreated with various doses of NF-κB inhibitors for 1 hr. Primary T cells and irradiated pretreated THP-1 cells (E:T=2:1) were cultured in the lower and upper chambers respectively. T cells were photographed (e, scale bar, 100 μm) and analyzed by flow cytometry (f) after 7 days. g-h, Loss of lilrb4 decreased secreted protein production in THP-1 cells as determined by a human cytokine antibody array (g) and the blot intensities were quantified by ImageJ software (h, n=3 biologically independent samples with mean and s.e.m.). Red boxes indicate proteins that were changed upon lilrb4-knockout; blue boxes indicate positive controls. i, Surface uPAR was downregulated in lilrb4-knockout THP-1 and MV4–11 AML cells. j, T cells were incubated with irradiated indicated THP-1 cells supplemented with indicated concentration of recombinant uPAR proteins for 7 days. T cells were photographed. k, T cells isolated from healthy donors were cultured with anti-CD3/CD28-coated beads and rhIL-2 and supplemented with indicated concentrations of uPAR proteins for 3 days (n=4 biologically independent samples). Representative cells were photographed using an inverted microscope and T cells were analyzed by flow cytometry. l, Expression of uPAR and Arginase-1 (ARG1) is downregulated in in lilrb4-knockout THP-1 and MV4–11 AML cells. m, Arginase activity as determined by a colorimetric method (DARG-100, BioAssay system) was decreased in condition medium of lilrb4-KO THP-1 and MV4–11 cells (n=3 biologically independent samples with mean and s.e.m.). n, Primary T cells and irradiated indicated THP-1 cells (E:T=2:1) were incubated in the lower and upper chambers respectively and were supplemented with 0.002 U/L recombinant ARG1 proteins for 7 days. T cells were photographed. o, T cells isolated from healthy donors were cultured with anti-CD3/CD28-coated beads and rhIL-2 and supplemented with indicated concentrations of ARG1 proteins for 3 days (n=4 biologically independent samples). Representative cells were photographed using an inverted microscope and T cells were analyzed by flow cytometry. p, Autologous T cells isolated from individual monocytic AML patients were incubated with irradiated lilrb4-positive or lilrb4-negative primary leukemia cells from the same patients at an E:T of 10:1, supplemented with recombinant anti-LILRB4 antibodies, APOE-VLDL, uPAR or ARG1. pT, patient T cells. After culture with anti-CD3/CD28/CD137-coated beads and rhIL-2 for 14 days, T cells were stained with anti-CD3, anti-CD4, and anti-CD8 antibodies and analyzed by flow cytometry. n=3 biologically independent samples with mean and s.e.m. q, Supplementation of recombinant uPAR or ARG1 to the medium rescued the decrease of transmigration ability of lilrb4-KO THP-1 or lilrb4-KO MV4–11 cells across endothelium (n=3 biologically independent samples with mean and s.e.m.). Scale bar, 100 μm. (a-e, g, i-j, l and n) These experiments were repeated independently three times with similar results. See Methods for definition of box plot elements in f, k and o. All p values were from two-tailed student t-test. See raw data of p in Source Data Extended Data Figure 7.
Extended Data Figure 8.
Extended Data Figure 8.. Detection of SHP-2/NF-κB signaling and uPAR and Arginase-1 expression in primary human monocytic AML cells.
a, LILRB4-positive or -high CD33+ AML cells (red box) and LILRB4-negative or –low CD33+ AML cells (blue box) were gated for further intracellular staining of phosphorylated-SHP-2 at Y580, phosphorylated-IKKα/β at S176/S180, phosphorylated-NF-κB at S529, uPAR, and Arginase-1 (ARG1). Isotype IgG was used as negative controls. Red numbers indicate MFIs (mean fluorescence intensity) of LILRB4-positive or -high CD33+ AML cells; blue numbers indicate MFIs of LILRB4-negative or –low CD33+ AML cells. This experiment was repeated with 8 individual patient samples with similar results. b, Quantification of individual staining in LILRB4-positive or -high CD33+ AML cells versus in LILRB4-negative or low CD33+ AML cells. n=8 independent patients and see Methods for definition of box plot elements. p values were from two-tailed student t-test. c, Schematic for the mechanisms by which LILRB4 suppresses T cells and promotes leukemia infiltration.
Extended Data Figure 9.
Extended Data Figure 9.. Comparison of LILRB4 mediated intracellular signaling in leukemia cells and in normal hematopoietic cells.
a, Comparison of LILRB4 surface expression on normal monocytes from healthy donors (n=25 individual donors with mean and s.e.m.) and neoplastic monocytic cells from AML patients (n=53 individual patients with mean and s.e.m.). MFI: mean fluorescence intensity. b, Comparison of LILRB4 surface expression on normal monocytes from two healthy donors and on WT and lilrb4-KO THP-1 cells. This experiment was repeated independently three times with similar results. c, Anti-LILRB4 antibody did not affect homing ability of normal monocytes. Human normal monocytes (as shown in b) through CD14-positive selection. These isolated monocytes were pooled and stained by CFSE. After staining, monocytes (5×10⁶ for each mouse) were injected into NSG mice followed immediately by antibody treatment, and then the mice (n=4 mice, see Methods for definition of box plot elements) were sacrificed at 20 hrs after transplant. The number of CFSE+ cells in liver, spleen, and bone marrow were normalized to that in peripheral blood as determined by flow cytometry. d-e, APOE activates LILRB4 intracellular signaling in leukemia cells. Indicated THP-1 cells and primary AML (M5) cells were serum starved overnight and then treated with the indicated concentration of human recombinant APOE protein for indicated time. Phospho-SHP-2, phosphor-NFκB, and Arginase-1 were examined by western blotting. f, The effect of APOE on normal monocytes or in vitro differentiated macrophages. Normal monocytes were isolated from health donors and macrophages were derived from these monocytes after one-week differentiation in vitro. Cells were serum starved overnight and then treated with indicated concentrations of human recombinant APOE protein for indicated time. Phospho-SHP-2, phosphor-NFκB, and Arginase-1 were examined by western blotting. g, APOE induces uPAR upregulation on AML cells. Normal monocytes were isolated from health donors. Indicated primary AML cells and normal monocytes were serum starved overnight and then treated with 20 μg/ml human recombinant APOE protein for eight hours. Surface uPAR were examined by flow cytometry. Representative flow plots are shown and the mean fluorescence intensities were shown in right-up corner (black, PBS control; red, APOE treatment). Experiments were performed three times with similar results. p values were from two-tailed student t-test.
Extended Data Figure 10.
Extended Data Figure 10.. Anti-LILRB4 does not affect engraftment of normal hematopoietic cells.
a, Shown are LILRB4 and CD34 co-staining patterns for representative samples of human cord blood mononuclear cells (hCB MNCs). N/G, neutrophils and granulocytes; M/D, monocytes, macrophages and dendritic cells; L/P, lymphocytes, hematopoietic stem and progenitor cells. This experiment was repeated independently three times with similar results. b, Anti-LILRB4 antibody did not affect homing ability of normal hematopoietic progenitor cells. Human cord blood mononuclear cells (1×10⁷) were injected into NSG mice followed immediately by antibody treatment, and then the mice (n=3 mice with mean and s.e.m.) were sacrificed at 20 hrs after transplant. The number of CD45+CD34+ HSCs in liver, spleen, and bone marrow were normalized to that in peripheral blood as determined by flow cytometry. c-e, Anti-LILRB4 antibodies inhibited leukemia development in hCB-humanized NSG mice. c, Schematic of the experiment to test whether anti-LILRB4 antibody inhibits leukemia development in hCB-humanized NSG mice. d, Leukemia development was monitored over time by luminescence imaging. This experiment was repeated independently two times with similar results. e, Frequency of engrafted leukemia, normal human cells, including human B cells, human myeloid cells and human T cells in peripheral blood over time and hematopoietic tissues of hCB-humanized mice at the 24 days after leukemia transplantation. n=3 mice with mean and s.e.m. BM: bone marrow; LV: liver; SP: spleen; PB: peripheral blood. All p values were from two-tailed student t-test.
Figure 1.
Figure 1.. LILRB4 expressed on leukemia cells suppresses T cell proliferation.
a, LILRB4 surface expression was quantified by flow cytometry analysis of samples from 105 AML patients (n=1 to 34 for each classification (see Methods) with mean and s.e.m.). b, LILRB4 surface expression was compared on normal monocytes and neoplastic monocytes from the same AML patients (n=6 independent patients). MFI: mean fluorescence intensity. c, Autologous T cells (pT, patient T cells) isolated from a monocytic AML patient (AML#19) or allogeneic T cells (nT, normal T cells) isolated from a healthy donor were incubated with irradiated lilrb4-positive or lilrb4-negative primary leukemia cells from the AML patient (AML#19) (n=3 biologically independent samples with mean and s.e.m..Also see Source Data Figure 1.). d, T cells (E: effector cells) isolated from healthy donors were incubated with indicated irradiated THP-1 cells (T: target cells) in cell-contact manner (n=3 biologically independent samples with mean and s.e.m.). e-f, Engraftment of human T cells and i.v. transplanted Doxycycline (Dox)-inducible lilrb4-knockout THP-1 cells (GFP+) in NSG mice (n=5 mice). LV, liver; BM, bone marrow. g-i, Representative flow plots and quantification of human primary monocytic AML-xenografted mouse bone marrow after anti-LILRB4 antibody or control IgG treatment (n=8 biologically independent samples). This experiment was repeated with 16 independent patient samples with similar results (also see Extended Data Fig. 4a). See Methods for definition of box plot elements in e-i. All p values were from two-tailed student t-test.
Figure 2.
Figure 2.. LILRB4 promotes AML cell migration and infiltration.
a, Comparison of the transendothelial migration abilities of WT and lilrb4-KO THP-1 cells (GFP+) in a transwell assay (n=3 biologically independent samples with mean and s.e.m.). b, Comparison of the short-term (20 hrs) infiltration of WT or lilrb4-KO THP-1 cells in NSG mice (n=5 mice). The numbers of leukemia cells (GFP+) in liver (LV), spleen (SP), and bone marrow (BM) determined by flow cytometry and normalized to number in peripheral blood (PB). c-e, Comparison of the long-term (21 days) infiltration of WT or lilrb4-KO THP-1 cells in NSG mice (n=5 mice). Shown are percentages of THP-1 cells (hCD45+) engrafted in indicated organs at day 21 post-transplant (c), and overall survival (d) and body weights (e) as a function of time. f-j, Comparison of the transendothelial migration (f, n=3 biologically independent samples with mean and s.e.m.), short-term (20 hrs, g, n=5 mice) and long-term (16 days, h-j, n=5 mice) infiltration (h) of hlilrb4-C1498 or control C1498 cells (GFP+), and overall survival (i) and body weight (j) as a function of time. k, Comparison of the short-term (20 hrs) infiltration of indicated WT or modified THP-1 cells in NSG mice (n=5 mice). l-n, Comparison of the short-term (20 hrs) infiltration of human primary monocytic AML cells (AML#21) in NSG mice (n=4 mice) after treatment with anti-LILRB4 antibody or IgG control. See Methods for definition of box plot elements in b-c, e, g-h, j-n. All p values (except of d and i from long-rank test) were from two-tailed student t-test.
Figure 3.
Figure 3.. APOE is an extracellular binding protein of LILRB4.
a, Percentages of indicated LILRB reporter cells activated (GFP+) in the presence of 10% human serum, 10% mouse serum, or PBS control. b, Percentages of indicated LILRB reporter cells activated by recombinant APOE (10 μg/ml). Red dots indicate the PBS treatment of each indicated reporter cell line. c, Percentages of LILRB4 reporter cells activated by 10% mouse serum collected from wild-type or apoe-knockout KO mice or PBS control. d, Percentages of LILRB4 reporter cells activated by 10 μg/ml of APOE, APOE-POPC, APOA1, or APOA1-POPC. n=3 biologically independent samples with mean and s.e.m. in (a-d). e, Binding of His-tagged APOE to WT and lilrb4-KO THP-1 cells. f, Binding kinetics of human His-tagged APOE-3 to LILRB4-ECD were measured using microscale thermophoresis (MST). Upper panel: fluorescence intensity (Flu.Int.) plot and regression of the binding; lower panel: the corresponding residuals (Resi.) versus fits plot. g, Percentages of LILRB4 reporter cells activated by WT and mutant APOE proteins. Mut-N, R142A/K143A/R145A/K146A/R147A/R150A; Mut-C1, deletion of residues 245–299; and Mut-C2, deletion of residues 279–299. h, Percentages of indicated LILRB4 mutant reporter cells activated by APOE proteins. Data on LILRB4 mutants that interfere with ApoE activation are highlighted in red in (g-h, n=4 biologically independent samples, low-to-high outline and line at mean in box plots). i, T cells isolated from healthy donors were incubated with indicated irradiated THP-1 cells with or without lilrb4- or apoe-KO. T cells were analyzed by flow cytometry after 7 days (n=4 biologically independent samples). j-l, C57bl/6 mouse spleen cells (E) were incubated with irradiated human lilrb4-expressing (GFP-hlilrb4) or control (GFP) C1498 cells (T) at indicated E:T ratios. Cells were supplemented with 5% serum collected from WT or apoe-KO mice, cultured with anti-CD3/CD28-coated beads for 60 hours, and then stained with anti-CD3 antibody. Shown are representative flow plots from samples at E:T of 20:1 (j), percentages of CD3+ T cells (k, n=4 biologically independent samples with mean and s.e.m.), and the effects of APOE-POPC rescue of apoe-KO serum (l, n=4 biologically independent samples). m, Expression of human lilrb4 in mouse leukemia C1498 cells increases leukemia cell infiltration in WT recipient mice but not in apoe-KO recipient mice (n=5 mice). (e, j) These experiments were repeated independently three times with similar results. See Methods for definition of box plot elements in i, l-m. All p values were from two-tailed student t-test. n.s., not significant.
Figure 4.
Figure 4.. LILRB4-mediated intracellular signaling controls AML cell migration and T cell suppression.
a, Expression and phosphorylation of three phosphatases in wild-type and lilrb4-KO THP-1 cells. b, Primary T cells and irradiated indicated THP-1 cells were cultured in the lower and upper chambers respectively. T cells were analyzed by flow cytometry after 7 days. n=4 biologically independent samples. c-d, Knockout of shp-2 reduces THP-1 cell short-term (20 hrs) and long-term (21 days) infiltration in NSG mice (n=5 mice). e, Upstream transcription factor analysis of RNA-seq data generated from lilrb4-KO and WT THP-1 cells (n=2 biologically independent samples). Yellow dots highlighted the transcription factors involved in JAK/STATs and NF-κB pathways. f, Decreased phosphorylation of IKKα/β in lilrb4-KO THP-1 cells. g, Decreased NFκB in the nuclear fraction in lilrb4-KO THP-1 cells. h-i, The NF-κB inhibitor reversed T cell suppression by THP-1 cells (h) and decreased infiltration of MV4–11 cells (i) in an LILRB4-dependent manner (n=4 biologically independent samples). j, T cells isolated from healthy donors were supplemented with 25% condition medium (CM) of WT or lilrb4-KO THP-1 cells. Representative cells were photographed (scale bar, 100 μm) and T cells were analyzed by flow cytometry (n=4 biologically independent samples). k-l, T cells were incubated with irradiated indicated THP-1 cells supplemented with indicated concentration of recombinant uPAR (k) or ARG-1 (l) proteins for 7 days and were analyzed by flow cytometry (n=4 biologically independent samples). m, Overexpression of uPAR (plaur) or ARG1 rescued infiltration defect of lilrb4-KO MV4–11 cells (n=5 mice). (a, f-g, j) These experiments were repeated independently three times with similar results. See Methods for definition of box plot elements in (b-d, h-m). All p values were from two-tailed student t-test.

References

    1. Curran EK, Godfrey J & Kline J Mechanisms of Immune Tolerance in Leukemia and Lymphoma. Trends Immunol, doi:10.1016/j.it.2017.04.004 (2017). - DOI - PMC - PubMed
    1. Kang X et al. Inhibitory leukocyte immunoglobulin-like receptors: Immune checkpoint proteins and tumor sustaining factors. Cell Cycle 15, 25–40, doi:10.1080/15384101.2015.1121324 (2016). - DOI - PMC - PubMed
    1. Hirayasu K & Arase H Functional and genetic diversity of leukocyte immunoglobulin-like receptor and implication for disease associations. Journal of human genetics, doi:10.1038/jhg.2015.64 (2015). - DOI - PubMed
    1. Trowsdale J, Jones DC, Barrow AD & Traherne JA Surveillance of cell and tissue perturbation by receptors in the LRC. Immunol Rev 267, 117–136, doi:10.1111/imr.12314 (2015). - DOI - PubMed
    1. Dobrowolska H et al. Expression of immune inhibitory receptor ILT3 in acute myeloid leukemia with monocytic differentiation. Cytometry B Clin Cytom 84, 21–29, doi:10.1002/cyto.b.21050 (2013). - DOI - PubMed

Publication types

MeSH terms