Comparative Study
. 2018 Oct;562(7728):526-531.
doi: 10.1038/s41586-018-0623-z. Epub 2018 Oct 17.

Functional genomic landscape of acute myeloid leukaemia

Jeffrey W Tyner  1   2 Cristina E Tognon  2   3   4 Daniel Bottomly  2   5 Beth Wilmot  2   5   6 Stephen E Kurtz  2   3 Samantha L Savage  1   2 Nicola Long  2   3 Anna Reister Schultz  1   2 Elie Traer  2   3 Melissa Abel  1   2 Anupriya Agarwal  2   7 Aurora Blucher  2   5 Uma Borate  2   3 Jade Bryant  1   2 Russell Burke  2   3 Amy Carlos  2   8 Richie Carpenter  2   3 Joseph Carroll  2   9 Bill H Chang  2   10 Cody Coblentz  2   3 Amanda d'Almeida  1   2 Rachel Cook  2   3 Alexey Danilov  2   3 Kim-Hien T Dao  2   3 Michie Degnin  2   3 Deirdre Devine  2   3 James Dibb  2   3 David K Edwards 5th  1   2 Christopher A Eide  2   3   4 Isabel English  2   3 Jason Glover  2   10 Rachel Henson  2   8 Hibery Ho  2   3 Abdusebur Jemal  2   10 Kara Johnson  2   3 Ryan Johnson  2   3 Brian Junio  2   3 Andy Kaempf  2   11 Jessica Leonard  2   3 Chenwei Lin  2   8 Selina Qiuying Liu  2   3 Pierrette Lo  2   3 Marc M Loriaux  2   12 Samuel Luty  2   3 Tara Macey  2   3 Jason MacManiman  1   2 Jacqueline Martinez  1   2 Motomi Mori  2   11   13 Dylan Nelson  14 Ceilidh Nichols  2   3 Jill Peters  2   3 Justin Ramsdill  5   6 Angela Rofelty  1   2 Robert Schuff  5   6 Robert Searles  2   8 Erik Segerdell  2   5 Rebecca L Smith  2   3 Stephen E Spurgeon  2   3 Tyler Sweeney  2   3 Aashis Thapa  2   3 Corinne Visser  2   3 Jake Wagner  2   3 Kevin Watanabe-Smith  2   3 Kristen Werth  2   3 Joelle Wolf  2   10 Libbey White  2   5 Amy Yates  5   6 Haijiao Zhang  1   2 Christopher R Cogle  15 Robert H Collins  16 Denise C Connolly  17   18 Michael W Deininger  19 Leylah Drusbosky  15 Christopher S Hourigan  20 Craig T Jordan  21 Patricia Kropf  22 Tara L Lin  23 Micaela E Martinez  24 Bruno C Medeiros  25 Rachel R Pallapati  24 Daniel A Pollyea  21 Ronan T Swords  26 Justin M Watts  26 Scott J Weir  27   28 David L Wiest  29 Ryan M Winters  18 Shannon K McWeeney  30   31   32 Brian J Druker  33   34   35
Affiliations
Comparative Study

Functional genomic landscape of acute myeloid leukaemia

Jeffrey W Tyner et al. Nature. 2018 Oct.

Abstract

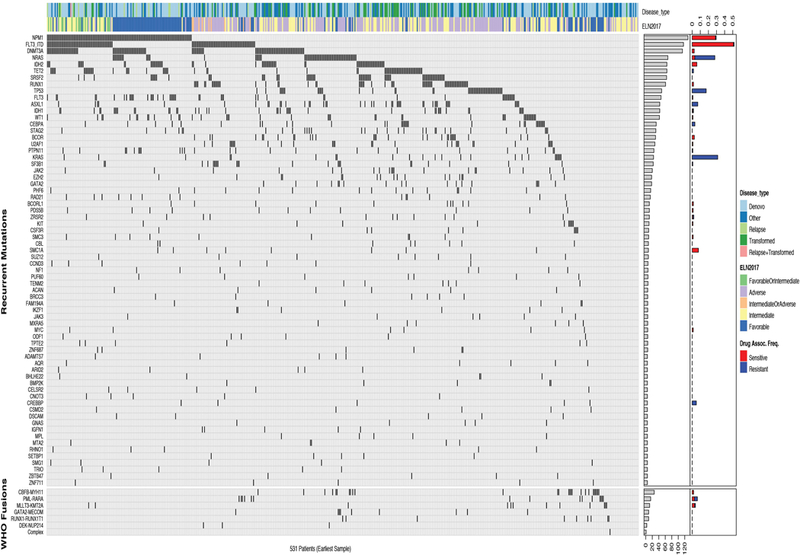
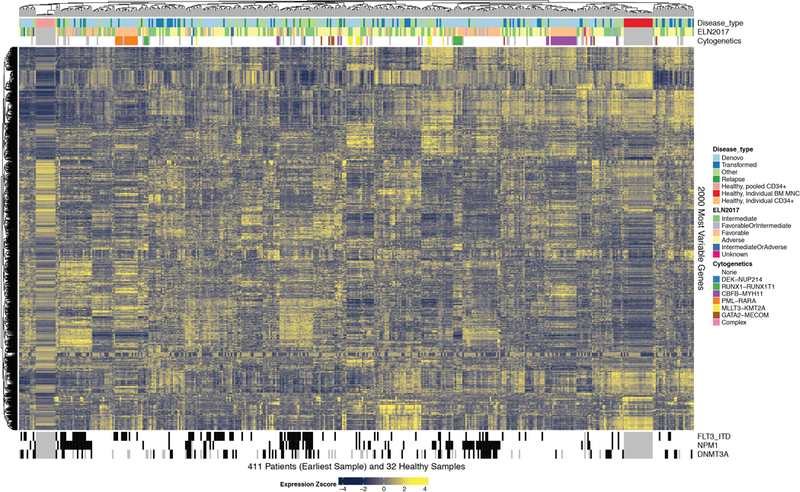
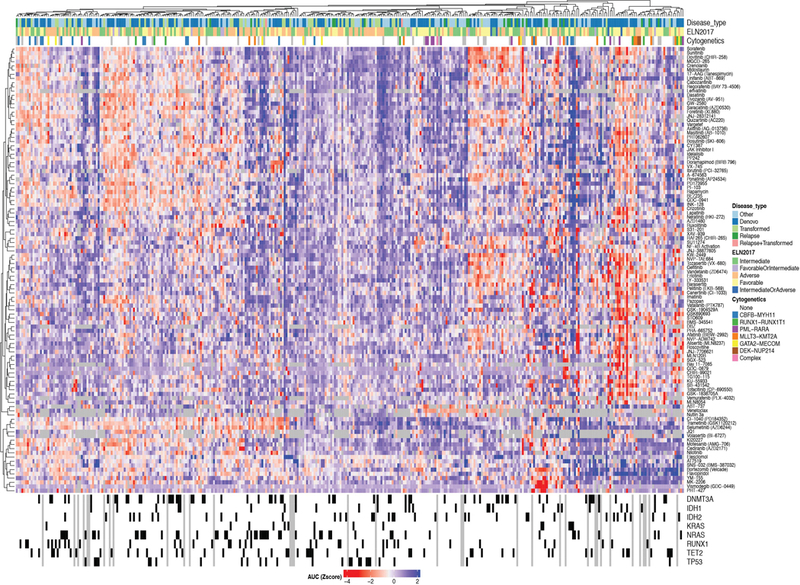
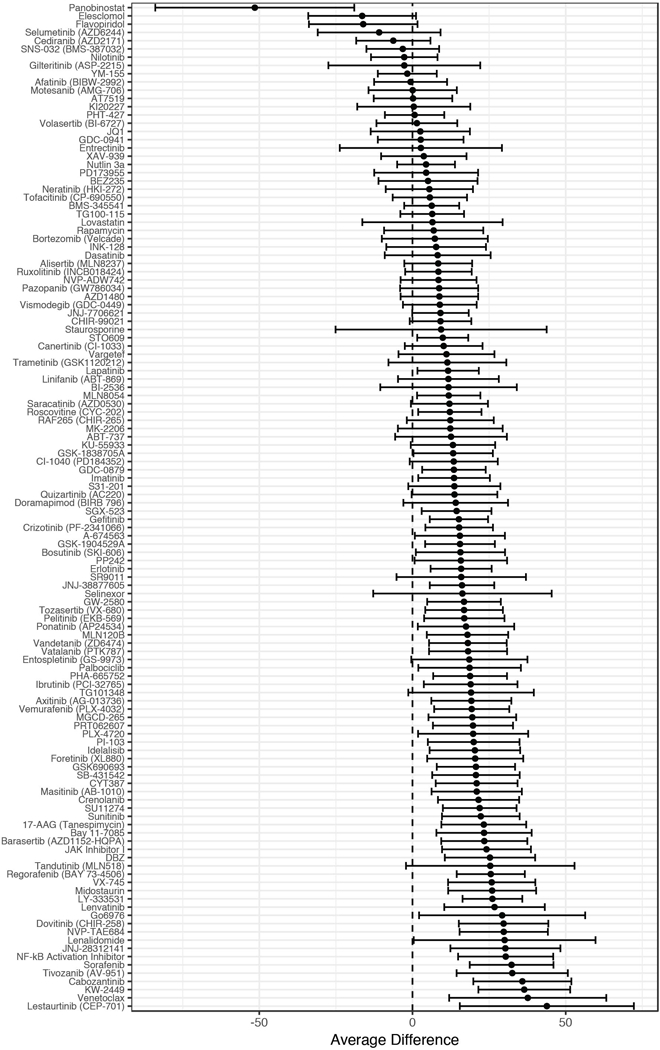
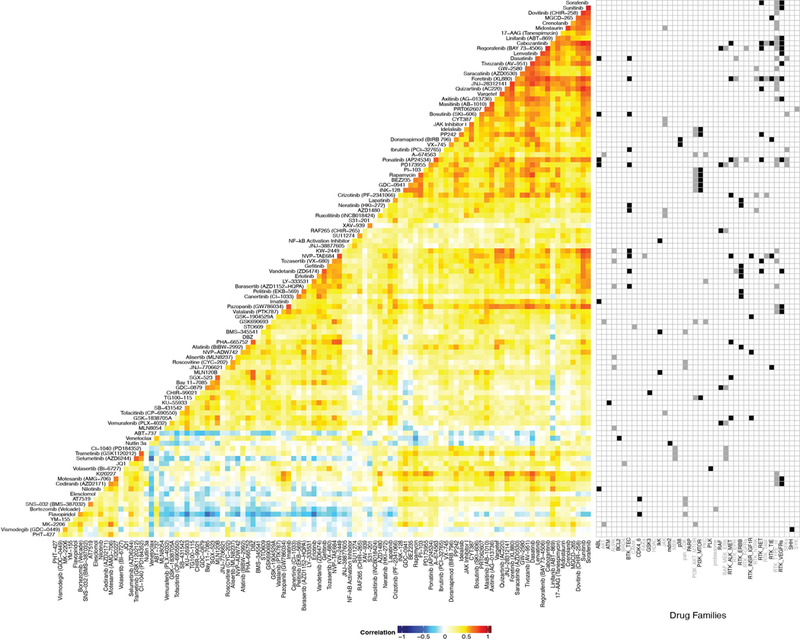
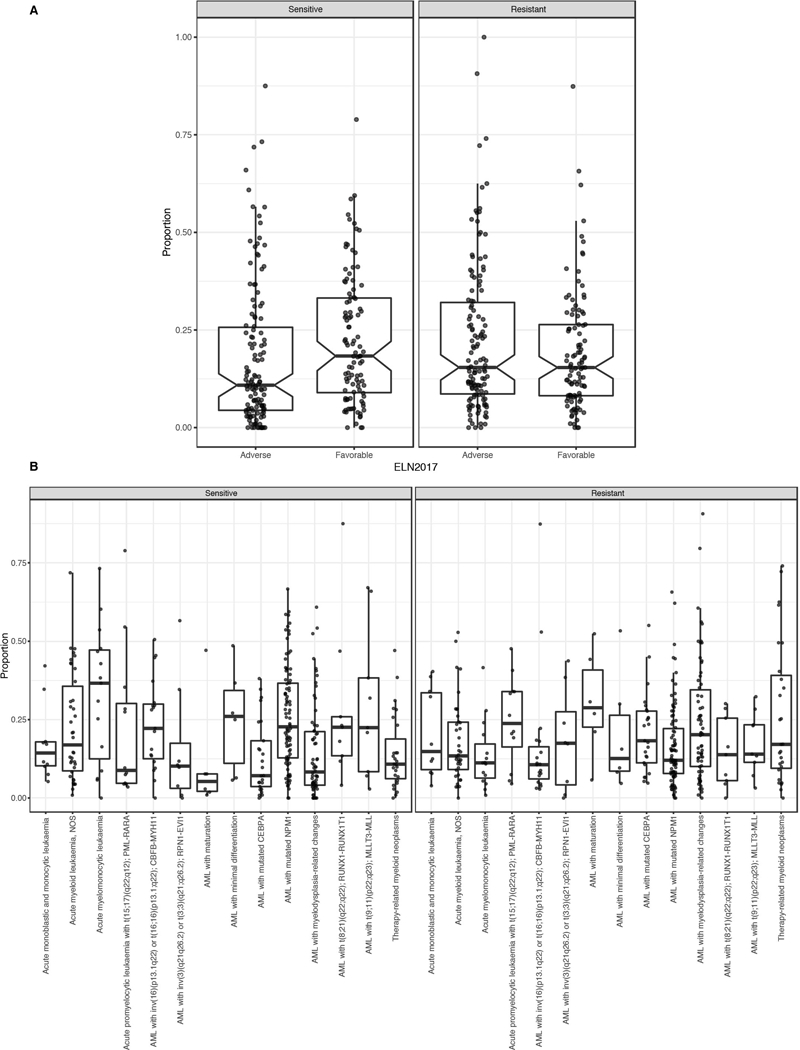
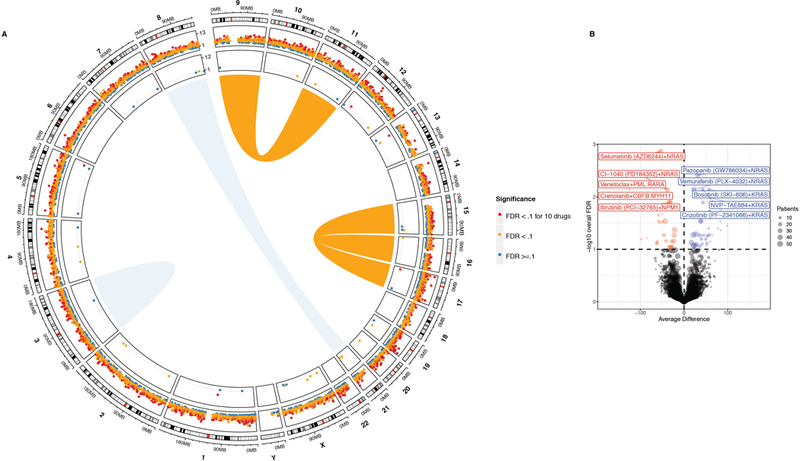
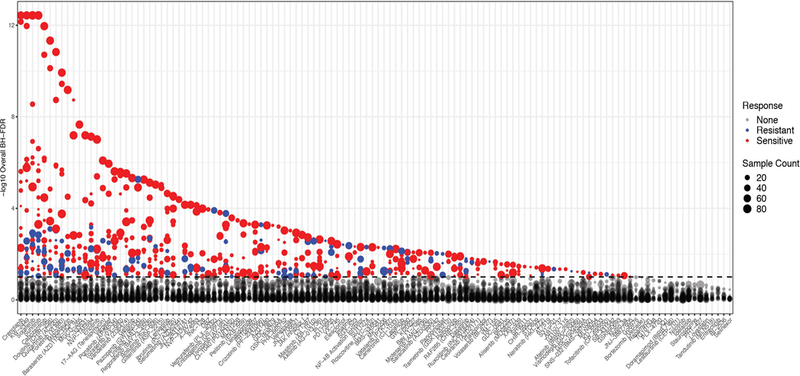
The implementation of targeted therapies for acute myeloid leukaemia (AML) has been challenging because of the complex mutational patterns within and across patients as well as a dearth of pharmacologic agents for most mutational events. Here we report initial findings from the Beat AML programme on a cohort of 672 tumour specimens collected from 562 patients. We assessed these specimens using whole-exome sequencing, RNA sequencing and analyses of ex vivo drug sensitivity. Our data reveal mutational events that have not previously been detected in AML. We show that the response to drugs is associated with mutational status, including instances of drug sensitivity that are specific to combinatorial mutational events. Integration with RNA sequencing also revealed gene expression signatures, which predict a role for specific gene networks in the drug response. Collectively, we have generated a dataset-accessible through the Beat AML data viewer (Vizome)-that can be leveraged to address clinical, genomic, transcriptomic and functional analyses of the biology of AML.


Figures

Extended Data Fig. 1.
Extended Data Fig. 1.. Genomic Landscape of the Beat AML Cohort.
622 specimens from 531 unique patients were subjected to whole exome sequencing. Automated and manual curation steps (described in the Methods, Supplementary Information, and at http://vizome.org/additional_figures_BeatAML.html) were used to arrive at a final set of high confidence variants (annotated in Supplementary Information, Table S7) and the earliest sample for each unique patient was used in this analysis. Clinical cytogenetics and gene fusion calls from RNA-sequencing were used to curate recurrent gene rearrangements (Supplementary Information). The mutational profile for each unique patient is shown with frequency ranked mutational events in the upper portion and frequency ranked gene rearrangements in the lower portion. The mosaic plot is annotated with clinical features of each case, such as diagnosis/relapse and de novo/transformed disease states and the first bar chart to the right summarizes the cohort frequencies of mutational and gene rearrangement events. The last bar chart on the right summarizes the frequency of significant drug/mutation associations for the given gene across the cohort with drug sensitivity displayed in red and drug resistance displayed in blue. Eleven genes not previously reported to be somatically mutated in cancer were observed with mutations at ~1% cohort frequency: CUB and Sushi multiple domains 2 (CSMD2), NAC alpha domain containing (NACAD), teneurin transmembrane protein 2 (TENM2), aggrecan (ACAN), ADAM metallopeptidase with thrombospondin type 1 motif 7 (ADAMTS7), immunoglobulin-like and fibronectin type III domain containing 1 (IGFN1), neurobeachin like 2 (NBEAL2), poly(U) binding splicing factor 60 (PUF60), zinc finger protein 687 (ZNF687), cadherin EGF LAG seven-pass G-type receptor 2 (CELSR2), and glutamate ionotropic receptor NMDA type subunit 2B (GRIN2B). For the n used to correlate each drug with mutations, please see Supplementary Information (Table S17).
Extended Data Fig. 2.
Extended Data Fig. 2.. Transcriptomic Landscape of the Beat AML Cohort.
451 specimens from 411 unique AML patients were subjected to RNA-sequencing. The 2,000 genes with greatest differential expression across these unique AML patients are displayed on the heatmap. The heatmap is annotated with disease type, ELN risk stratification groups, genetic, and cytogenetic features of disease as noted in the figure legend.
Extended Data Fig. 3.
Extended Data Fig. 3.. Functional Drug Sensitivity Landscape of the Beat AML Cohort.
409 specimens from 363 unique AML patients were subjected to an ex vivo drug sensitivity assay whereby freshly isolated mononuclear cells from blood or bone marrow of patient specimens were incubated with graded concentrations of 122 small-molecule inhibitors (7 dose points in addition to the no drug control). Probit curve fits were used to compute drug response metrics, and the z-score of area under the dose response curve is plotted for each unique patient specimen against each drug. Drug sensitivity (blue) and resistance (red) are annotated by a color gradient, with grey indicating no drug data available. The heatmap is annotated at the top and bottom with major clinical, cytogenetic, and genetic features of disease as noted in the figure legend.
Extended Data Fig. 4.
Extended Data Fig. 4.. Drug response in de novo versus transformed AML cases.
The average inhibitor response AUCs for all cases that were de novo (n=288) versus all cases that transformed from a background of MDS (n=111) were compared for every inhibitor having at least 3 cases with evaluable data in each group. The middle point represents the average difference in AUC between the two groups with the bars representing the 95% confidence interval. For the sample size and statistical results of each drug/sample group correlation please see Supplementary Information (Table S20).
Extended Data Fig. 5.
Extended Data Fig. 5.. Pairwise Drug Sensitivity Correlations and Association with Drug Family.
To understand patterns of small-molecule sensitivity against prior annotation of each drug’s gene and pathway targets, drugs were placed into drug families according to target genes and/or pathways and the Pearson’s correlation value of each drug was plotted onto a clustered heatmap showing drugs with similar or dissimilar patterns of sensitivity across the patient cohort. Prior knowledge annotation of the drug families to which each drug could be assigned is shown to the right of the heatmap with alternating black and grey boxes/labels used to aid in tracking. Descriptions of each drug family as well as the n used to calculate each pairwise drug correlation are found in Supplementary Information (Table S11,21).
Extended Data Fig. 6
Extended Data Fig. 6. Binary Drug Response Calls and Correlation with Clinical Subsets.
A. For the intersect of every specimen with evaluable response data for each inhibitor, we created a threshold for binary sensitive/resistant calls based on whether the individual specimen response fell within the most sensitive 20% of all specimens tested against that drug. A matrix plot showing the unsupervised clustering of the binary calls can be found at http://vizome.org/additional_figures_BeatAML.html. The binary drug resistance calls for each specimen were rolled up into a single value representing the proportion of drugs to which an individual specimen was sensitive (left) or resistant (right). Specimens were divided into Favorable and Adverse groups based on ELN 2017 criteria to determine whether overall drug sensitivity/resistance correlated with prognostic features of disease (n=233 patients). B. The binary drug resistance calls for each specimen as in panel B. Specimens were divided into diagnostic groups based on WHO 2016 categories to determine whether overall drug sensitivity/resistance correlated with cytogenetic or morphologic features of disease (n=340 patients). For both A and B the upper and lower points of the boxplots show 1.5 times the interquartile range (IQR) from the upper/lower lines while the upper, middle and bottom lines indicate the 75th, median and 25th percentile of the data with the notches extending 1.58 * IQR / sqrt(n). Specific sample sizes of each group are reported in Supplementary Information (Table S22).
Extended Data Fig. 7.
Extended Data Fig. 7.. Integration of Genetic Events with Drug Sensitivity.
(A) Circos plot showing AML rearrangements in the center, mutational events in the next concentric ring, and gene expression events in the outer ring. The size/width indicates frequency of the event and FDR-corrected q-value of association with drug sensitivity is color-coded (sensitivity (red); resistance (blue)). For each gene, tests involving expression were two-sided t-tests (linear model) of the differences between sensitive and resistant samples. For mutational events, the average difference in AUC between mutant/wild type samples was determined using two-sided t-tests from a linear model as shown in Fig 2A. FDR was computed using the Benjamini-Hochberg over all the drugs. The n used to correlate each mutational event with drug sensitivity is reported in the Supplementary Information (Table S17). (B) As in Fig. 2A, the average difference in AUC drug response between mutant and wild type cases was determined using a two-sided t-test from a linear model fit (plotted on the horizontal axis and FDR-corrected q-value is plotted on the vertical axis). The analysis here represents only FLT3-ITD negative cases. FDR was computed using the Benjamini-Hochberg (BH) over all the drugs. The n used to correlate each mutational event with drug sensitivity is reported in the Supplementary Information (Table S17). Expanded and interactive plots are available in our online data browser (www.vizome.org) and (http://vizome.org/additional_figures_BeatAML.html).
Extended Data Fig. 8.
Extended Data Fig. 8.. Integration of Drug Sensitivity with Genetic Events.
Correlation of drug sensitivity with mutational events. The average difference in AUC drug response between mutant and wild type cases was determined using a two-sided t-test from a linear model fit. FDR was computed using the BH over all the drugs. The degree of significance is represented on the vertical axis (sensitivity (red); resistance (blue)). The n used to correlate each mutational event with drug sensitivity is reported in the Supplementary Information (Table S17).
Extended Data Fig. 9.
Extended Data Fig. 9.. Functional Drug Sensitivity Landscape of the Beat AML Cohort.
A. Co-occurrences with regard to WGCNA gene expression clusters and/or mutational events (coefficients) were detected by multivariate modeling with respect to ibrutinib response (resistance (blue); sensitivity (red)) with degree of correlation quantified in top track stacked barplot. All coefficients that appear in 25% of the bootstrap sample sets are shown as segments of the circle. Segment width (the colored ring) corresponds to the percentage of bootstrap samples in which that coefficient appears (quantified above the dotted line). The variables appear in descending order clockwise starting at 12 o’clock. Each link indicates pairwise co-occurrence of mutational events and gene expression clusters (width represents frequency of the co-occurrence). The largest co-occurrence for each coefficient is quantified. B. The capacity of differential gene expression to distinguish the 20% most ibrutinib sensitive (n=46) from 20% most resistant (n=44) specimens is shown on a principle component plot (n=239 patient samples total tested for ibrutinib sensitivity and RNA-Sequencing). For the n used to correlate each drug with gene expression and perform Lasso regression, please see Supplementary Information (Table S17).
Fig. 1.
Fig. 1.. Comparative Genomic Landscape of AML.
(A) Frequency of the 33 mutational events that were cumulatively most frequent in Beat AML (n=531 patients) and TCGA (n=200 patients). Top row represents the full Beat AML cohort and the middle bar represents only the de novo Beat AML cases. Mutations were summarized by gene as was done by TCGA whereas the FLT3-ITD mutations were kept separate in the rest of this manuscript. (B) Mutational events at 2% frequency or less in the de novo cases of Beat AML and TCGA were compared for overlap. Venn diagram displays the overlap with the small circles within each compartment representing a size-scaled frequency of each mutational event. (C) Analysis as in panel B with only the non-de novo Beat AML cases versus TCGA. (D) Co-occurrence or exclusivity of the most recurrent mutational events in the Beat AML cohort (n=531 patients) were assessed using the DISCOVER method with a dot plot indicating the odds ratio of co-occurrence (blue) or exclusivity (red) using color-coding and circle size as well as asterisks that indicate FDR-corrected statistical significance.
Fig. 2.
Fig. 2.. Integration of Genetic Events with Drug Sensitivity.
(A) Average difference in AUC drug response between mutant and wild type cases was determined using a two-sided t-test from a linear model fit (plotted on the horizontal axis and FDR-corrected q-value is plotted on the vertical axis). FDR was computed using the Benjamini-Hochberg (BH) over all the drugs. The n used to correlate each mutational event with drug sensitivity is reported in the Supplementary Information (Table S17). Expanded and interactive plots are available in our online data browser (www.vizome.org) and (http://vizome.org/additional_figures_BeatAML.html). (B)Area under the curve for ibrutinib or entospletinib (n=277 or 168 patient samples, respectively) was plotted for cases with single, double, or triple mutation of FLT3-ITD, NPM1, and DNMT3A with the mean and one s.d. indicated by center and outer gray bars, respectively. An ANOVA was conducted using the Bonferroni approach (statistical results and sample size for all groups reported in Supplementary Information, Tables S18,19). (C) Inhibitors of JAK family kinases were assessed for activity against cases with BCOR mutation alone or BCOR in combination with SRSF2, RUNX1, or DNMT3A. The AUC values are plotted per case with the mean and one standard deviation indicated by center and outer gray bars, respectively. There was a significant difference in AUC by two-sided t-test (t(42)=−2.489, p=0.0168, 95% CI [−73.018, −7.643]) between BCOR and RUNX1 (n=16) versus the average of BCOR alone (n=16), BCOR and SRSF2 (n=8), and BCOR and DNMT3A (n=4).
Fig. 3.
Fig. 3.. Integration of Gene Expression and Drug Sensitivity Patterns.
Differential gene expression signature distinguishing the 20% most ibrutinib sensitive (n=46) from 20% most resistant (n=44) specimens. Heatmaps for all other drugs are available in our online data browser (http://vizome.org/additional_figures_BeatAML.html). For the n used to correlate each drug with gene expression, please see Supplementary Information (Table S17).

Comment in

  • Data Offer New Insights into AML.
    [No authors listed] [No authors listed] Cancer Discov. 2018 Dec;8(12):1498-1499. doi: 10.1158/2159-8290.CD-NB2018-147. Epub 2018 Nov 6. Cancer Discov. 2018. PMID: 30401682

References

    1. Jemal A, Siegel R, Xu J & Ward E Cancer statistics, 2010. CA: a cancer journal for clinicians 60, 277–300, (2010). - PubMed
    1. National Cancer Institute: Surveillance, Epidemiology, and End Results Program, <https://seer.cancer.gov/statfacts/html/amyl.html> (2018).
    1. Papaemmanuil E et al. Genomic Classification and Prognosis in Acute Myeloid Leukemia. N Engl J Med 374, 2209–2221, (2016). - PMC - PubMed
    1. Arber DA et al. The 2016 revision to the World Health Organization classification of myeloid neoplasms and acute leukemia. Blood 127, 2391–2405, (2016). - PubMed
    1. Dohner H et al. Diagnosis and management of AML in adults: 2017 ELN recommendations from an international expert panel. Blood 129, 424–447, (2017). - PMC - PubMed

Publication types

MeSH terms