. 2018 Nov;563(7729):117-120.
doi: 10.1038/s41586-018-0636-7. Epub 2018 Oct 17.

A mesocortical dopamine circuit enables the cultural transmission of vocal behaviour

Affiliations

A mesocortical dopamine circuit enables the cultural transmission of vocal behaviour

Masashi Tanaka et al. Nature. 2018 Nov.

Abstract

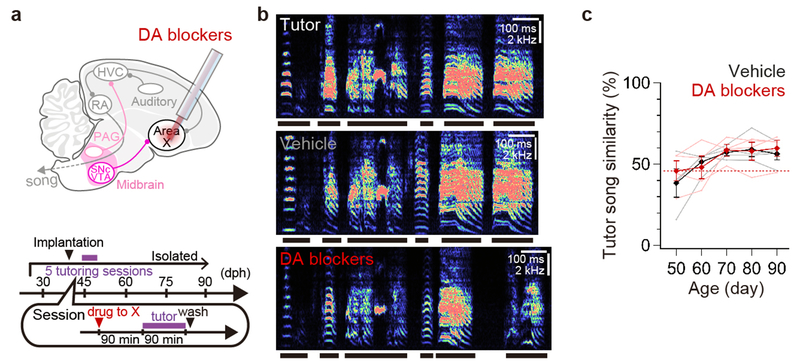
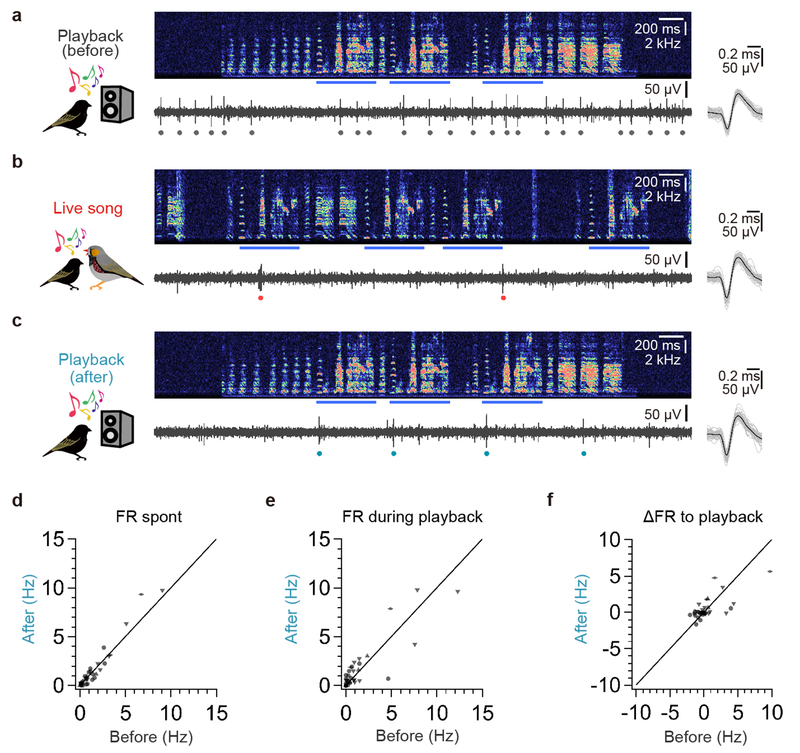
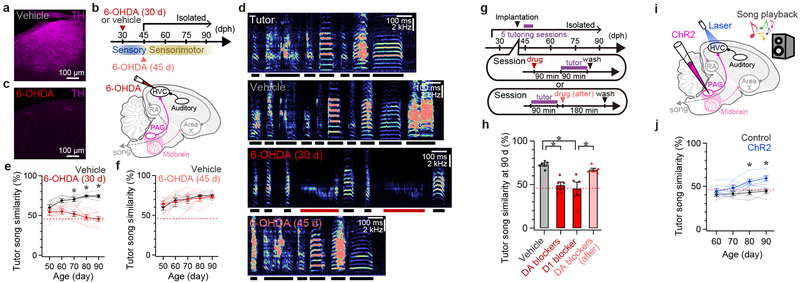
The cultural transmission of behaviour depends on the ability of the pupil to identify and emulate an appropriate tutor1-4. How the brain of the pupil detects a suitable tutor and encodes the behaviour of the tutor is largely unknown. Juvenile zebra finches readily copy the songs of the adult tutors that they interact with, but not the songs that they listen to passively through a speaker5,6, indicating that social cues generated by the tutor facilitate song imitation. Here we show that neurons in the midbrain periaqueductal grey of juvenile finches are selectively excited by a singing tutor and-by releasing dopamine in the cortical song nucleus HVC-help to encode the song representations of the tutor used for vocal copying. Blocking dopamine signalling in the HVC of the pupil during tutoring blocked copying, whereas pairing stimulation of periaqueductal grey terminals in the HVC with a song played through a speaker was sufficient to drive copying. Exposure to a singing tutor triggered the rapid emergence of responses to the tutor song in the HVC of the pupil and a rapid increase in the complexity of the song of the pupil, an early signature of song copying7,8. These findings reveal that a dopaminergic mesocortical circuit detects the presence of a tutor and helps to encode the performance of the tutor, facilitating the cultural transmission of vocal behaviour.


Conflict of interest statement

Competing interests

F.S. and Y.L. have filed patent applications whose value might be affected by this publication.

Figures

Extended Data Figure 1 |
Extended Data Figure 1 |. Distribution of HVC-projecting neurons and Area X-projecting neurons in the midbrain.
a, From left to right, a max-projected image of serial sagittal sections visualized with a confocal microscope, showing a lateral part of PAG (lPAG) (~1.0 mm lateral), a medial part of PAG (mPAG, ~0.2 mm lateral), SNc (~1.2 mm lateral), and VTA (~0.2 mm lateral), each of which was labeled with dextran injected into HVC (green) and an antibody for TH (pseudo-colored magenta). Similar results were obtained in 4 independently repeated experiments (R: rostral, V: ventral). b, Proportion of HVC-projecting neurons in PAG and VTA/SNc (χ2-test: χ2(1) = 406.54, P < 0.001, n = 4 hemispheres from 3 birds). c, Proportion of TH-positive (TH+) neurons in HVC-projecting neuron subsets in PAG and VTA/SNc (χ2-test: χ2(1) = 204.62, P < 0.001, n = 4 hemispheres from 3 birds). d, From left to right, a max-projected image of serial sagittal sections visualized with a confocal microscope, showing PAG (~0.6 mm lateral), SNc (~0.6 mm lateral), and VTA (~0.2 mm lateral), each of which was labeled with dextran injected into Area X (green) and an antibody for TH (pseudo-colored magenta). Similar results were obtained in 3 independently repeated experiments. e, Proportion of double-labeled neurons (dextran and TH) in PAG and SNc/VTA (χ2-test: χ2(1) = 493.92, P < 0.001, n = 3 hemispheres from 3 birds) in birds that received injection of dextran into Area X. f, Proportion of Area X-projecting neurons in PAG and VTA/SNc (χ2-test: χ2(1) = 472.07, P < 0.001, n = 3 hemispheres from 3 birds). g, Proportion of TH+ neurons in Area X-projecting neuron subsets in PAG and VTA/SNc (χ2-test: χ2(1) = 55.14, P < 0.001, n = 3 hemispheres from 3 birds). Error bars indicate mean ± SEM.
Extended Data Figure 2 |
Extended Data Figure 2 |. Juvenile male PAG activity in response to song playback in the presence of a female bird and live songs of a male bird.
a, Tutor-naive juvenile male finch PAG activity aligned to the onset of 35 presentations of song playback in the presence of an adult female bird (top: averaged sound spectrogram, middle: spike raster plot, bottom: mean firing rate). b, Mean firing rate (FR) during presentation of song playback in the presence of a female bird, normalized to baseline FR (two-sided paired t-test: t(7) = 0.620, P = 0.555; n = 8 neurons from 2 birds). c, PAG activity during a tutor song bout (top: sound spectrogram, middle: voltage recording, bottom: firing rate, blue bar: song motif). d, PAG unit activity aligned to the offset of a live tutor’s song bouts (red bar: live song), shown as in a. e, A max-projected image of serial sagittal sections visualized with a confocal microscope, showing the site of tetrode recordings in PAG (~0.8 mm lateral of the midline). f, PAG unit activity aligned to the onset of live tutor’s song motifs, shown as in a. Note that the tutor often sings multiple motifs within a single bout, thus some motifs precede (and follow) the alignment time. Error bars indicate mean ± SEM.
Extended Data Figure 3 |
Extended Data Figure 3 |. Effects of 6-OHDA injection into HVC on DA fibers in HVC and surrounding regions and on noradrenergic/adrenergic fibers in HVC
a, From left to right, a max-projected image of serial sagittal sections visualized with a confocal microscope, showing HVC with TH immunolabeling (~2.4 mm lateral), HVC shelf and caudolateral nidopallium (NCL) just ventral to HVC with TH immunolabeling (~2.4 mm lateral), and HVC with dopamine beta-hydroxylase (DBH) immunolabeling (~2.4 mm lateral) in control birds, which received injection of vehicle into HVC. Similar results were obtained in 5 independently repeated experiments (orientation is similar to b). b, From left to right, a max-projected image of serial sagittal sections visualized with a confocal microscope, showing HVC with TH immunolabeling (~2.4 mm lateral), HVC shelf and NCL just ventral to HVC with TH immunolabeling (~2.4 mm lateral), and HVC with DBH immunolabeling (~2.4 mm lateral) in birds that received injection of 6-OHDA into HVC 2 days before tissue fixation. Similar results were obtained in 4 independently repeated experiments (D: dorsal, R: rostral). c, Density of TH-positive (TH+) fibers in HVC of control birds (n = 5 hemispheres from 3 birds) was higher than that of birds that received injections of 6-OHDA 2 days before fixation (Tukey-Kramer test: P = 0.002) (n = 4 hemispheres from 2 birds), and that of birds that received injections of 6-OHDA ~60 days before fixation, as in Fig. 3b-c (Tukey-Kramer test: P = 0.002) (n = 6 hemispheres from 4 birds). d, Density of TH+ fibers in HVC shelf and NCL in control birds (n = 5 hemispheres from 3 birds), birds that received injection of 6-OHDA 2 days before fixation (n = 4 hemispheres from 2 birds), and birds that received injection of 6-OHDA ~60 days before fixation, as in Fig. 3b-c (n = 6 hemispheres from 4 birds). e, Density of DBH-positive (DBH+) fibers in HVC in control birds (n = 4 hemispheres from 2 birds) and birds that received injection of 6-OHDA 2 days before injection (n = 4 hemispheres from 2 birds) was not significantly different (two-sided unpaired t-test: t(7) = 0.379, P = 0.716). Error bars indicate mean ± SEM.
Extended Data Figure 4 |
Extended Data Figure 4 |. Ablation of DA terminals in HVC did not affect song rate but decreased song imitation to the level of birds raised in isolation from a tutor.
a, The song rates of birds that received injection of vehicle (n = 7), 6-OHDA at ~30 d (n = 7), and 6-OHDA at ~45 d (n = 6) were not significantly different (one-way ANOVA: F(2,17) = 0.283, P = 0.757). b, Spectrograms from a 90-d bird that was raised in isolation from a tutor (top) and from a 90-d bird that was normally tutored but received injection of 6-OHDA into HVC at 30 d (bottom). c, Similarity of 90-d untutored (Isolated) birds’ songs to songs of unrelated adult zebra finches that had been normally tutored (n = 3) was not significantly different from tutor song similarity of 90-d pupils that received injection of 6-OHDA into HVC at ~30 d (n = 7) (two-sided unpaired t-test: t(9) = 0.013, P = 0.990), but was significantly different from tutor song similarity of 90-d pupils that received injection of vehicle at ~30 d (n = 7) (t(9) = 3.028, P = 0.014), or from tutor song similarity of 90-d pupils that received injection of 6-OHDA into HVC at ~45 d (n = 6) (two-sided unpaired t-test: t(8) = 3.314, P = 0.011) (song data from birds injected with 6-OHDA into HVC at ~30 d is same as Fig. 3e; song similarity data from birds injected in HVC with vehicle at ~30 d or 6-OHDA at ~45 d are not shown here but are shown in Fig. 3f). Error bars indicate mean ± SEM.
Extended Data Figure 5 |
Extended Data Figure 5 |. Effects of infusing DA blockers into HVC or CM and infusing muscimol into PAG on song copying.
a, Schematics showing infusion of DA blockers into HVC. b, From top to bottom, sound spectrograms of a song of a tutor bird, a 90-d pupil that received infusion of vehicle during tutoring sessions, a 90-d pupil that received infusion of both D1- and D2-type DA blockers (DA blockers) during tutoring sessions, a 90-d pupil bird that received infusion of D1-type blocker during tutoring sessions, and 90-d pupil that received infusion of both D1- and D2-type DA blockers after tutoring sessions. c, Developmental changes in tutor song similarity of pupils that received infusion of both D1- and D2-type DA blockers (DA blockers) into HVC during tutoring sessions (top, n = 5), a D1-type blocker into HVC during tutoring sessions (middle, n = 5), or DA blockers into HVC immediately after tutoring sessions (bottom, n = 5). Asterisks indicate P < 0.050 with Tukey-Kramer test (See Methods). d, Proportion of time that juvenile birds attended to the tutor during tutoring sessions was not significantly different between birds that received vehicle (n = 3) or DA blockers into HVC (n = 4) (Tukey-Kramer test: P = 0.871). The attention time of juvenile birds that received infusion of muscimol into PAG (n = 3) was lower than that of control birds (Tukey-Kramer test: P = 0.001) and that of birds that received injection of DA blockers into HVC (Tukey-Kramer test: P < 0.001). e, Singing rates of the tutor bird to pupils that received vehicle into HVC (n = 5) were not different from that to pupils that received injection of DA blockers into HVC (n = 5) or muscimol into PAG (n = 3) (one-way ANOVA: F(2,10) = 0.776, P = 0.486). f, Schematics showing infusion of muscimol into PAG. g, A sound spectrogram of a song of a 90-d pupil that received infusion of muscimol into PAG during tutoring sessions. A sound spectrogram of the tutor song is shown in b. h, Tutor song similarity of pupil birds that received infusion of vehicle into HVC and birds that received infusion of muscimol blockers into PAG were significantly different (Tukey-Kramer test: vehicle: n = 5, muscimol to PAG: n = 3; at 90 d: P = 0.007). i, Schematics showing infusion of DA blockers into CM (DA blockers possibly diffused into both the medial and lateral CM). j, A sound spectrogram of a song of a 90-d pupil that received infusion of DA blockers into CM during tutoring sessions. A sound spectrogram of the tutor song is shown in b. k, Tutor song similarity of pupil birds that received infusion of vehicle into HVC and birds that received infusion of DA blockers into CM were not significantly different (Tukey-Kramer test: vehicle: n = 5, DA blockers to CM: n = 3; at 90 d: P = 1.000). Horizontal red dashed lines in c, h, and k show song similarity between 90-d untutored birds and unrelated adult male zebra finches that had been raised with normal exposure to a tutor (See Extended Data Fig. 4b-c). Error bars indicate mean ± SEM.
Extended Data Figure 6 |
Extended Data Figure 6 |. Infusion of DA blockers into Area X in juvenile males did not disrupt song copying.
a, Schematics (top) and schedule (bottom) of infusion of DA blockers into Area X. b, Sound spectrograms of a song of a tutor (top), a 90-d bird that received infusion of vehicle into Area X during tutoring sessions (middle), and a 90-d bird that received infusion of DA blockers into Area X during tutoring sessions (bottom). c, Tutor song similarity of pupil birds that received infusion of vehicle into Area X and birds that received infusion of DA blockers into Area X were not significantly different (Tukey-Kramer test: vehicle: n = 4, DA blockers: n = 4; at 90 d: P = 1.000). The horizontal red dashed line shows song similarity between 90-d untutored birds and unrelated adult male zebra finches that had been raised with normal exposure to a tutor (See Extended Data Fig. 4b-c). Error bars indicate mean ± SEM.
Extended Data Figure 7 |
Extended Data Figure 7 |. Optogenetic activation of PAGHVC terminals paired with song playback.
a, Schematics (left) and schedule (right) of optogenetic stimulation of PAGHVC terminals paired with song playback. b, Sound spectrograms of song playback used in tutoring sessions (top), a song of a 90-d pupil tutored by song playback without viral injection and laser stimulation (upper middle), and 90-d pupils that received activation of PAGHVC terminals paired with song playback (lower middle and bottom). c, From left to right, a max-projected image of serial sagittal sections of PAG (left, ~0.5 mm lateral), showing PAG neurons expressing both ChR2 (green) and TH (pseudo-colored magenta) (arrows), SNc (middle, ~0.8 mm lateral), and VTA (right, ~0.3 mm lateral). Similar results were obtained in 6 independently repeated experiments. d, Multiunit activity in PAG, showing time-locked response to laser stimulation at 2 Hz (top) and 20 Hz (bottom). e, Schematics of optogenetic stimulation of PAGHVC terminals paired with song playback while infusing DA blockers into HVC. f, Tutor song similarity of pupils that received activation of PAGHVC terminals paired with song playback while infusing DA blockers into HVC (red, n = 3) was not different from control birds shown in Fig. 3j (Tukey-Kramer test: at 90 d: P = 1.000), but lower than that received activation of PAGHVC terminals paired with song playback shown in Fig. 3j (Tukey-Kramer test: at 90 d: P = 0.019). g, A sound spectrogram of a 90-d pupil that received optogenetic activation of PAGHVC terminals paired with song playback while infusing DA blockers into HVC. A sound spectrogram of the song playback used in tutoring sessions is shown in b. Error bars indicate mean ± SEM.
Extended Data Figure 8 |
Extended Data Figure 8 |. Spike activity of HVC neurons in juvenile male zebra finches before and after their first exposure to live tutor songs.
a-c, Action potential activity of an HVC neuron to tutor song playback before exposure to a singing tutor (a), to live tutor songs (b), and to tutor song playback after exposure to live tutor songs (c) (top: sound spectrogram, bottom: voltage recording, bottom right: exemplar 50 spikes [gray] and their average [black]. circle: individual spike. blue bar: tutor song motif). d, Spontaneous firing rate (FR spont) of HVC neurons of juvenile males before and after exposure to live tutor songs (two-sided paired t-test: Mean FR. Before: 1.6 ± 0.3 Hz; After: 1.6 ± 0.4 Hz; t(34) = 0.794, P = 0.433, n = 35, 4 birds). e, Firing rate of juvenile male HVC neurons during playback of tutor songs (FR during playback) before and after exposure to live tutor songs (two-sided paired t-test: Mean FR. Before: 2.0 ± 0.6 Hz; After: 2.1 ± 0.6 Hz; t(34) = 0.468, P = 0.643, n = 35, 4 birds). f, Changes in firing rate (ΔFR) of juvenile HVC neurons in response to playback of tutor songs before and after exposure to live tutor songs (two-sided paired t-test: ΔFR. Before: 0.5 ± 0.4 Hz; After: 0.5 ± 0.2 Hz; t(34) = 0.079, P = 0.937, n = 35, 4 birds).
Extended Data Figure 9 |
Extended Data Figure 9 |. Song rates of juvenile birds before and after their first tutoring sessions.
a, Ratio of song bouts produced before and after the first tutoring session in control birds (black, n = 6) and in birds that received injection of 6-OHDA injections into HVC several days prior to the tutoring session or that were infused with DA blockers into HVC immediately before and during the tutoring session (red, n = 6) . Error bars indicate mean ± SEM.
Extended Data Figure 10 |
Extended Data Figure 10 |. Summary diagram.
a, The song of a live adult tutor (i.e., a suitable model) activates auditory afferents and DA-releasing PAG afferents to HVC, leading to potentiation and stabilization of auditory synapses in HVC. This plastic change forms temporally precise coding of the tutor songs and increases the occurrence of bursting activity in HVC, which rapidly alters temporal and spectral features of the pupil’s vocalization in manner that drives imitation. b, Playback of an adult male song without social cues (i.e., extraneous sound) only activates auditory afferents in HVC. The activation of these auditory inputs by itself can neither alter HVC activity nor drive song learning, similar to the condition where DA signaling in the pupil’s HVC is blocked during the juvenile’s exposure to a live, singing tutor.
Figure 1 |
Figure 1 |. Recordings of PAG activity.
a, Schematics of dextran injection into HVC. b, PAG neurons labeled with dextran (green) and TH antibody (pseudo-colored magenta) (~0.5 mm lateral, R: rostral, V: ventral). c, Proportion of double-labeled neurons (dextran and TH) in the midbrain (χ2-test: χ2(1) = 623.02, P < 0.001, n = 4 hemispheres from 3 birds). d, Schematics of tetrode recordings from PAG neurons. e, PAG unit activity during live tutor songs (red bar) (gray bar: an isolated tutor call) (top: sound spectrogram, middle: voltage recording, bottom: firing rate). f, PAG unit activity aligned to the onset of tutor songs (top: averaged spectrogram, middle: spike raster, bottom: mean firing rate). g, Mean firing rate (FR) during live tutor songs as a function of baseline FR of PAG neurons. h-j, PAG unit activity aligned to the onset of song playback (h), encounters with a live, non-singing tutor (i), encounters with a live female (j), shown as in f. k, Mean FR of PAG neurons normalized to baseline FR (two-sided paired t-test: Live song: t(21) = 3.439, P = 0.002; Playback: t(25) = 0.278, P = 0.783; Live tutor: t(21) = 1.270, P = 0.218; Live female: t(19) = 1.339, P = 0.196; n = 26 neurons, 5 birds). Error bars indicate mean ± SEM.
Figure 2 |
Figure 2 |. Imaging of DA in HVC.
a, Schematics of two-photon imaging of DA sensors (GRABDA1h) in HVC. b, Two-photon image of HVC neurons expressing DA sensors. c, Fluorescence changes (ΔF/F) of GRABDA1h in a juvenile’s HVC neuron in response to live tutor songs (red bars) d, ΔF/F aligned to the onset of live tutor songs (gray: individual, black: mean). e-h, ΔF/F aligned to the onset of song playback (e), encounters with a live, non-singing tutor (f), encounters with a live female (g), and live tutor songs after 6-OHDA injection into PAG (h). i, Mean ΔF/F of HVC neurons (two-sided paired t-test: Live song: t(4) = 3.660, P = 0.022; Playback: t(4) = 0.261, P = 0.807; Live tutor: t(4) = 1.092, P = 0.336; Live female: t(4) = 1.589, P = 0.187; Live song after 6-OHDA injection into PAG: t(7) = 1.122, P = 0.324; n = 13 neurons, 5 birds). Error bars indicate mean ± SEM.
Figure 3 |
Figure 3 |. Chemical blockade and optogenetic activation of DA signaling in HVC.
a, DA fibers in HVC (pseudo-colored magenta: TH) (~2.4 mm lateral). b, Timeline and schematics of 6-OHDA injection into HVC. c, Loss of DA fibers in HVC after 6-OHDA injection at 29 d, as in a (~2.4 mm lateral). d, From top to bottom, spectrograms of a song from the tutor bird and songs from 90-d pupil birds that received injection into HVC of vehicle, 6-OHDA at ~30 d, or 6-OHDA at ~45 d (red bars denote abnormally long syllables. See Extended Data Fig. 4b-c). e, Absence of song copying following injection of 6-OHDA into HVC at ~30 d (Tukey-Kramer test: vehicle: n = 7, 6-OHDA: n = 7; at 90 d: P < 0.001). f, Normal levels of song copying were achieved following injection of 6-OHDA into HVC at ~45 d (Tukey-Kramer test: vehicle: n = 7 [same birds as in e], 6-OHDA at 45 d: n = 6; at 90 d: P = 1.000). g, Timeline of DA blocker infusion into HVC using microdialysis. h, Tutor song similarity of 90-d pupils that received infusion into HVC of vehicle during tutoring (n = 5), DA blockers during tutoring (Tukey-Kramer test: vs. vehicle: P = 0.011, n = 5), D1-type blocker during tutoring (Tukey-Kramer test: vs. vehicle: P < 0.001, n = 5), or DA blockers after tutoring (Tukey-Kramer test: vs. vehicle: P = 1.000; n = 5). i, Schematics of PAGHVC terminal activation paired with song playback. j, Song copying is facilitated by pairing playback with PAGHVC terminal activation in tutor-naive juveniles (Tukey-Kramer test: ChR2: n = 6; control: n = 6; at 90 d: P = 0.023). Horizontal red dashed lines in e, f, h, and j show song similarity between 90-d untutored birds to unrelated adults (See Extended Data Fig. 4b-c). Error bars indicate mean ± SEM.
Figure 4 |
Figure 4 |. Changes in HVC activity and song features after live tutoring.
a, Schematic of HVC recordings in pupils. b-c, Spontaneous HVC unit activity (b) and the histogram of the interspike intervals before (black) and after (cyan) live tutoring (c). d, HVC unit activity aligned to tutor song motif onset (top: averaged spectrogram; middle: raster, bottom: mean FR across trials; horizontal bars: syllables). e, Probability of burst activity (>100 Hz) increased after live tutoring in control juveniles (two-sided paired t-test: t(34) = 2.490, P = 0.018, n = 35 neurons, 4 birds), but not in juveniles with 6-OHDA injected into HVC (two-sided paired t-test: t(13) = 0.774, P = 0.453, n = 14 neurons, 2 birds). f, Coefficients of variance (CV) of firing rate across trials increased in control juveniles (two-sided paired t-test: t(25) = 4.080, P < 0.001, n = 26 neurons, 4 birds), but not in juveniles with 6-OHDA injected into HVC (two-sided paired t-test: t(10) = 0.640, P = 0.537, n = 11 neurons, 2 birds). g, Spectrograms of juvenile songs before (top) and after (bottom) live tutoring (red bar: long vocalization). h, After live tutoring, kurtosis of vocal duration decreased in control juveniles (two-sided paired t-test: 1.5 h: t(5) = 5.563, Bonferroni corrected P = 0.008, n = 6), but not in juveniles with 6-OHDA or DA blockers injected into HVC (two-sided paired t-test: 1.5 h: t(5) = 1.364, Bonferroni corrected P = 0.692, n = 6). i, After live tutoring, mean Wiener entropy variance (EV) increased in control juveniles (two-sided paired t-test: at 1.5 h: t(5) = 4.059, Bonferroni corrected P = 0.029, n = 6), but not in juveniles with 6-OHDA or DA blockers injected into HVC (two-sided paired t-test: at 1.5 h: t(5) = 1.432, Bonferroni corrected P = 0.635, n = 6). Juveniles did not sing during tutoring (0–1.5 h. See Extended Data Fig. 9). Error bars indicate mean ± SEM.

Similar articles

Cited by

References

    1. Whiten A Social Learning and Culture in Child and Chimpanzee. Annu Rev Psychol 68, 129–154, doi:10.1146/annurev-psych-010416-044108 (2017). - DOI - PubMed
    1. Goldstein MH, King AP & West MJ Social interaction shapes babbling: Testing parallels between birdsong and speech. Proceedings of the National Academy of Sciences of the United States of America 100, 8030–8035, doi:10.1073/pnas.1332441100 (2003). - DOI - PMC - PubMed
    1. Marler P & Tamura M Culturally Transmitted Patterns of Vocal Behavior in Sparrows. Science 146, 1483–&, doi:DOI10.1126/science.146.3650.1483 (1964). - DOI - PubMed
    1. Fehér O, Wang HB, Saar S, Mitra PP & Tchernichovski O De novo establishment of wild-type song culture in the zebra finch. Nature 459, 564–U594, doi:10.1038/nature07994 (2009). - DOI - PMC - PubMed
    1. Chen Y, Matheson LE & Sakata JT Mechanisms underlying the social enhancement of vocal learning in songbirds. Proceedings of the National Academy of Sciences of the United States of America 113, 6641–6646, doi:10.1073/pnas.1522306113 (2016). - DOI - PMC - PubMed

Method references

    1. Tchernichovski O, Nottebohm F, Ho CE, Pesaran B & Mitra PP A procedure for an automated measurement of song similarity. Anim Behav 59, 1167–1176, doi:10.1006/anbe.1999.1416 (2000). - DOI - PubMed

Publication types