

Dyspnea and the Varying Pathophysiologic Manifestations of Chronic Obstructive Pulmonary Disease Evaluated by Cardiopulmonary Exercise Testing With Arterial Blood Analysis
- PMID: 30333757
- PMCID: PMC6176099
- DOI: 10.3389/fphys.2018.01293
Dyspnea and the Varying Pathophysiologic Manifestations of Chronic Obstructive Pulmonary Disease Evaluated by Cardiopulmonary Exercise Testing With Arterial Blood Analysis
Abstract
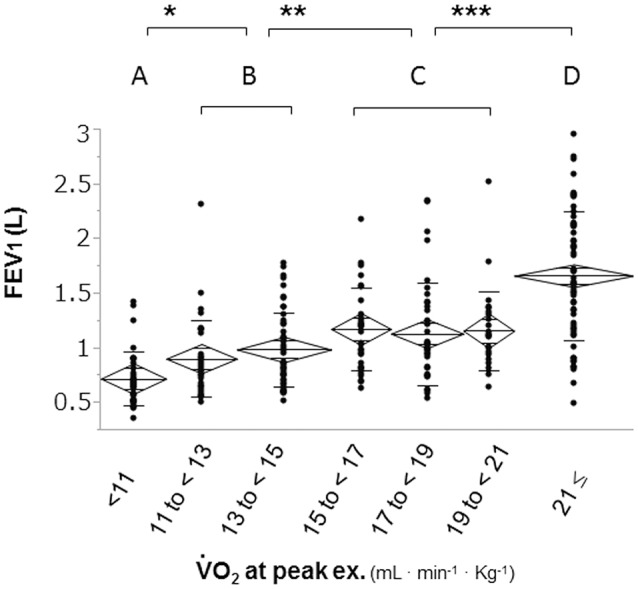
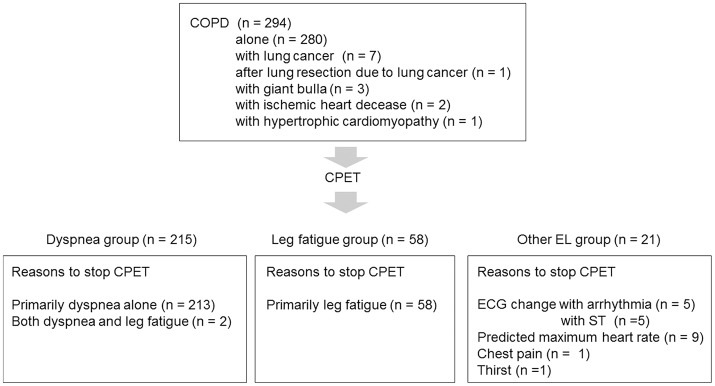
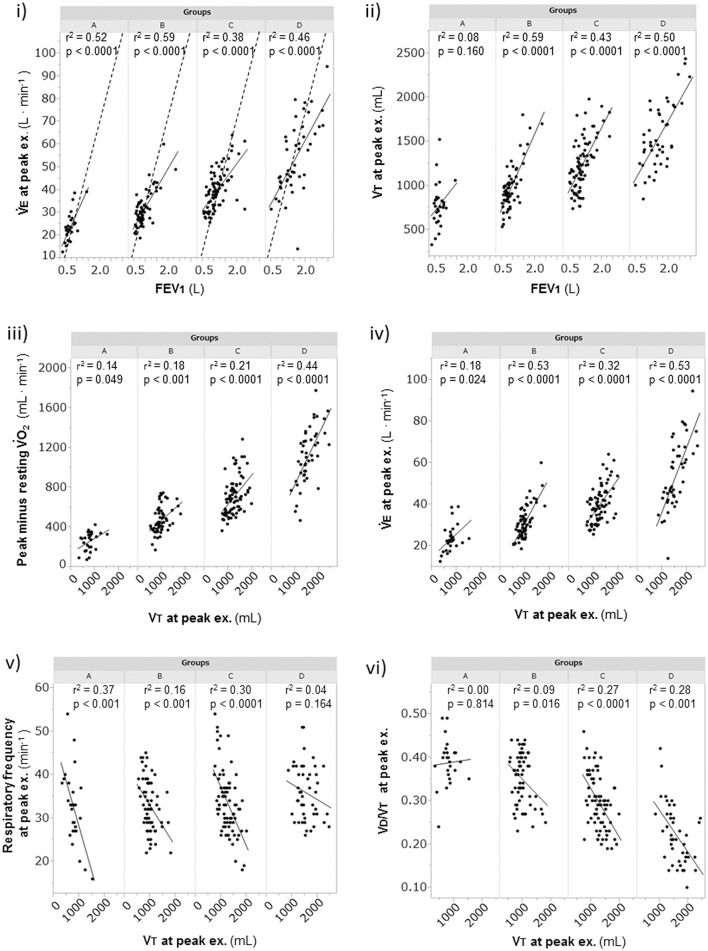
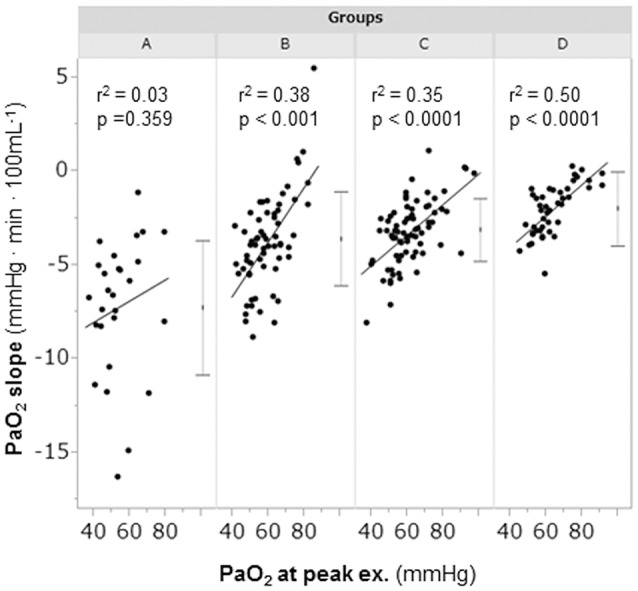
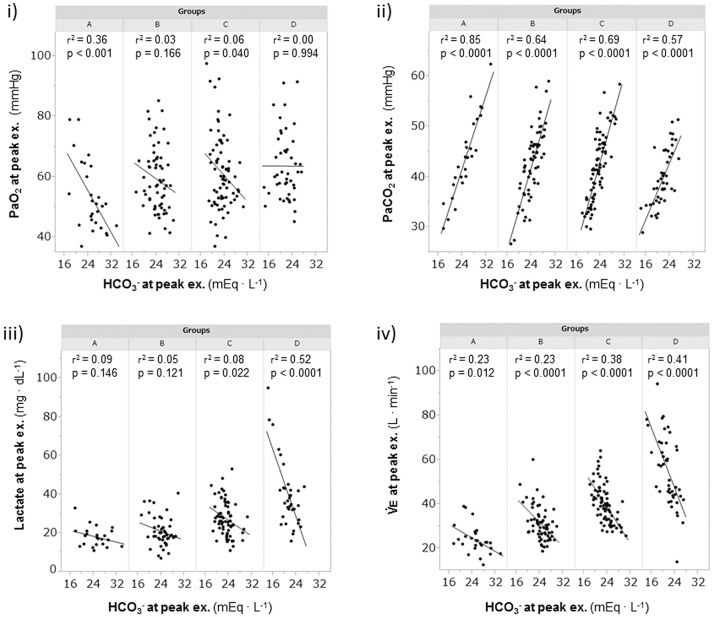
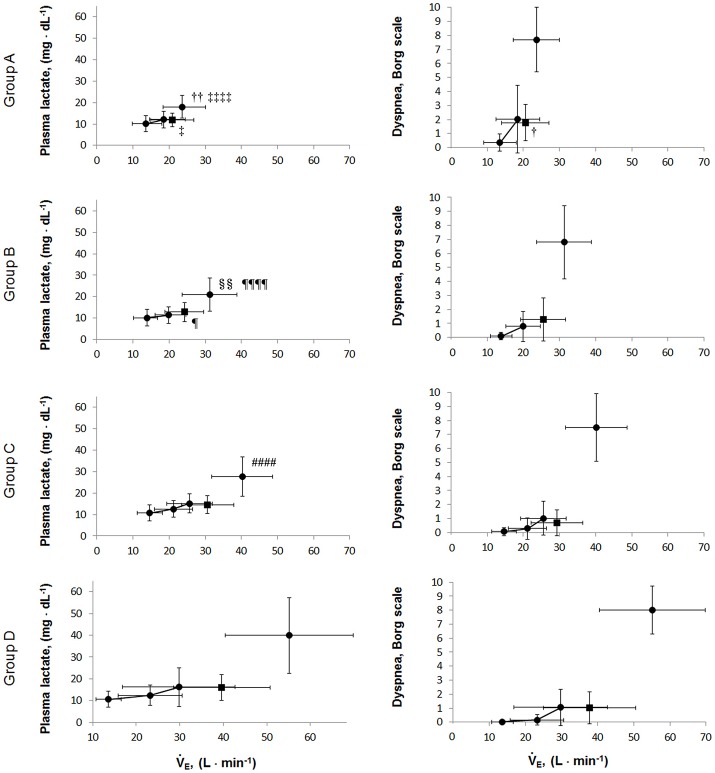
Background: Patients with chronic obstructive pulmonary disease (COPD) show varying mechanisms of exertional dyspnea with different exercise capacities. Methods: To investigate the pathophysiologic conditions related to exertional dyspnea, 294 COPD patients were evaluated using cardiopulmonary exercise testing (CPET) with arterial blood analyses, with the patients classified into two groups according to their exercise limitation: the leg fatigue group (n = 58) and the dyspnea group (n = 215). The dyspnea group was further subdivided into four groups based on peak oxygen uptake ( in mL/min/kg): group A (< 11), group B (11 to < 15), group C (15 to < 21), and group D (≥21). Results: In the dyspnea group, group A (n = 28) showed the following findings: (i) the forced expiratory volume in 1 s was not correlated with the peak (p = 0.288), (ii) the arterial oxygen tension (PaO2) slope (peak minus resting PaO2/Δ ) was the steepest (p < 0.0001) among all subgroups, (iii) reduced tidal volume (VT) was negatively correlated with respiratory frequency at peak exercise (p < 0.0001), and (iv) a break point in exertional VT curve was determined in 17 (61%) patients in group A. In these patients, there was a significant negative correlation between bicarbonate ion ( ) levels at peak exercise and VT level when the VT-break point occurred (p = 0.032). In group D (n = 46), levels were negatively correlated with plasma lactate levels (p < 0.0001). In all subgroups, the level was negatively correlated with minute ventilation. The dyspnea subgroups showed no significant differences in the overall mean pH [7.363 (SD 0.039)] and Borg scale scores [7.4 (SD, 2.3)] at peak exercise. Conclusions: During exercise, ventilation is stimulated to avoid arterial blood acidosis and hypoxemia, but ventilatory stimulation is restricted in the setting of reduced respiratory system ability. These conditions provoke the exertional dyspnea in COPD. Although symptom levels were similar, the exertional pathophysiologic conditions differed according to residual exercise performance; moreover, COPD patients showed great inter-individual variability. An adequate understanding of individual pathophysiologic conditions using CPET is essential for proper management of COPD patients.
Keywords: COPD; acidosis; cardiopulmonary exercise testing; dyspnea; exercise tolerance; hypoxemia; norepinephrine.
Figures
Similar articles
-
Motor Pathophysiology Related to Dyspnea in COPD Evaluated by Cardiopulmonary Exercise Testing.Diagnostics (Basel). 2021 Feb 21;11(2):364. doi: 10.3390/diagnostics11020364. Diagnostics (Basel). 2021. PMID: 33670051 Free PMC article. Review.
-
Exercise training improves exertional dyspnea in patients with COPD: evidence of the role of mechanical factors.Chest. 2003 Jun;123(6):1794-802. doi: 10.1378/chest.123.6.1794. Chest. 2003. PMID: 12796152
-
Evaluation of Exertional Ventilatory Parameters Using Oscillometry in COPD.Int J Chron Obstruct Pulmon Dis. 2020 Jul 13;15:1697-1711. doi: 10.2147/COPD.S260735. eCollection 2020. Int J Chron Obstruct Pulmon Dis. 2020. PMID: 32764915 Free PMC article.
-
Differences in physiological response to exercise in patients with different COPD severity.Respir Care. 2014 Feb;59(2):252-62. doi: 10.4187/respcare.02201. Epub 2013 Jul 2. Respir Care. 2014. PMID: 23821762
-
Ventilatory Inefficiency and Exertional Dyspnea in Early Chronic Obstructive Pulmonary Disease.Ann Am Thorac Soc. 2017 Jul;14(Supplement_1):S22-S29. doi: 10.1513/AnnalsATS.201612-1033FR. Ann Am Thorac Soc. 2017. PMID: 28345959 Review.
Cited by
-
Laryngeal widening and adequate ventilation by expiratory pressure load training improve aerobic capacity in COPD: a randomised controlled trial.Thorax. 2023 Dec 15;79(1):23-34. doi: 10.1136/thorax-2022-219755. Thorax. 2023. PMID: 37696622 Free PMC article. Clinical Trial.
-
Motor Pathophysiology Related to Dyspnea in COPD Evaluated by Cardiopulmonary Exercise Testing.Diagnostics (Basel). 2021 Feb 21;11(2):364. doi: 10.3390/diagnostics11020364. Diagnostics (Basel). 2021. PMID: 33670051 Free PMC article. Review.
-
Pulmonary rehabilitation for people with chronic obstructive pulmonary disease: A protocol for an overview of Cochrane reviews.Medicine (Baltimore). 2019 Sep;98(38):e17129. doi: 10.1097/MD.0000000000017129. Medicine (Baltimore). 2019. PMID: 31567952 Free PMC article.
-
Skeletal muscle is associated with exercise tolerance evaluated by cardiopulmonary exercise testing in Japanese patients with chronic obstructive pulmonary disease.Sci Rep. 2021 Aug 5;11(1):15862. doi: 10.1038/s41598-021-95413-9. Sci Rep. 2021. PMID: 34354171 Free PMC article.
-
Value of Cardiopulmonary Exercise Testing in the Prognosis Assessment of Chronic Obstructive Pulmonary Disease Patients: A Retrospective, Multicentre Cohort Study.Respiration. 2022;101(4):353-366. doi: 10.1159/000519750. Epub 2021 Nov 19. Respiration. 2022. PMID: 34802005 Free PMC article.
References
-
- American Thoracic Society (1995a). Standards for the diagnosis and care of patients with chronic obstructive pulmonary disease. Am. J. Respir. Crit. Care Med. 152, S77–S121. - PubMed
LinkOut - more resources
Full Text Sources