. 2018 Oct 2:9:2168.
doi: 10.3389/fimmu.2018.02168. eCollection 2018.

iNKT Cells Suppress Pathogenic NK1.1+CD8+ T Cells in DSS-Induced Colitis

Affiliations

iNKT Cells Suppress Pathogenic NK1.1+CD8+ T Cells in DSS-Induced Colitis

Sung Won Lee et al. Front Immunol. .

Abstract

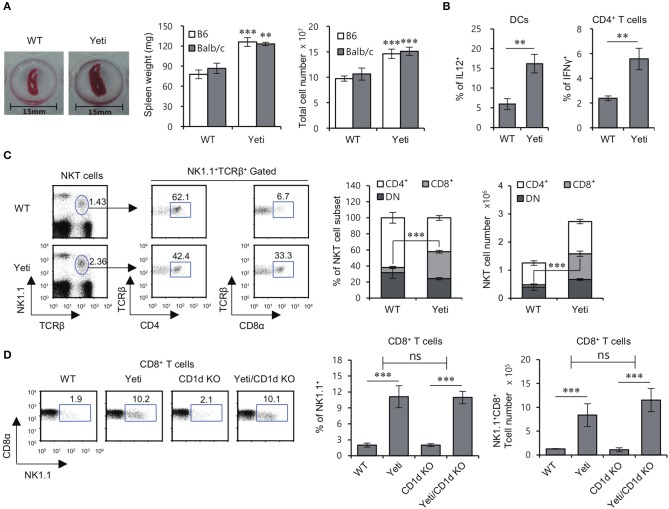
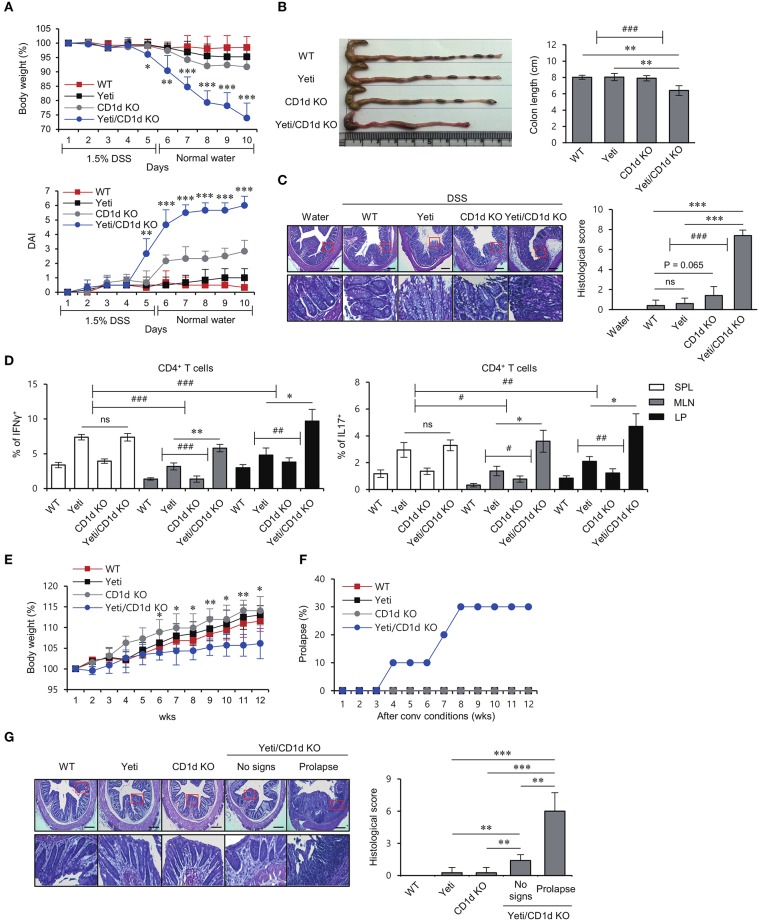
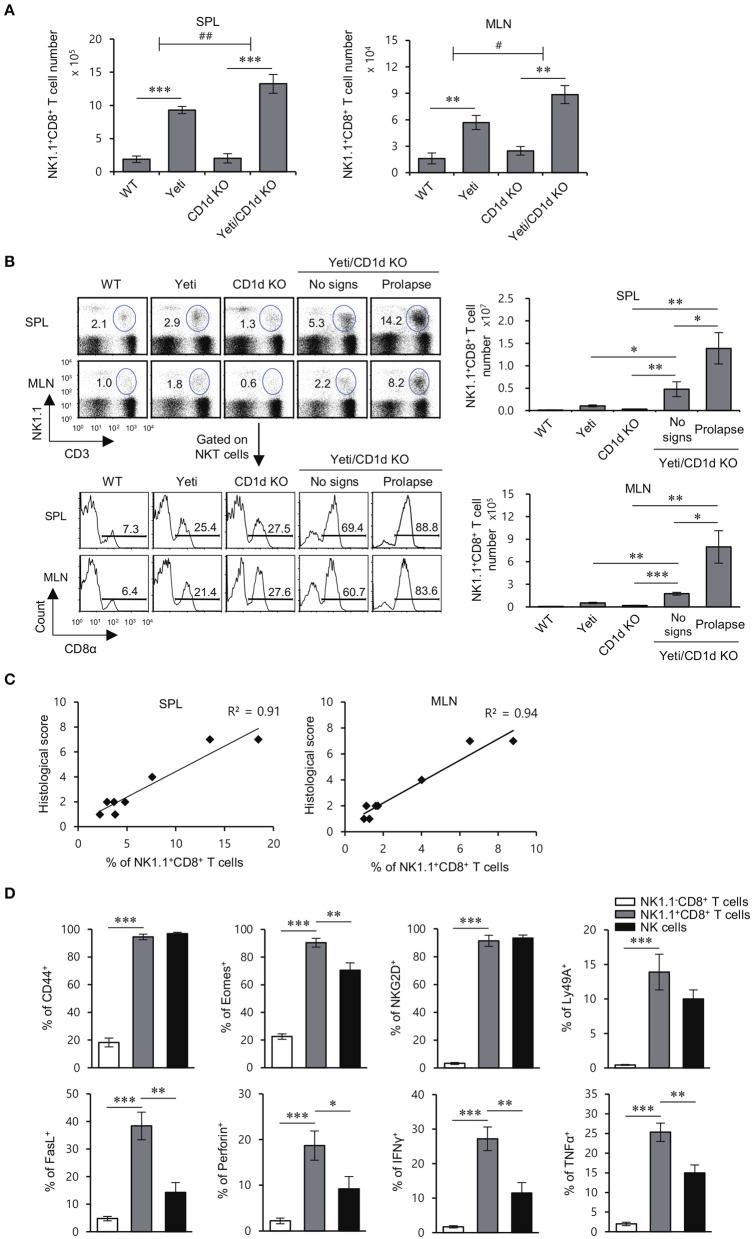
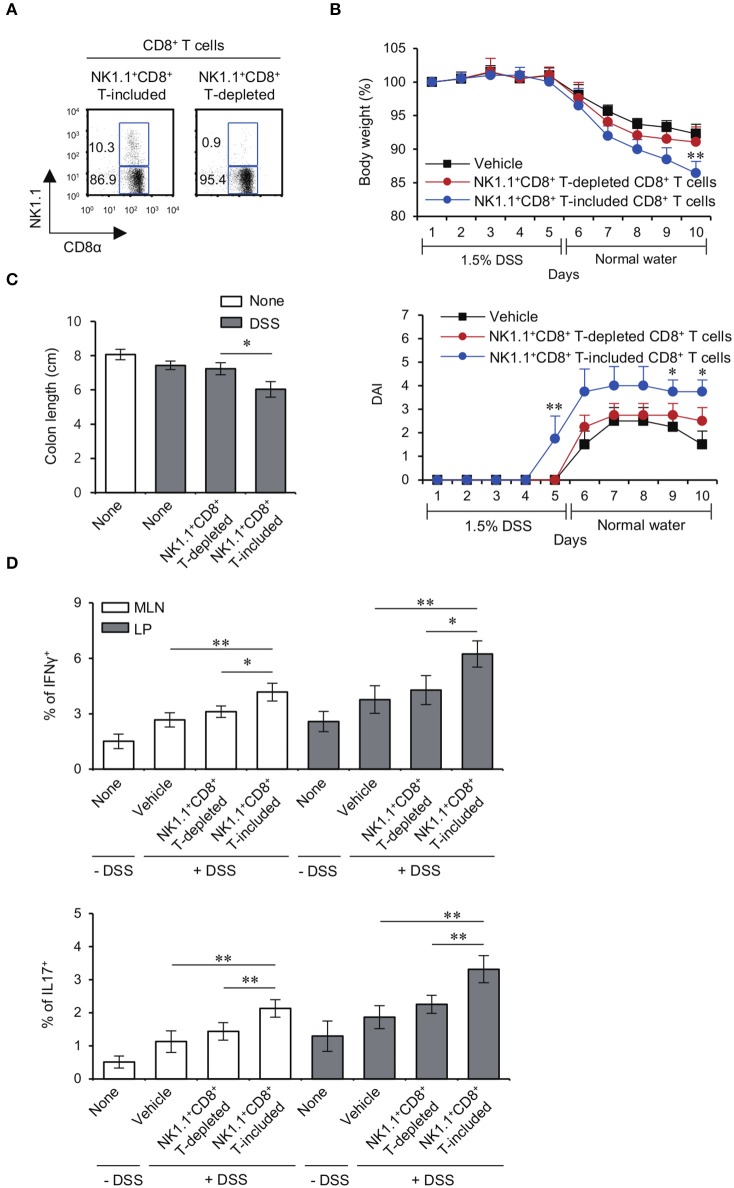
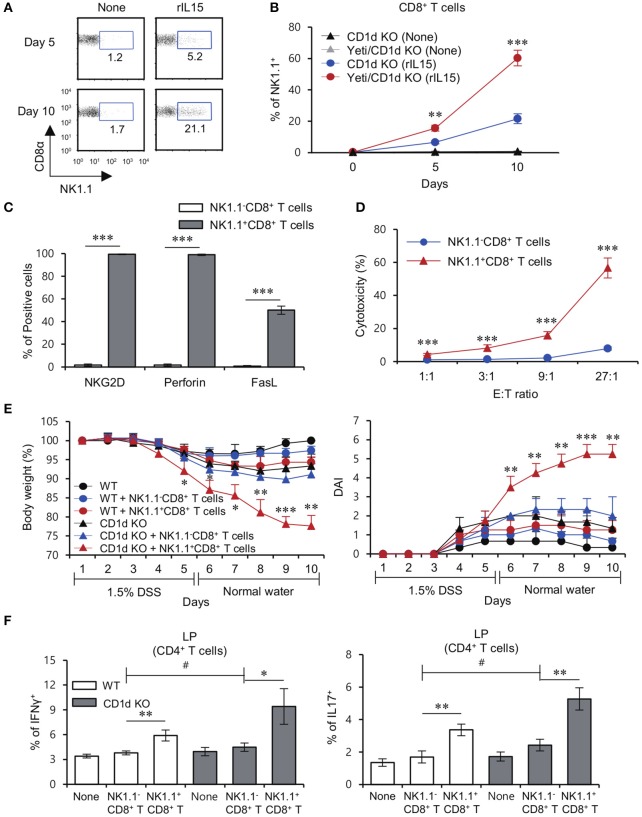
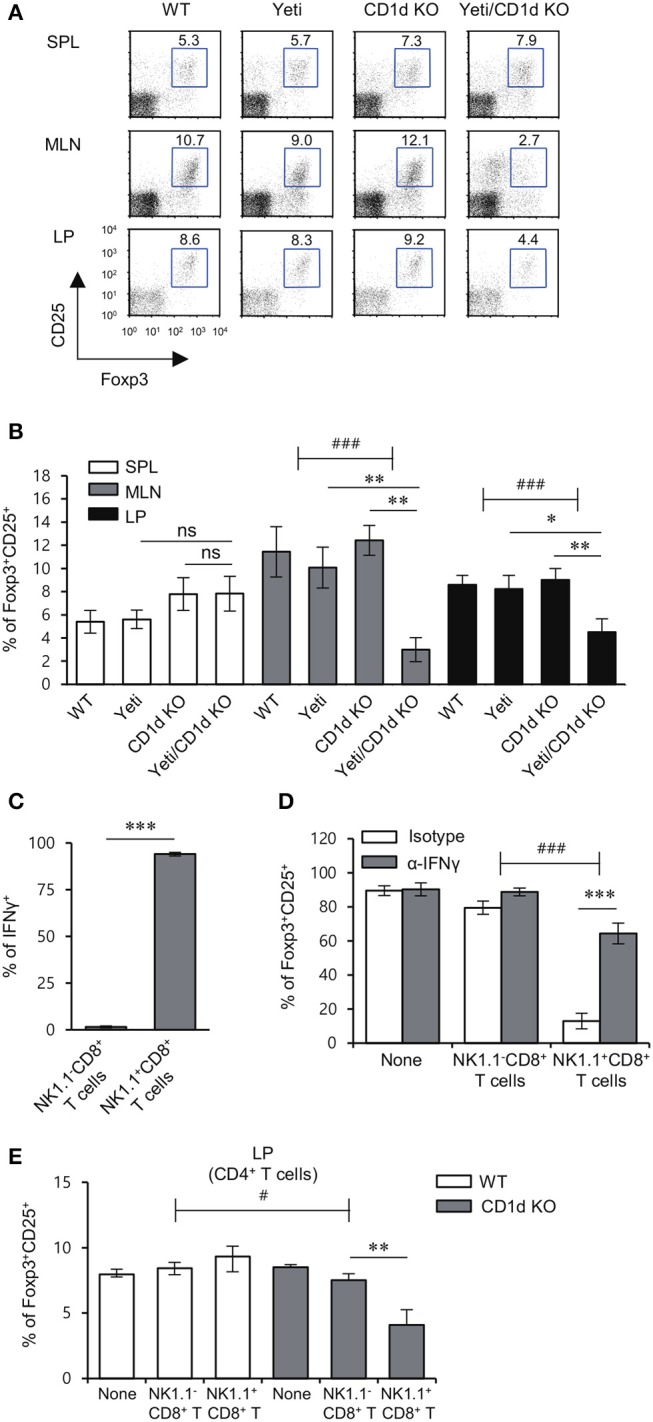
T cells producing IFNγ play a pathogenic role in the development of inflammatory bowel disease (IBD). To investigate the functions of CD1d-dependent invariant natural killer T (iNKT) cells in experimental colitis induced in Yeti mice with dysregulated expression of IFNγ, we generated iNKT cell-deficient Yeti/CD1d KO mice and compared colitis among WT, CD1d KO, Yeti, and Yeti/CD1d KO mice following DSS treatment. We found that deficiency of iNKT cells exacerbated colitis and disease pathogenesis was mainly mediated by NK1.1+CD8+ T cells. Furthermore, the protective effects of iNKT cells correlated with up-regulation of regulatory T cells. Taken together, our results have demonstrated that CD1d-dependent iNKT cells and CD1d-independent NK1.1+CD8+ T cells reciprocally regulate the development of intestinal inflammatory responses mediated by IFNγ-dysregulation. These findings also identify NK1.1+CD8+ T cells as novel target cells for the development of therapeutics for human IBD.

Keywords: CD1d-dependent NKT cells; DSS-induced colitis; IFNγ; NK1.1+CD8+ T cells; Treg cells.


Figures

Figure 1
Figure 1
Altered NKT cell subsets in Yeti mice. (A) Left, a representative picture of the spleens from 8-week-old WT B6 and heterozygous Yeti B6 mice. Middle and Right, Spleen weight and splenocyte number in Yeti B6 and Yeti Balb/c mice, as compared with WT B6 and Balb/c mice. (B) Intracellular IL12 production by isolated DCs (CD11c+) from WT B6 and Yeti B6 mice was assessed by flow cytometry. Intracellular IFNγ production was assessed in splenic CD4+ T cells from WT B6 or Yeti B6 mice by flow cytometry. (C) The percentage of NK1.1+TCRβ+ cells among splenocytes and the percentage of either CD4+ or CD8α+ populations among NK1.1+ T cells from 8-week-old WT and Yeti mice are plotted. The proportion and absolute cell numbers of CD4+, CD8+, and DN NK1.1+ T cells were assessed in WT and Yeti mice at the age of 8 weeks. (D) The percentage of NK1.1+ populations among CD8α+ T cells from 8-week-old WT, Yeti, CD1d KO, and Yeti/CD1d KO mice are plotted. The mean values ± SD (n = 4 per group in the experiment; Student's t-test; **P < 0.01, ***P < 0.001) are shown. Two-way ANOVA (Yeti × iNKT) showed an interaction between these two factors (ns, not significant).
Figure 2
Figure 2
Lack of iNKT cells accelerates intestinal inflammation in Yeti mice. Daily body weight changes, DAI score (A) and colon length (B) of WT, Yeti, CD1d KO, and Yeti/CD1d KO mice were evaluated after 1.5% DSS treatment. Data are representative of three independent experiments with similar results. (C) On day 10, distal colons from each group were sectioned and stained with H&E. (D) Intracellular IFNγ and IL17 production were assessed in splenic, MLN, and LP CD4+ T cells from these mice by flow cytometry on day 10. The mean values ± SD (n = 5 per group in the experiment; Student's t-test; *P < 0.05, **P < 0.01, ***P < 0.001) are shown. Two-way ANOVA (Yeti × iNKT and genotype × tissue) showed an interaction between these two factors (#P < 0.05, ##P < 0.01, ###P < 0.001). Daily body weight changes (E) and prolapse rate (F) of WT, Yeti, CD1d KO, and Yeti/CD1d KO mice housed for 12 weeks under conventional conditions. (n = 7 for WT, Yeti, and CD1d KO mice; n = 10 for Yeti/CD1d KO mice; Student's t-test; *P < 0.05, **P < 0.01). (G) Left, distal colons from these mice were sectioned and stained with H&E at week 12. Right, histologic damages were scored from H&E-stained sections at week 12. (n = 5 for WT, Yeti, and CD1d KO mice; n = 5 for Yeti/CD1d KO mice (no signs); n = 3 for Yeti/CD1d KO (prolapse); Student's t-test; **P < 0.01, ***P < 0.001).
Figure 3
Figure 3
The development of colitis in Yeti/CD1d KO mice is associated with increased numbers of NK1.1+CD8+ T cells. The spleen and MLN were obtained from 1.5% DSS-treated WT, Yeti, CD1d KO, and Yeti/CD1d KO mice at day 10. (A) The absolute numbers of NK1.1+CD8+ T cells in the indicated tissues from these mice were assessed by flow cytometry at day 10. The mean values ± SD (n = 5 per group in the experiment; Student's t-test; **P < 0.01, ***P < 0.001) are shown. Two-way ANOVA (Yeti × iNKT) showed an interaction between these two factors (#P < 0.05, ##P < 0.01). (B,C) The spleen and MLN were isolated from WT, Yeti, CD1d KO, and Yeti/CD1d KO mice at 12 weeks after initiation of conventional housing conditions. (B) Upper left, the percentage of NK1.1+CD3+ cells among splenocytes and MLN cells of these mice was determined at week 12. Lower left, the frequency of the CD8α+ population among NK1.1+CD3+ cells from the spleen and MLN of these mice was determined at week 12. Right, the absolute numbers of NK1.1+CD8+ T cells in the spleen and MLN were assessed by flow cytometry at week 12. (n = 5 for WT, Yeti, and CD1d KO mice; n = 5 for Yeti/CD1d KO mice (no signs); n = 3 for Yeti/CD1d KO (prolapse); Student's t-test; *P < 0.05, **P < 0.01, ***P < 0.001). (C) Scatter graphs and linear regression analysis of the relationship between the frequency of NK1.1+CD8+ T cells among total splenocytes or MLN cells and histological score of colon tissue sections in Yeti/CD1d KO mice. The Pearson's correlation coefficient (R2) for each plot is indicated. (n = 5 for Yeti/CD1d KO mice (no signs); n = 3 for Yeti/CD1d KO (prolapse)). (D) The expression of CD44, Eomes, NKG2D, Ly49a, FasL, perforin, IFNγ, and TNFα among NK1.1CD8+ T cells, NK1.1+CD8+ T cells, and NK cells of the MLN from 1.5% DSS-treated Yeti/CD1d KO mice was evaluated by flow cytometry on day 10. The mean values ± SD (n = 4 in A–C; n = 5 in D; per group in the experiment; Student's t-test; *P < 0.05, **P < 0.01, ***P < 0.001) are shown.
Figure 4
Figure 4
The NK1.1+ population among CD8+ T cells is mainly responsible for colitis in Yeti mice. (A) The percentage of NK1.1+CD8+ T cells among total CD8+ T cells and NK1.1+ cell-depleted CD8+ T cells from the MLN of Yeti/CD1d KO mice was determined. (B–D) Either total CD8+ T cells (2 × 10⁶) or NK1.1CD8+ T cells (2 × 10⁶) from Yeti/CD1d KO mice were i.v. transferred to CD1d KO mice. Daily body weight changes, DAI score (B), and colon length (C) of each group were evaluated after 1.5% DSS treatment. (D) Intracellular IFNγ and IL17 production and the frequencies of Foxp3+CD25+ cells were assessed in the MLN and LP CD4+ T cells from these mice by flow cytometry on day 10. The mean values ± SD (n = 5 per group in the experiment; Student's t-test; *P < 0.05, **P < 0.01) are shown.
Figure 5
Figure 5
CD1d-restricted iNKT cells exhibit inhibitory effects on the pathogenesis of NK1.1+CD8+ T cell-mediated colitis. (A) Purified NK1.1+ cell-depleted CD8+ T cells from the MLN of CD1d KO mice were cultured with rIL15 for 5 or 10 days. The percentage of the NK1.1+ population among all CD8+ T cells was evaluated by flow cytometry at the indicated time points. (B) Purified NK1.1CD8+ T cells from the MLN of CD1d KO and Yeti/CD1d KO mice were cultured with rIL15 for 5 or 10 days. The percentage of the NK1.1+ population among total CD8+ T cells was evaluated by flow cytometry at the indicated time points. (C) The expression of NKG2D, perforin, and FasL among unstimulated NK1.1CD8+ T cells or IL15-stimulated NK1.1+CD8+ T cells were assessed by flow cytometry on day 10 after cytokine stimulation. (D) Cytotoxicity of either unstimulated NK1.1CD8+ T cells or IL15-stimulated NK1.1+CD8+ T cells from the CD1d KO MLN was evaluated using 7-AAD/CFSE assay. (E,F) Either NK1.1CD8+ T cells (1 × 10⁶) or IL15-stimulated NK1.1+CD8+ T cells (1 × 10⁶) from the CD1d KO MLN were i.v. transferred to CD1d KO mice. (E) Daily body weight changes and DAI score of each group were evaluated 10 days after 1.5% DSS treatment. (F) Intracellular IFNγ and IL17 production in LP CD4+ T cells from these mice were determined by flow cytometry on day 10. The mean values ± SD (n = 3 in D; n = 4 in A–C; n = 5 in E and F; per group in the experiment; Student's t-test; *P < 0.05, **P < 0.01, ***P < 0.001) are shown. Two-way ANOVA (genotype × treatment) showed an interaction between these two factors (#P < 0.05).
Figure 6
Figure 6
iNKT cells prevent the reduction in the Treg population induced by NK1.1+CD8+ T cells. (A,B) The spleen, MLN, and LP were obtained from WT, Yeti, CD1d KO, and Yeti/CD1d KO mice at 10 days after 1.5% DSS treatment. The percentage of Foxp3+CD25+ cells among CD4+ T cells from the spleen, MLN, and LP of each group was evaluated by flow cytometry on day 10. Data are representative of three independent experiments with similar results. The mean values ± SD (n = 5 per group in the experiment; Student's t-test; *P < 0.05, **P < 0.01) are shown. Two-way ANOVA (Yeti × iNKT) showed an interaction between these two factors (###P < 0.001). (C) The expression of IFNγ among unstimulated NK1.1CD8+ T cells or IL15-stimulated NK1.1+CD8+ T cells were assessed by flow cytometry on day 10 after cytokine stimulation. (D) Naive CD4+CD62L+ T cells were co-cultured in Treg-polarizing conditions for 5 days with either unstimulated NK1.1CD8+ T cells (1 × 10⁴ cells) or IL15-stimulated NK1.1+CD8+ T cells (1 × 10⁴ cells) from the CD1d KO MLN. Neutralizing mAb specific to IFNγ was added during the culture. The frequency of Foxp3+CD25+ cells among CD4+ T cells was evaluated by flow cytometry on day 5. Two-way ANOVA (treatment × cell type) showed an interaction between these two factors (###P < 0.001). (E) Either NK1.1CD8+ T cells (1 × 10⁶) or IL15-stimulated NK1.1+CD8+ T cells (1 × 10⁶) from the CD1d KO MLN were i.v. transferred to CD1d KO mice. The frequencies of Foxp3+CD25+ cells in LP CD4+ T cells from these mice were determined by flow cytometry on day 10. The mean values ± SD (n = 4 in C and D; n = 5 in E; per group in the experiment; Student's t-test; *P < 0.05, **P < 0.01, ***P < 0.001) are shown. Two-way ANOVA (genotype × treatment) showed an interaction between these two factors (#P < 0.05).

Similar articles

Cited by

References

    1. Maloy KJ, Powrie F. Intestinal homeostasis and its breakdown in inflammatory bowel disease. Nature (2011) 474:298–306. 10.1038/nature10208 - DOI - PubMed
    1. Kempski J, Brockmann L, Gagliani N, Huber S. TH17 cell and epithelial cell crosstalk during inflammatory bowel disease and carcinogenesis. Front Immunol. (2017) 8:1373. 10.3389/fimmu.2017.01373 - DOI - PMC - PubMed
    1. Abraham C, Medzhitov R. Interactions between the host innate immune system and microbes in inflammatory bowel disease. Gastroenterology (2011) 140:1729–37. 10.1053/j.gastro.2011.02.012 - DOI - PMC - PubMed
    1. Park HJ, Lee SW, Kwon DJ, Heo SI, Park SH, Kim SY, et al. . Oral administration of taheebo (Tabebuia avellanedae Lorentz ex Griseb.) water extract prevents DSS-induced colitis in mice by up-regulating type II T helper immune responses. BMC Complement Altern Med. (2017) 17:448. 10.1186/s12906-017-1952-4 - DOI - PMC - PubMed
    1. Park HJ, Lee SW, Hong S. Regulation of allergic immune responses by microbial metabolites. Immune Netw. (2018) 18:e15. 10.4110/in.2018.18.e15 - DOI - PMC - PubMed

Publication types