

Screening Oat Genotypes for Tolerance to Salinity and Alkalinity
- PMID: 30333838
- PMCID: PMC6176118
- DOI: 10.3389/fpls.2018.01302
Screening Oat Genotypes for Tolerance to Salinity and Alkalinity
Abstract
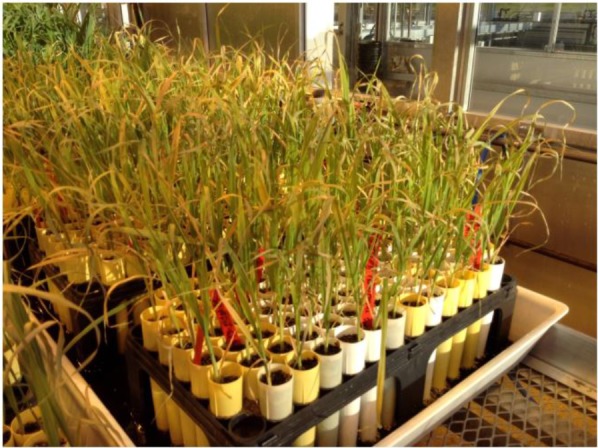
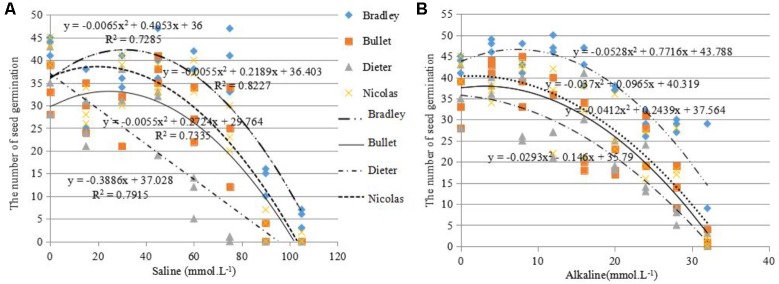
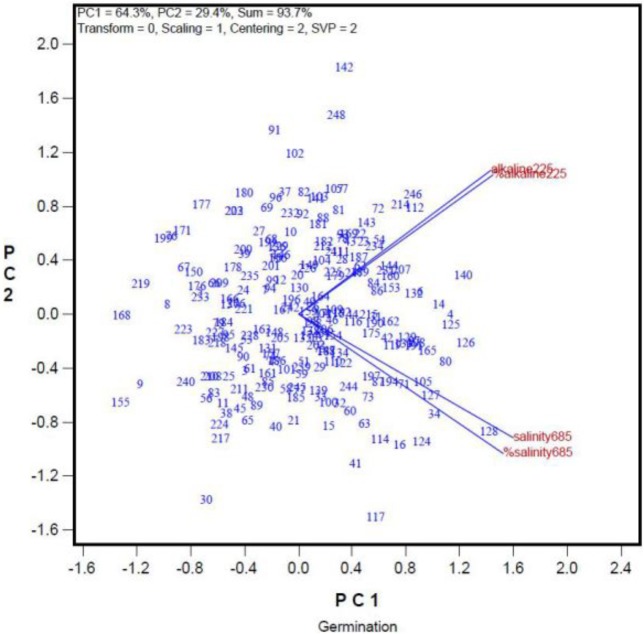
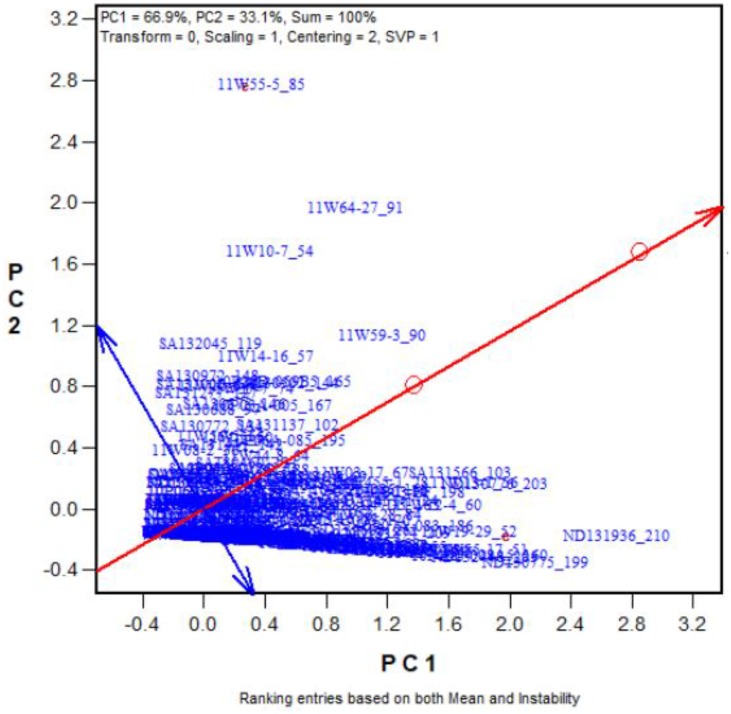
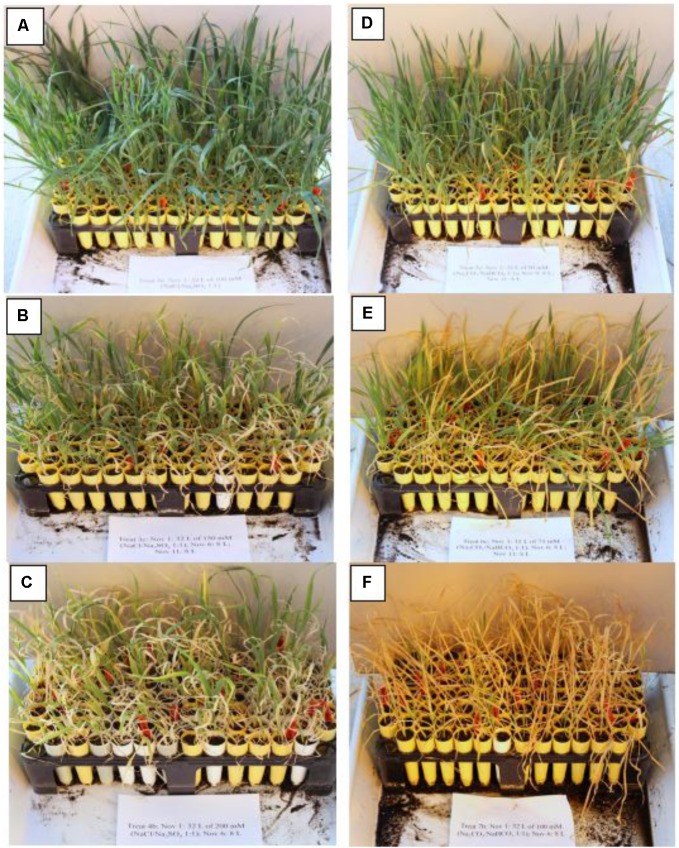
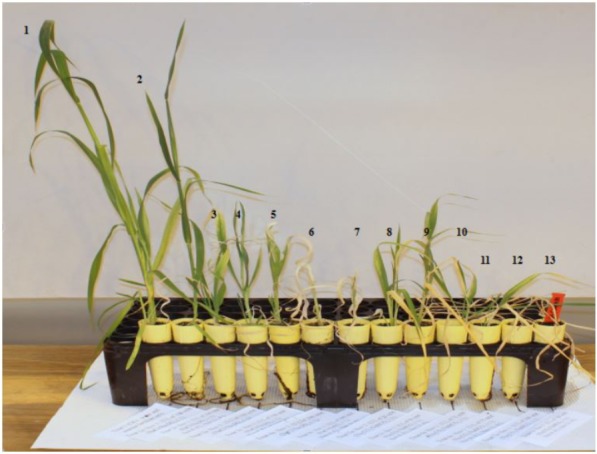
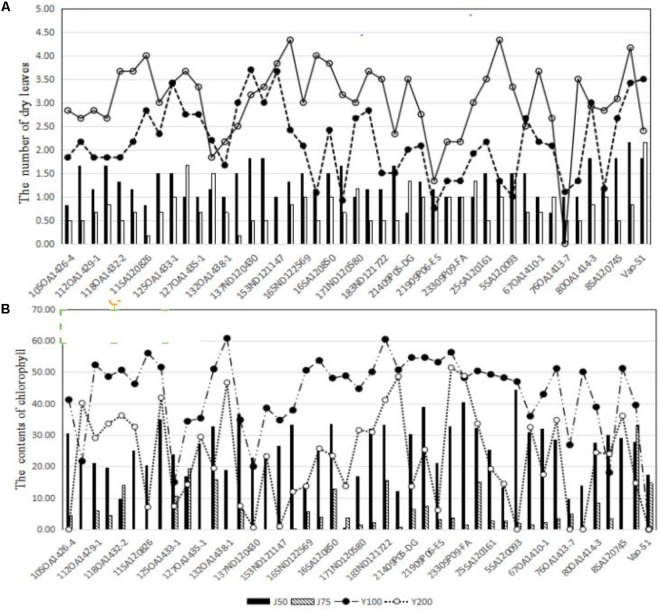
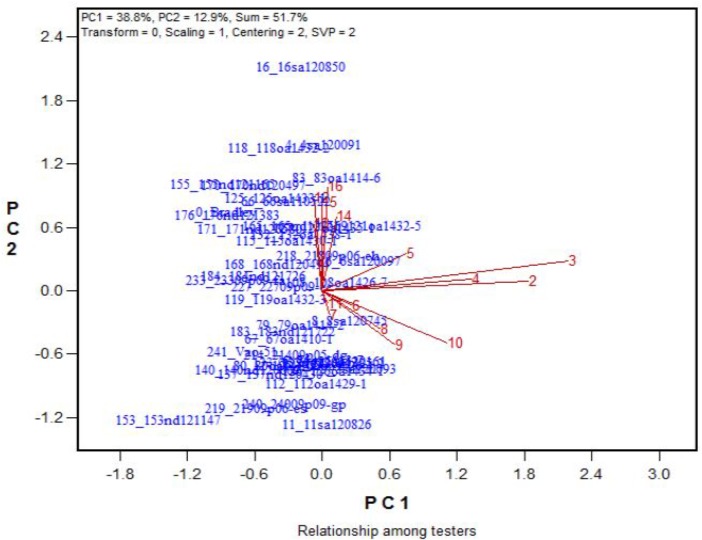
A set of four experiments was conducted to develop methods for screening oat tolerance to salt and alkali and the following results were obtained. (1) In experiment 1, 68.5 mmol L-1 salt and 22.5 mmol L-1 alkali were identified as appropriate concentrations for determining oat tolerance to salinity and alkalinity during germination. (2) These concentrations were used in experiment 2 to screen 248 oat genotypes and 21 were identified to be tolerant to salinity and alkalinity in germination. (3) In experiment 3, one salt treatment, 40 L of Na2SO4:NaCl (1:1), 150 mmol L-1, was found to be optimal for screening oat tolerance to salinity during growth and development. For alkalinity tolerance, the optimal treatment was 40 L of Na2CO3:NaHCO3 (1:1) at 75 mmol L-1. (4) No significant correlation was found between tolerances at the germination and adult stages or between tolerances to salt and alkali. Three lines were found to be tolerant to both salt and alkali in both germination and adult stages. (5) In experiment 4, 25 out of 262 oat genotypes were found to be tolerant to both salinity and alkalinity. (6) GGE biplot analysis was found to be effective in interpreting the multivariate data and the plastic cone-container system was found to be cost-effective system for screening adult plant tolerance to salt and alkali. (7) The symptoms of salt stress and alkali stress were found to be different; alkali stress mainly reduces the chlorophyll content, while salinity mainly disrupts water absorption.
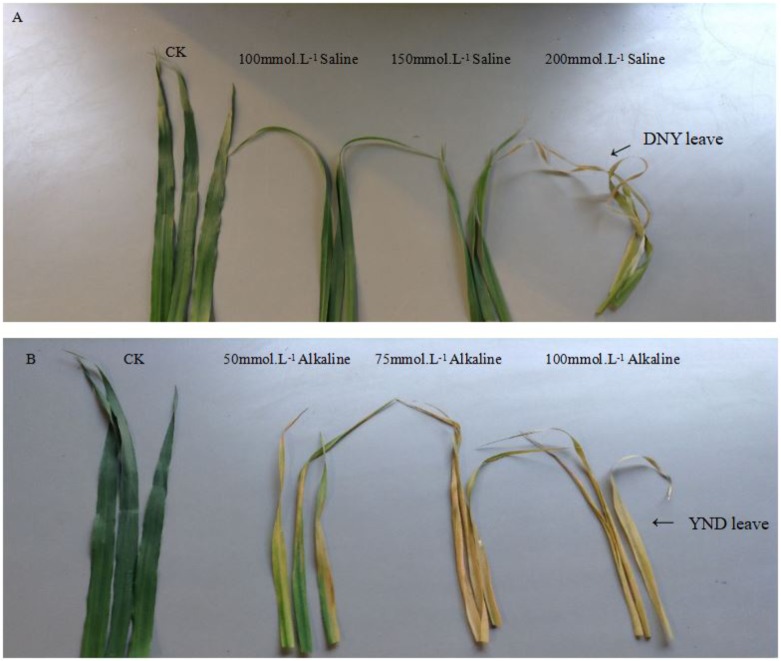
Keywords: GGE-biplot; alkali tolerance; cone-tainer; oat; salt tolerance; screening method.
Figures


Similar articles
-
Effect of salt, alkali and combined stresses on root system architecture and ion profiling in a diverse panel of oat (Avena spp.).Funct Plant Biol. 2024 Jan;51(1):NULL. doi: 10.1071/FP23031_CO. Funct Plant Biol. 2024. PMID: 37743054
-
Screening of salt tolerance of maize (Zea mays L.) lines using membership function value and GGE biplot analysis.PeerJ. 2024 Jan 29;12:e16838. doi: 10.7717/peerj.16838. eCollection 2024. PeerJ. 2024. PMID: 38304185 Free PMC article.
-
Germination Responses of Ryegrass (Annual vs. Perennial) Seed to the Interactive Effects of Temperature and Salt-Alkali Stress.Front Plant Sci. 2018 Oct 9;9:1458. doi: 10.3389/fpls.2018.01458. eCollection 2018. Front Plant Sci. 2018. PMID: 30356802 Free PMC article.
-
The Potential of Endophytes in Improving Salt-Alkali Tolerance and Salinity Resistance in Plants.Int J Mol Sci. 2023 Nov 29;24(23):16917. doi: 10.3390/ijms242316917. Int J Mol Sci. 2023. PMID: 38069239 Free PMC article. Review.
-
Salt Tolerance in Soybeans: Focus on Screening Methods and Genetics.Plants (Basel). 2023 Dec 28;13(1):97. doi: 10.3390/plants13010097. Plants (Basel). 2023. PMID: 38202405 Free PMC article. Review.
Cited by
-
Transcriptomic and Metabolomic Insights into the Effects of Arbuscular Mycorrhizal Fungi on Root Vegetative Growth and Saline-Alkali Stress Response in Oat (Avena sativa L.).J Fungi (Basel). 2025 Aug 9;11(8):587. doi: 10.3390/jof11080587. J Fungi (Basel). 2025. PMID: 40863539 Free PMC article.
-
Differences in Physiological Responses of Two Oat (Avena nuda L.) Lines to Sodic-Alkalinity in the Vegetative Stage.Plants (Basel). 2020 Sep 11;9(9):1188. doi: 10.3390/plants9091188. Plants (Basel). 2020. PMID: 32933050 Free PMC article.
-
Genome-wide analysis of the phosphate transporter gene family in oats: insights into phosphorus and water deficiency responses.J Appl Genet. 2025 Apr 1. doi: 10.1007/s13353-025-00965-5. Online ahead of print. J Appl Genet. 2025. PMID: 40164903
-
Proteomic Responses to Alkali Stress in Oats and the Alleviatory Effects of Exogenous Spermine Application.Front Plant Sci. 2021 Apr 1;12:627129. doi: 10.3389/fpls.2021.627129. eCollection 2021. Front Plant Sci. 2021. PMID: 33868329 Free PMC article.
-
Metabolic and Physiological Changes in the Roots of Two Oat Cultivars in Response to Complex Saline-Alkali Stress.Front Plant Sci. 2022 Mar 29;13:835414. doi: 10.3389/fpls.2022.835414. eCollection 2022. Front Plant Sci. 2022. PMID: 35422836 Free PMC article.
References
-
- Abate F., Mekbib F., Dessalegn Y. (2015). GGE Biplot analysis of multi-environment yield trials of durum wheat (Triticum turgidum Desf.) genotypes in north western Ethiopia. Am. J. Exp. Agric. 8 120–129. 10.9734/AJEA/2015/9994 - DOI
-
- Bai J. H., Liu J. H., Zhang N., Yang J. H., Sa R. L., Wu L. (2013). Effect of alkali stress on soluble sugar, antioxidant enzymes and yield of oat. J. Integr. Agric. 12 1441–1449. 10.1016/S2095-3119(13)60556-0 - DOI
-
- Campbell S. A., Nishio J. N. (2000). Iron deficiency studies of sugar beet using an improved sodium bicarbonate-buffered hydroponic growth system. J. Plant Nutr. 23 741–757. 10.1080/01904160009382056 - DOI
-
- El-Hendawy S. E., Ruan Y., Hu Y., Schmidhalter U. (2009). A comparison of screening criteria for salt tolerance in wheat under field and controlled environmental conditions. J. Agron. Crop Sci. 195 356–367. 10.1111/j.1439-037X.2009.00372.x - DOI
LinkOut - more resources
Full Text Sources